Research Article - Biomedical Research (2017) Volume 28, Issue 20
Analysis of various edge detection techniques for dosimeter bubble detector images
Thamotharan B1*, Venkatraman B2, Anusuya A1, Chandrasekaran S3, Ramakrishnan S1 and Karthikeyan MP1
1School of Computing, SASTRA University, Thanjavur, India
2HSEG, IGCAR, Kalpakkam, India
3So(F), RSD, IGCAR, Kalpakkam, India
Accepted date: September 6, 2017
Abstract
The bubble detector is used to detect the amount of neutron and hence used to measure the neutron dose under intense gamma field. Usually, this device is used in the field of atomic energy to manipulate the neutron dosage. The radioactive premises bubbles will be formed based on the radioactive. It can be used to monitor radioactive exposure. The number of nucleated bubbles yields the neutron dose. Hence the accuracy of the measurement depends on the counting of bubbles. This work proposes an image processing based different edge detection technique to find the edges of the bubbles and analyses the edge detection operator. Whereas several algorithms are projected for the aim of image edge detection technique, the matter of finding the image edge detection remains an open challenge in the image processing field, particularly in things wherever the image quality is poor condition. In this paper we deal with the finding and extraction of bubble edge of a Dosimeter bubble detector image using different digital image processing edge detection techniques. This technique is used for finding discontinuities in intensity values. Thereby it is used for finding the boundaries of bubble objects within the image. Here in this study, we can come to know the boundaries of bubbles which can be found in different edge detection technique to get better results for counting bubbles and various advantages and disadvantages of edge detection techniques.
Keywords
Dosimeter, Roberts edge detection, Random noise, Sobel operator, LoG operator
Introduction
Bubble detector dosimeter is used to measure the neutron dosage in the premises. Removing noises from the image may be a difficult task for researchers even until date. There are numerous approaches and techniques that have its own limitations and benefits.
The study based on the concept of edge detection after denoising of digital image before getting data from an image, removal of noises from the image is necessary and thus becomes the first step in image processing [1]. Most of the natural images are assumed to have additive random noise which is modeled as a Gaussian. Thus this paper helps us to know how to apply different edge detection techniques and analyses its result and output images.
Edge Detection
Edges accommodate important features and contain vital data. It considerably reduces the image size and filters out data that will be considered less relevant, therefore conserving the vital structural properties of an image. Most images contain some quantity of redundancies that may generally be removed once edges are detected and replaced throughout the reconstruction. Thus here the edge detection comes into play. Also, edge detection is one among the ways of constructing images that does not take up an excessive amount of space within the hardware. Here in this paper, we will discuss the four edge detection techniques namely:
1. Sobel edge detection operator.
2. Roberts cross operator.
3. Prewitt operator.
4. Canny operator.
An overview of edge detection techniques and comparative study of edge detectors on the dental radiographs and application of edge detectors such as Prewitt, Canny, and Sobel [2]. There are different ways to perform edge detection, which is mainly categorized into two: Gradient and Laplacian. The gradient method finds the edges by calculating the maximum and minimum in the first derivative of the image. Whereas in the Laplacian method, it searches for zero crossing in the second derivative of the image to find the edges. There are disadvantages of using gradient-based edge detection methods in X-ray images [3].
Edge Detection Techniques
Sobel operator
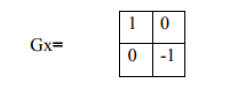
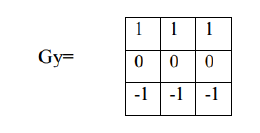
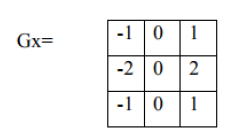
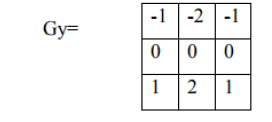
The Sobel edge detector uses two masks, one is vertical and another one is horizontal. These masks use 3 × 3 matrices. Sobel has two main advantages: the random noise of the images are met with smoothing effects and since it is the differential of two rows or two columns, the element on the edge found on both the sides gets enhanced, thus the edge will be thick and bright [4]. This edge detection technique extracts all of the edges, regardless of direction. Thus the resultant image appears as a unidirectional outline of the objects in the original image. The regions which are constantly bright become black, while other regions become highlighted. The derivative can be applied in digital form in several ways. The operator consists of a pair of 3 × 3 convolution kernels, which are represented as follows:
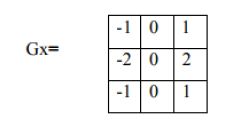
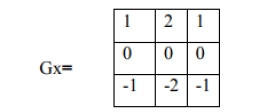
Sobel operator, the gradient magnitude is given by:
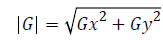 (1)
(1)
The approximate magnitude which is faster to compute is given by [5]:
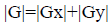 (2)
(2)
The angle of the orientation of the edge is given by:
θ=arctan (Gy/Gx) (3)
Example taken in this paper is (Figure 1):

Figure 1: Sobel operator-input image.
Thus, when Sobel operator is applied, the resulted image is a grayscale. Thus the result so obtained is (Figure 2):

Figure 2: Sobel operator-output image.
Roberts cross operator
The Roberts cross operator performs a quick 2D spatial gradient measurement on an image. It is used to highlight the regions of high spatial frequency which often seems to be the edges detected in an image. The input to the operator often tends to be a grayscale image, the output will also be a grayscale image. Each pixel values at in the output represents the calculable magnitude of the spatial gradient at that time. The 2 × 2 convolution kernel given in Roberts cross operator edge detection technique is as follows:
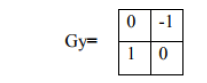
One kernel is just the other turned by 90º, this can be similar to the Sobel operator. Thus the gradient magnitude is given by:
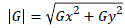 (4)
(4)
And the approximate magnitude which is faster to compute is given by:
|G|=|Gx|+|Gy| (5)
The angle of the orientation of the edge is given by:
=arctan (Gy/Gx)-3/4 (6)
Example taken in this paper, Figure 3 is the input image.

Figure 3: Roberts operator-input image.
When Roberts cross operator is applied, the resulted image is a grayscale image. Thus the result so obtained is (Figure 4):

Figure 4: Roberts operator-output image.
Prewitt operator
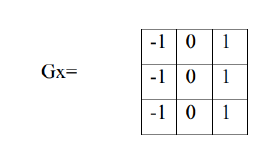
The Prewitt edge filter detects the edges by applying a horizontal and vertical filter in sequence. Both filters are applied to the image and then it is summed to get the final result. This edge detector is one of the best ways to calculate the magnitude and orientation that are found in an edge. It doesn’t place any important role on the pixels that are found closer to the center of the mask [6], unlike Sobel operator. This operator is restricted to eight possible orientations, but most direct orientation estimates don’t seem to be that much correct. The Prewitt mask thus used is a 3 × 3 convolution kernel:
This operator is restricted to eight possible orientations, but most direct orientation estimates don’t seem to be that much correct. This edge detector is estimated in the 3 × 3 neighborhood for all eight directions. Then one convolution mask is selected, which is of largest module [7]. Figure 5, the image is taken as input image.

Figure 5: Prewitt operator-input image.
Thus when Prewitt operator is applied, the resulted image is a grayscale image since the input given to act on Prewitt operator is also a grayscale image. Thus the result so obtained is (Figure 6):

Figure 6: Prewitt operator-output image.
Canny operator
The canny edge detector is also well known to many as the optimal detector, it aims to satisfy three main criteria:
1. Low error rate.
2. Good localization.
3. Minimal response.
There are some steps involved in canny edge detection technique:
Filter out noise if any using the Gaussian filter.
Then find the intensity gradient of the image.
Then find the intensity gradient of the image.
Convolution kernel used in this technique is:
Then the magnitude and gradient strength are calculated.
|G|=|Gx|+|Gy|
θ=arctan (Gy/Gx) (8)
There are 4 possible angles (namely 0, 45, 90 or 135)
Non-maximum suppression is used to remove pixels that are not found to be the part of an edge. Thus only thin lines (candidate edges) will remain.
Hysteresis is the final step where canny uses two thresholds namely: upper and lower
• Pixel is accepted as an edge if the pixel gradient value is higher than the upper threshold.
• Pixel is rejected as an edge if the pixel gradient value is below the lower threshold [8].
• If the value is between the two thresholds, then it will be accepted only if it is connected to a pixel that tends to be above the upper threshold [8].
• The ratio between upper and lower threshold is between 2:1 and 3:1.
Figure 7 is the image taken as input image.

Figure 7: Canny operator-input image.
Thus the result so obtained after applying canny edge detection technique on the input image is (Figure 8):

Figure 8: LoG operator-input image.
Laplacian of Gaussian (Log) operator
Laplacian of a Gaussian operator is otherwise referred to as LoG operator [5]. This method combines Gaussian filtering with Laplacian for detection of an edge. It works by detecting the zero crossings of the second derivative to find the edges in an image. Since the second derivative consists of noise, it has to be removed before edge detection. Since the input image is portrayed as a collection of distinct pixels, we've to seek out a distinct convolution kernel which will approximate the second derivatives within the definition of the Laplacian [1].
In the detection method of the Log operator, we firstly presmooth the image with Gauss low-pass filter, and then find the steep edge in the image using the Log operator. Finally, we supply on banalization with zero gray level to present birth to connected outline and eliminate all internal spots. However double pixels boundary usually seems using the Log operator to find an edge, and the operator is extremely sensitive to noise. Therefore the Log operator is commonly used to evaluate whether the edge pixels belongs to either bright section or dark section of the image. Commonly used discrete approximations are:
Since the convolution operation is associative, we will turn the Gaussian smoothing filter with the Laplacian filter, first of all, and then turn this hybrid filter with the image to attain the desired result. Doing things this manner it has 2 advantages:
• Since both the Gaussian and also the Laplacian kernels are sometimes much smaller than the image, this methodology sometimes needs far fewer arithmetic operations.
• The LoG (‘Laplacian of Gaussian’) kernel may be precalculated beforehand therefore only 1 convolution must be performed at run-time on the image.
The watershed method is used to get the initial segmented image [9]. Then it has been clustered. This approach has reduced the unwanted region by providing the area under suspicion.
Figure 9 is taken as an input image in this paper.

Figure 9: LoG operator-input image.
Thus the result so obtained after applying canny edge detection technique on the input image is (Figure 10):

Figure 10: LoG operator-output image.
Conclusion
Thus, this paper allows us to get a clear idea about the edge detection techniques used in the digital images. Whereas in edge detection, various edge detecting operators are used on the same input image of the bubble dosimeter image to find the best technique. By visual perception, we can conclude clearly that the Sobel, Prewitt, and Roberts give low-quality edge maps relative to the others. A detailed illustration of the edges in an image of this bubble detector dosimeter is obtained through the canny and Laplacian of Gaussian ways. Among the assorted methods investigated, the canny methodology is in a position to find both strong and weak edges and appears to be more appropriate than the Laplacian of Gaussian. A statistical analysis of the performance offers a strong conclusion for this complicated category of images. This analysis of edge detection in the dosimeter bubble detector image will give good idea in the field of atomic to process the measure of the neutron dosage in the radioactive premises. This image processing based edge detector analysis can be applied in the application of bio-medical field to count the number of cells in the blood especially red blood cells and white blood cells.
References
- Gonzalez RC, Woods RE. Digital image processing (2nd edn.). Prentice Hall Upper Saddle River NJ 2001.
- Ansingkar K. Transesophageal three-dimensional color Doppler echocardiographic assessment of valvular and paravalvular mitral prosthetic regurgitation. Echocardiography 2000; 17: 579-583.
- Al-Hameed W. Segmentation of radiographic images of weld defect. J Glob Res Comp Sci 2013; 4: 1.
- Elif A. Sobel edge detection method for Matlab, assistant professor elifaybar is with Porsuk vocational School. Anadolu University Eskisehir 2011.
- Torre V, Poggio TA. On edge detection. IEEE Trans Patt Anal Mac Intel PAMI 1986; 163-187.
- Seif A. A hardware architecture of Prewitt edge detection. Sustainable Utilization and Development in Engineering and Technology (STUDENT) IEEE Conference Malaysia 2010; 99-101.
- Senthilkumaran N, Rajesh R. Edge detection techniques for image segmentation-a survey. Proc Int Conf Manag Next Gene Software Appl 2008; 749-760.
- Ehsan N, Hamid H, Sara S. Edge detection techniques: evaluations and comparisons. Appl Math Sci 2008; 2: 1507-1520.
- Sharma J, Rai JK, Tewari RP. A combined watershed segmentation approach using k- means clustering for mammograms. Signal Processing and Integrated Networks (SPIN) 2nd International Conference IEEE 2015; 109-113.