- Biomedical Research (2015) Volume 26, Issue 3
Wavelet analysis of EEG for seizure detection: Coherence and phase synchrony estimation.
D.K. Ravish1, S. Shenbaga Devi1, S.G.Krishnamoorthy2*
1Department of Electronics and Communication Engineering, College of Engineering Guindy, Anna University, Chennai, TN, India
2Department of Neurology, Meenakshi Medical College Hospital and Research Institute, Kanchipuram, TN, India
- *Corresponding Author:
- D. K. Ravish
Department of Medical electronics
Dr.Ambedkar Institute of Technology
Near Janabharathi Campus Mallathahally
Bangalore-560056 India
Accepted date: May 20 2015
Abstract
This paper deals with the wavelet analysis method for seizure detection in EEG time series and coherence estimation. The main part of the paper presents the basic principles of signal decomposition in connection with the EEG frequency bands. Wavelet analysis method has been used for detection of seizure onset. The wavelet filtered signal is used for the computation of spectral power ratio. The results show that our method can identify pre seizure, seizure, post seizure and non seizure phases. When dealing with seizure detection and prediction problems it is important to identify seizure precursor dynamics and necessary to identify information about onset and spread of seizures. Therefore in the second part the coherence and phase synchrony during pre seizure, seizure, post seizure and non seizure are computed. We expect this method to provide more insight into dynamic aspects of the seizure generating process.
Keywords
EEG spectrum, Wavelet decomposition, power spectral ratio, epileptic seizure, coherence, phase synchrony.
Introduction
Epilepsy is a medical condition that produces seizures affecting a variety of mental and physical functions. Epilepsy is also known as seizure disorder. When a person has more than two episodes of unprovoked seizures in lifetime, they are known to be seizure patients or person with epilepsy. Seizure occurs when a group of nerve cells in the brain may change a person’s consciousness, movements and actions.
Epilepsy affects 65 million worldwide. The prevalence of epileptic disorders has been estimated to be between 0.5 (core group) and 5% (fringe group with at least a single seizure during lifetime) [1].
The diagnosis of epilepsy can be performed by different examinations; of these, EEG is the most economical one with high temporal resolution. EEG is a collection of such field potential signals from every electrode and represents the spatial distribution of the field potentials in the brain. EEG is an invaluable tool for characterisation of the spatial- temporal dynamics of neuronal activity in the brain. Hence EEG has emerged as a non invasive and practical tool for diagnosis of seizure detection and seizure prediction research area. [2], [3].
Previous researchers' workResearchers have worked in the area of analysis of EEG for seizure detection and prediction. Some of them are given below. Wavelet transform method for decomposition of signal and statistical features inter quartile range (IQR), mean absolute deviation (MAD) are used to detect seizures [4]. Linear discriminate analysis (LDA) classifier is used. The method results in good classification between seizure and non seizure. Furthermore this work is in progress to identification of seizure onset [5].According to the researchers the frequency spectrum of EEG during ictal reveals some tangible differences in the lower frequency range. Wavelet is a very useful tool especially since EEG signals are non-stationary and hence wavelet energy ratio is used to detect ictal period from the recording [6]. The connectivity of the brain can be analysed by determining the temporal relationships between activity patterns in different regions. The epileptic activity across brain regions in the of frequency band 0.5 to 4.0 Hz, temporal coherence are dominant [6]. The post ictal studies showed power spectral density (PSD) slightly flattening at higher frequencies [7].The main feature of coherence in our present report is hence computed for 0.5-4 Hz (delta), 7.5-12.5 Hz (alpha) and above 12.5 Hz (beta) .The experimental report estimated coherence in seizure prediction. Multivariate time series analysis study is extensively used in neurophysiology with the aim of studying relationship between simultaneous recorded signals. In this work they showed how to apply these methods to study different kinds of Neuro physiological data [8], [9].
Coherence and phase synchrony have found intensive usage in the study of seizure signals. The study report on an autoregressive method show high coherence and synchronization in EEG recording during seizures [10].
The method to detect direct estimation of the instantaneous phase of a signal, called as Phase Locking Value (PLV) with in a window called phase synchrony coefficients are studied for the three signal sets [11]. Coherence and phase synchrony in differentiating attention deficit hyperactivity disorder (ADHD) and non ADHD [12] and they also reported that initial results in this direction are encouraging but require large set of database for successful classification.
Researchers made comparison between the data from conscious and unconsciousness conditions. Synchrony measurement showed more widespread phase synchrony in unconscious than conscious stage [13].
Combined method proposed discrete cosine transform – discrete wavelet transform to extract features for interictal and ictal to determine temporal correlations [14].They also demonstrated difficulty in distinguishing between pre ictal and ictal based on spectral amplitude based method.
Optimal wavelet selection based detection and feature extracted to predict seizures to develop a closed loop brain pacemakers [15].
Moving average filter based seizure detection and lyapunov feature extraction method and the wavelet based method review discussed by the researchers in the review article. The difficulty in identifying the onset zone and the methods highlighted [16].
Materials and Methods
We worked with database collected at the Children's Hospital Boston (CHB). CHB database consists of EEG recording from subjects with intractable seizures [17].
We also worked with the EEG recordings done in Department of Neurology at the Meenakshi Medical College Hospital and Research Institute, Kanchipuram, India. The International 10-20 system of EEG electrode positions and nomenclature with bipolar montage is used for 16 channels. EEG data collected from age ranged from 7-50. Most of EEG selected for the study is from generalized epileptic seizure and the subjects whose EEG analysed have withdrawn antiepileptic drugs during hospital stay to induce seizure. During this signal processing task, the acquired EEG signal passed through a band pass filter 0.1 Hz to 100 Hz and a notch filter used to eliminate power line noise frequency 50 Hz.
Montage used
In this present research work bipolar longitudinal montage as shown in Figure 1 is used.. Four channels namely right frontal Fp2-F8 (RF), right temporal T4-T6 (RT), left frontal Fp1-F7 (LF) and left temporal T3-T5 (LT) scalp locations are chosen for analysis. One common configuration is to attach the Reference electrode to one earlobe, and the ground electrode to the mastoid on the same side of the head. The four channels are adequate and useful to localize the seizure and to infer whether it is general or partial. The use of four channels is to compute coherence among them [10]. Bipolar montage has two poles of extreme scalp locations. The difference between the bio potential among two electrodes are amplified.

Figure 1: Bipolar longitudinal montage showing electrode placement.
Pre processing
Signal amplitude is quantified to micro volts. The EEG signal for each channel is filtered using a digital low pass finite impulse response filter with Hamming window to remove power line noise along with out-of band noise. The order of the filter is 40 and cut off frequency is 32 Hz covering delta, theta, and alpha and beta bands of EEG.
A single channel pre processed exemplary non seizure EEG signal of entire one hour data and seizure EEG signal data are shown in Figure 2 and Figure 3.

Figure 2: Single channel non seizure EEG time series

Figure 3: Single channel seizure EEG time series
Wavelet decomposition
The wavelet transform is a mathematical tool that splits up the data into different frequency components with required matched resolution [5].Wavelet transforms are an effective time-frequency analysis tool for analysing EEG signal. The EEG signals are transient non stationary in nature. Daubechies wavelets of different orders (2, 3, 4, 5, and 6) are investigated for the analysis of epileptic EEGs. This family of wavelets have orthogonal property and efficient as filter implementation [18].The fourth order Daubechies wavelet is found to be most appropriate for analysis of EEG data [19]. Daubechies wavelet transforms (WT) is at level 3 decomposition wavelet of order 4 are used to analyse individual transient events at the approximated signal in the delta frequency band of the EEG signal such as 4 Hz.
The signal is synthesised by discarding the redundant information in WT and can be reconstructed using wavelet coefficients without loss of information. The reconstruction of the signal is defined as
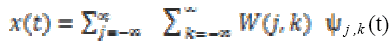 (1)
(1)
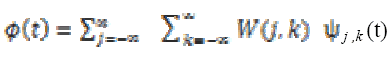
Discrete WT of a signal is calculated by passing signal through series of filters. The filter comprises of high pass and low passes components. It can be noted two terms in the equation (1). The filters are scaled by a factors . Infinite numbers of wavelets are required to synthesise the signal, in order to make definite number of wavelet Daubechies introduced finite number of wavelets and the concept known as multi resolution analysis MRA. The representation of the original reconstructed signal by scaling down factor is can given by
Discrete WT of a signal is calculated by passing signal through series of filters. The filter comprises of high pass and low passes components. It can be noted two terms in the equation (1). The filters are scaled by a factors . Infinite numbers of wavelets are required to synthesise the signal, in order to make definite number of wavelet Daubechies introduced finite number of wavelets and the concept known as multi resolution analysis MRA. The representation of the original reconstructed signal by scaling down factor is can given by
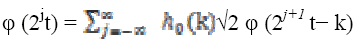
The scaling and wavelet functions for discrete wavelet transform functions are defined as
 (3)
(3)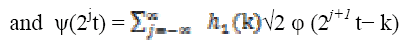 (4)
(4)where  , scaling function coefficients and
  ,scaling filter function or wavelet filter .The final
relation for the multi resolution decomposition for DWT
of the original function x(t) is represented as
,scaling filter function or wavelet filter .The final
relation for the multi resolution decomposition for DWT
of the original function x(t) is represented as
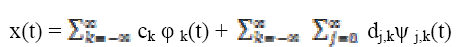 (5)
(5)where ck , dj,k are scaling and wavelet coefficients.
The fourth order Daubechies level 3 wavelet filtered single channel non seizure signal and seizure signal are shown in Figures 4 and 5.The above discussed wavelet decomposition are used for the computations.

Figure 4: Wavelet decomposition of the FP2-F8 (single channel) EEG channel (non seizure)

Figure 5: Wavelet decomposition of the FP2-F8 (single channel) EEG channel (seizure)
Seizure detection
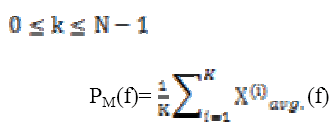
A power spectral value for every two second that is 512 samples with one second overlapping with hamming window is used to compute and power spectral values. The power values are then averaged and obtained on a time scale.The wavelet filtered signal A3, approximated signal at level 3 comprises of delta frequency band of the EEG signal is decomposed. For the A3 and D2 decomposed signals,
In case of continuous wavelet analysed f1-f2, f3-f4 band EEG time series signal, the spectral density is the square of the magnitude of continuous Fourier transform of the signal.
The Fourier transform of the signal is as
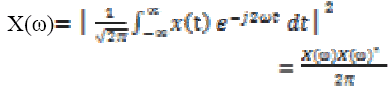 (6)
(6)Where ω is angular frequency and  is the continuous
Fourier transform of
is the continuous
Fourier transform of  and
and  is its complex
conjugate.
is its complex
conjugate.
Computing discrete Fourier transform DFT is defined as
 (7)
(7) (8)
(8) (9)
(9)Where, M=0, 1, 2 …K segments
Calculating spectral power for spectral band for A3 and D2 is computed using relations are given by
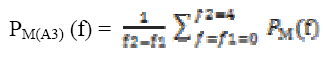 (10)
(10)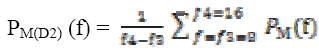 (11)
(11)The power levels in these bands are computed as
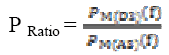 (12)
(12)P Ratio, relation (12) is used to mark seizure occurrence, where D3 corresponds to alpha and A3 corresponds to the delta band. However frequency bands are selected based on previous research indicating dominant slow wave activity during seizures [20], [21]. The equation (12) is normalised by dividing the power ratio by its maximum value. To evaluate seizure duration amplitude threshold and duration threshold have been used. From this power ratio, the seizure is detected using the following procedure from our previous research wok [22]: From the power ratio series for a subject, the peak value is identified; the seizure duration is identified using both magnitude threshold and the time threshold. Figure 6 shows power ratio plot for selected four channels EEG for a non seizure signal. The algorithm computes the duration of the seizure automatically and the result is shown as red coloured window in Figure 7 on power ratio plot.

Figure 6: Power ratio for four channels of normal EEG signal

Figure 7: Power ratio for four channels seizure EEG signal
Coherence estimation
Application of coherence to EEG plays a significant role. The connectivity in the brain can be analysed by temporal relationships between different regions of brain. The topographic (spatial) statistics of scalp EEGs presented as coherence in individual EEG frequency bands. These coherences result both from correlations among sources and volume conduction through the tissues of brain. The spectral coherence is the method for determining the feature synchrony in seizure activity [23].
Coherence  between two EEG signals x and y is defined
as the cross spectrum
between two EEG signals x and y is defined
as the cross spectrum  normalised by the power spectra and
  To make the coherence a dimensionless
number between 0 and 1, Sxy is squared and the relation is
given by
To make the coherence a dimensionless
number between 0 and 1, Sxy is squared and the relation is
given by
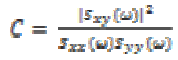 (13)
(13)where  represents cross-spectrum
  and
and  denote auto-correlation spectra.
The purpose of the present study is to evaluate the frequency distribution and coherence values at a scalp locations during the times in which individuals are normal and seizure phases (pre seizure, seizure and post seizure). A coherence value varies between 0 to 1. High coherence occurs during epileptic seizures particularly in 3 Hz wave discharges associated with absence seizure [6], [24].
Seizures are characterized by sudden, brief transient spike and slow wave complex lasting more than 5 seconds usually is associated with clinical seizure, these discharges have duration 0.5-3 seconds [25]. Therefore many research articles deal with short epoch 3seconds and longer EEG seizure epochs of 10 seconds in analyzing EEG for seizures [25], [26]. We used epochs of non seizure containing EEG recording of 6 seconds and seizure phases (pre seizures, during seizures and post seizures) of same epoch length .We also examined coherence measures of the non seizure EEG for the purpose of discriminating with seizure EEG.
For the normal subjects, there will not be any seizure epoch and hence any epoch of 6 seconds is considered for further analysis. For analysis, pre seizure, seizure and post seizure are considered. In the identified seizure duration, the mid 6 second is considered as the epoch of seizure and the 6 second EEG epoch just before the onset of seizure is pre seizure and the same after the elapse is considered as post seizure epoch.
The spatial statistics of EEGs are usually presented as coherence in individual frequency bands. These coherences are calculated among right frontal, left frontal, right temporal and left temporal EEG sources as shown in Figure 1. The EEG bands namely alpha (7.5-12.5 Hz), delta (0.5 -3.5 Hz) and beta above (12.5 Hz) are considered for the computation. The coherence in the bands delta (δ), alpha (α) and beta (β) are calculated for both normal and seizure subjects for the above said epochs and the results are shown in Table 1 and Table 2.

Table 1: Coherence values for non seizure phase

Table 2: Coherence values for seizure phase
Phase synchrony
Phase synchrony is the frequency quantity computed for two or more signals. Coherence is a measure of linear covariance between two signal power spectral density estimation. Coherence can be applied to stationary signals in general. Here we examine the results by applying Phase Locking Value (Statistics to EEG recordings of non seizure EEG epochs and cases of seizure EEG epochs) to perform the discrimination task between non seizure and seizure abnormality cases. The cases along with discrimination confirmation with the exact origin of epileptogenic site can be computed. Four electrode plots are used for the computations as shown in Figure 1
The EEG data corresponding to the above described data discussed in coherence computation is further processed to calculate phase synchrony parameters. The equation estimates phase synchrony (parameter) and phase locking value (PLV).
To quantify the PLV between two scalp location signals requires the computation of the phase difference followed by the computation of phase locking index. The Hilbert transform is applied to both signals S0 and S1 to compute these real and imaginary components,
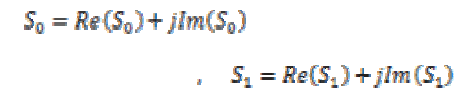 (14)
(14)where  and
and  are two signals. The Hilbert transform is
performed over the EEG spectrum, an important advantage
of the analytic approach is that the phase can be easily
obtained for EEG signal band.
are two signals. The Hilbert transform is
performed over the EEG spectrum, an important advantage
of the analytic approach is that the phase can be easily
obtained for EEG signal band.
The magnitude in the extracted frequency band can be computed as
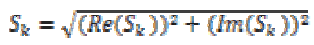 (15)
(15)where k=0, 1. The instantaneous phases are computed for each channel
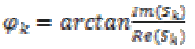 (16)
(16)The EEG data corresponding to seizure phases as discussed in coherence estimation previously was processed by the phase synchrony computation [12], which estimate phase synchrony coefficients (parameter) rlm, n for the pair of electrodes over an Nw sample long time window as follows
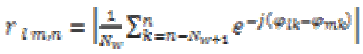 (17)
(17)where  and
and  denoted as instantaneous phase sequences
for scalp locations l and m respectively, and n
represents the analysis window.
denoted as instantaneous phase sequences
for scalp locations l and m respectively, and n
represents the analysis window.
The phase of this convolution φ (t, n) is extracted and for each pair of electrodes that is right, left, front and temporal locations. The phase locking value (PLV) is then defined at time t as the average value:
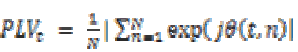 (18)
(18)Where  is the phase difference φ1 (t, n) – φ2 (t, n)
is a constant .Other many tools exists to quantify the level
of phase synchronization between two signals such as
entropy index, mutual information and attractors [27] .
is the phase difference φ1 (t, n) – φ2 (t, n)
is a constant .Other many tools exists to quantify the level
of phase synchronization between two signals such as
entropy index, mutual information and attractors [27] .
PLV measures the variability of this phase differences at t: That is PLV value is high during when phase is synchronous and less during non synchronous condition. The phase synchrony for normal and seizure epochs, the results are shown in Table 3 and Table 4.

Table 3: Phase synchrony values for non seizure phases

Table 4: Phase synchrony values for seizure phases
Results and Discussions
We introduced a method for the seizure detection in EEG time series segments and there by identifying seizure on set zone. Seizure phases and non seizure EEG data was evaluated to demonstrate the transitions between states. The computation of this are tabulated in Table 1 and Table 2.The results obtained when applied to EEG data, the present algorithm identifies all non seizure correctly and of 30 seizure segments, the algorithm is able to identify only 24 segments as seizure segments. Fixed amplitude threshold and (duration) time threshold yielded with an overall accuracy 83%. In this predefined threshold approach sensitivity resulted relatively low but may be improved further with modifying thresholds.
We further proceeded to the second part coherence estimation during seizure phases. Results showed significant differences within delta band (δ) for following four pairing right frontal (RF), right temporal (RT), left frontal (LF) and left temporal (LT).For each of these pairings; referring to the Table 6 the seizure state showed greater coherence than the non seizure state. It can also be seen from the Table 1 and Table 2 that coherence values are higher in seizure epochs than pre seizure and post seizure conditions. And in most cases the variation to high coherence in pairings of EEG signal which can be seen from the higher standard deviation in seizure epochs and the lower standard deviation in post seizure epochs. Coherence measures alone may not be a significant feature in detection and prediction of seizure but this can strengthen in understanding more insight into seizure generating phenomenon when used with multivariate features.

Table 5: Coherence values in non seizure calculated for 24 recordings

Table 6: Coherence values in pre seizure, seizure and post seizure calculated for 24 recordings
Coherence is a measure of linear covariance between two scalp locations power spectral density estimation hence phase synchrony parameters are significant for the non stationary signals.
In Figure 9 is shown the values of phase synchrony from non seizure and seizure epochs. The distribution of phase synchrony parameter is shown for 24 recordings each Right, Left, Frontal and Temporal scalp locations for the non seizure and seizure epochs. Figure 8 suggests that phase synchrony is higher on average for seizure cases than the non seizure cases. However, this difference is significantly smaller but noticeable higher values for seizure cases.

Figure 8: Phase synchrony for the non seizure and seizure epochs computed for 24 recordings each Right, Left, Frontal and temporals scalp locations.

Figure 9: Phase Locking Value for the non seizure and seizure epochs computed for 24 recordings each Right, Left, Frontal and temporals scalp locations.
We also see that Table 7 and Table 8 showing the higher average values of phase synchrony parameter and PLV for seizure than non seizure cases. Figure 9 shows the PLV for the non seizure and seizure cases.

Table 7: Phase synchrony values for non seizure phases calculated for four channels of 24 recordings

Table 8: Phase synchrony values in pre seizure, seizure and post seizure calculated for four channels of 24 recordings
Classifier
Training algorithm Levenberg-Marquardt Pattern Recognition tool in Neural Network is used for the classification problem and to know how well the computed features in the above discussions classify the non seizure, seizure conditions and also to validate test results and its performance measures.
In the field of machine learning and neural network classification, a confusion matrix is well often used concept to validate the results. The contingency table or error matrix allows understanding performance of the method. Here 24 normal subjects, out of which one is detected as seizure condition. One seizure condition is misclassified as normal.
The confusion matrix for this classifier is shown in Figure 10, the diagonal cells show the number of cases that were correctly classified, and the off-diagonal cells show the misclassification cases. The bottom right blue cell shows the total percentage of correct classification (in green) as 97.9% and total percentage of misclassification case (in red) as 2.1%.

Figure 10: Classifier Confusion matrix for accuracy measures.
Conclusion
In this work, a scheme is proposed to detect seizure in the EEG seizure time series signal. Detection was accomplished by level 3 decomposition of EEG signal using wavelets. Coherence and phase synchrony features extracted and analysed for seizure and non seizure signals. The experiments results indicate that features can distinguish non seizure and seizure signal. The classification accuracy measure is found to be 97.9 %.The findings encourage further investigation in future scope especially needed for seizure prediction. In the future research work, more experiments are needed to verify the results to develop more effective non linear analysis methods for anticipating seizure.
Acknowledgement
The authors would like to thank Faculty members, Department of Neurology and the Dean from Meenakshi Medical College Hospital and Research Institute (MMCRI), Kanchipuram, India.
References
- Epilepsy foundation accesses on 2014 Available from: http:/www.epilepsyfoundation.org.
- Erst N, Silva D, Lopes F Electroencephalography, 5th ed., Lippncot Williams & Wilkins 2005; 506–510.
- Adeli H, Dastidar SG, Dadmehr N, Automated EEG – based diagnosis of neurological disorders inventing the future of neurology, CRC press:2010;71-75.
- Rafiuddin N, Khan YU and Farooq O, Feature extraction and classification of EEG for automatic seizure detection, International Conference on Multimedia, Signal Processing and Communication Technologies 2001; 184-188.
- Zandi AS, Tafreshi R, Dumont GA, Reis CR, MacLeod BA, Puil E, Electroconvulsive Therapy: A model for seizure detection by a wavelet packet algorithm, IEEE EMBS 2007;916-1919.
- Drongelene WV, Signal processing for neuroscientists –an introduction to the analysis of physiological signals, Academic press 2007; 125-147.
- Pocket S, Holmes MD, Intracranial EEG power spectra and phase synchrony during conscious and unconsciousness, ELSEVIER 2009; 1-7.
- Drentrup HF, Staniek M, Bonhage A, Dicken JT, Elger CE, Schelter B and Lehnertz K, Identification of preseizure states in epilepsy: a data-driven approach for multichannel EEG recordings”, Frontiers in computational neurosciences 2011; 32(5):1-9.
- Pereda E, Quiroga RQ, Bhattacharya J, Non linear multivariate analysis of neurophysiological signals, ELSIVIER, progress in neurobiology 2005; 77(1):1-37.
- Doesburg SM and Ward LM, Synchronization between sources: Emerging methods for understanding largescale functional networks in human brain, Springer Series of computational neuroscience 2009; 25-42.
- Van Quyen ML,Foucher J, Lauchaux JP,Rodrigues E, Lutz A, Martinerrie J, Varela FJ, Comparison of Hilbert and wavelet methods for the analysis of neuronal synchrony, Journal of neuroscience methods, Elsevier 2001;.83-98.
- Tcheslavski GV, Beex A , Phase synchrony and coherence analyses of EEG as tools to discriminate between children with and without attention deficit disorder, Biomedical Signal Processing and Control, Elsevier 2006;151-161.
- Pocket S, Holmes MD, Intracranial EEG power spectra and phase synchrony during Consciousness and unconsciousness, Consciousness and cognition, Elsevier 2009;1-7.
- Parvez MZ, Paul M, Antolovich M, Detection of pre stage epileptic seizure by exploiting temporal correlation of EMD decomposed EEG signals, Journal of medical bioengineering 2015;4(2):110-116.
- Kavya D, Joytstna K, Vinitha B, EEG based epilepsy detection and prediction, International Journal of Engineering and Technology, 6(3), 2014; 212-217.
- Alotaby TN, Alshebeli SA, Alshaw T, Ahmad I, Fathi E, Samie E,EEg seizure detection and prediction algorithm a survey, Eurasip Journal on Advances in Signal Processing 2014;183-201.
- Physionet Available on 2012; web site http://physionet.org/physiobank/database/chbmit.
- Smit DJ, Boersma M , Schnack HG, Micheloyannis S, Boomsma DI,.Hulshoff HE, Cornelis P .Stam and co Guess EJ, The brain matures with stronger functional connectivity and decreased randomness of its network, plus one 2012;7(5):1-11.
- Metin A, Time frequency and wavelet in biomedical signal processing,IEEE press 2000; 174-176,207-210.
- Adeli H, Zhou Z, and Dadmehr N, A wavelet chaos methodology for analysis of EEGs and subbands to detect seizure and epilepsy, IEEE Transactions on Biomedical Engineering 2007; 54(1):.205-211.
- Ravish DK., Devi SS, Automated Seizure Detection and Spectral Analysis of EEG Seizure Time Series, European Journal of Scientific Research 2012; 68(1) 72-82.
- Ravish DK, Devi SS, Krishnamoorthy SG, and Karthikeyan MR, Detection of Epileptic Seizure in EEG Recordings by Spectral method and Statistical analysis, Journal of Applied Sciences 2013; 13 (2), 207-219.
- Grant Benham,Howard W.Rasey,Joel F Lubar, Jon A.Frederick, and Charles Zoffuto .A., “EEG powerspectral and coherence differences between attention states during a complex auditory task,”Journal of neurophysiology 2000;1-11.
- Sanei S, and Chambers J, EEG signal processing, John Wiley & Sons, Ltd 2007; 68-70.
- Misra UK, Kalita J, Clinical Electroencephalography, Elsevier 2005; 95-145.
- Dlugos D, Shinnar S, Cnaan A, Hu F, Moshe S, Mizrahi E, Masur D, Sogawa Y, Le Pichon JB, Levine C, Hirtz D, Clark P, Adamson PC, Glauser T, Pretreatment EEG in Childhood Absence Epilepsy: Associations With Attention and Treatment Outcome for the Childhood Absence Epilepsy Study, Neurology 2013;81(1):150–156.
- Abdelhalim K, Smolyakov V, Genov R, Phase- Synchronization Early Epileptic Seizure Detector VLSI Architecture, Biomedical Circuits and Systems, IEEE Transactions 2011;5(5): 430-438.