Research Article - Biomedical Research (2018) Volume 29, Issue 10
The mechanical properties of nanohybrid and bulk fill posterior composites
Hakan Kamalak1*, Aksu Canbay Canan2 and Serdar Altin31Department of Restorative Dentistry, Faculty of Dentistry, Firat University, Elazig, Turkey
2Department of Physics, Faculty of Science, Firat University, Elazig, Turkey
3Department of Physics, Faculty of Arts and Science, Inonu University, Malatya, Turkey
- *Corresponding Author:
- Hakan Kamalak
Department of Restorative Dentistry
Faculty of Dentistry
Firat University, Elazig, Turkey
Accepted on April 09, 2018
DOI: 10.4066/biomedicalresearch.29-18-482
Visit for more related articles at Biomedical ResearchAbstract
Objectives: The objective of this work was to investigate the structural properties, thermal conductivity, Differential Thermal Analysis (DTA), Thermo-Gravimetric analysis (TG), surface homogeneity, microhardness, X-ray analysis of nanohybrid and bulk fill composites.
Methods: 108 rectangular specimens were prepared from the following composites: (Estelite Sigma Quick (ESQ), Charisma Smart (CS), 3M Espe Filtek Z 250 (EFZ) and Filtek Restorative (FR)) and subjected to various artificial aging protocols (storage in distilled water for 24 h; thermal cycling, 2 × 3000 cycles 5/55°C). The materials were light-cured for 20 s in a 2 mm × 2 mm × 6 mm teflon mould. The nanoparticles of groups were identified by FT-IR spectroscopy. Surface roughness measurements were carried out by optical microscope, the Vickers hardness number was measured with the stainless steel sheet using a micro-indentation tester (Emco Test Durascan), the heat conductivity of the samples was analyzed by the home made thermal conductivity measurement system, thermogravimetric analysis (DTG, 60-AH, Schimadzu) was used to determine the filler mass fraction. Thermogravimetric analysis was performed in argon atmosphere from 30 to 850°C.
Results: It was found that the composites have multiphase component such as metallic dopant and organic binder.
Conclusions: The XRD investigation showed that there was a broad halo in the pattern which indicates the organic section in the composites. We found that the temperature dependence of the thermal conductivity of the composites depended on the type of the composites, which are low enough for dental applications. The micro-hardness of the samples was analyzed and the result was compared with literature and it was found that the observed results were in agreement with literature.
Keywords
FTIR, SEM-EDX, Micro-hardness, Porosity, Composites, Thermogravimetric analysis, Homogeneity.
Introduction
In addition to the function and the phonetics used in dental practice, the recovery of natural dental aesthetics becomes more important. Anomalies caused by congenital and acquired causes such as excessive bruises on the teeth, diastema and perturbations, hypoplasia, fluorosis create aesthetic problems in patients who have abrasion and broken teeth [1-3]. Nanohybrid and bulk fill composite resins are frequently used in treatments for these aesthetic problems [4,5].
Dental composites vary in composition, initiator/activator system, filler type, loading, and particle size. It has been proved that these variations dramatically influence the composite properties. Accordingly, they put a burden on dental practitioners when selecting a material that fulfils the practical and clinical needs [6-8]. Advantages and disadvantages of dental composites should be well known by clinicians since these properties will directly affect the selection of restorative materials in clinical applications. Long-term performance of dental composites is determined by their physical, chemical and mechanical properties.
Bond structure of the composites is one of the important factors that affect clinical performance of resin composites [9]. Among several methods to determine the bond structure of composites, Fourier Transformation Infrared spectroscopy (FTIR) has been proven to be a powerful technique and has been widely used as a reliable method [10,11] as it detects the C=C stretching vibrations directly before and after curing of materials. FTIR based on the interaction between electromagnetic radiation and vibrations of the chemical bonds among atoms [12]. FTIR is a way of getting spectra by using an interferometer, and then performing a Fourier Transform (FT) on the interferogram to obtain the spectrum. An FT-IR spectrometer collects and digitizes the interferogram (https:// www.newport.com/resourceListing/technical-notes).
During the restorative treatment, the negative effect of heat increase on pulp tissue has been a matter of concern among the scientist [13]. This heat build-up is a biological problem on the tooth and for this reason it is important to evaluate the thermal conductivity and thermal analysis of the composite resins.
The thermal feature of composite materials is important for clinical applications. Any change in temperature can be transmitted to the pulp and can cause damage to pulpal tissue. Excessive thermal conductivity can cause thermal loading of teeth with following irritation of the pulp tissue, resulting in hypersensitivity, pulpitis or even necrosis of healthy tooth [14]. Thermal analysis techniques, such as Differential Calorimetry (DSC), Differential Thermal Analysis (DTA) and thermogravimetric analysis (TG) are also used to analyze of dental materials [15,16]. Thermal analysis is a property of the material which has been quantified in several in vitro investigations. In the most recent, commercial instrumentation with a standardised technique has been used, this being Differential Thermal Analysis (DTA) [17,18].
DTA is an appropriate method of measuring temperature rises produced during the setting of a range of tooth. Generally, TG/DTA measurements were made to observe the phase transitions, deformations and weight loss of the sample during heating.
Another important property of dental composites is micro hardness. Surface roughness of dental composites has an important effect on the initial adhesion and retention of dental plaques [19-21]. A subsequent risk of dental caries and periodontal diseases would be expected with rough surfaces [17-21]. Hardness provides some evaluation of resistance of composites to compressive forces [22]. Surface roughness also affects the color, gloss and staining susceptibility of dental composites [23-26].
X-Ray Diffraction (XRD) is a powerful non-destructive technique for characterizing crystalline materials. XRD provides information on crystal structure, phase, preferred crystal orientation (texture), and other structural parameters, such as average grain size, crystallinity, strain, and crystal defects. X-ray diffraction peaks are produced by constructive interference of a monochromatic beam of X-rays diffracted.
These analyses are important for restoring minimal invasive cavities and clinical success; so, it is important the examination of these properties of commercially available dental materials.
According to the results of many studies, there is a need for dental clinicians to gather sufficient knowledge about physical, chemical, mechanical and thermal analyses of dental composites. These properties of dental composites are very important because of the potentially affect the pulp and surrounding tissues of teeth so as to minimize the occurrence of damage. Therefore, this research aimed to look at the structural stability, thermal conductivity, thermal analysis, materials’ homogeneity, X-ray analysis, FTIR analysis, EDX analysis, surface porosity and micro hardness. Meanwhile, composites’ inorganic fraction was also characterized. The inorganic fraction was analyzed using Scanning-Electron Microscopy (SEM). So, these analyses results suggest some clinical guidelines to minimize the damage to the pulp or the surrounding tissues.
Materials and Methods
Specimen preparation
Specimens of the 6 resin composites were prepared in reusable custom-made Teflon molds (split Teflon molds with an inner diameter of 6 mm and a height of 2 mm). Each composite was placed into the standard molds in 1-mm increments by use of prefilled syringes provided by the manufacturers. The composite resin increment was covered with a clear polyester matrix strip and a 1-mm-thick glass slide, which was gently pressed under a load of 200 gf during 1 min. Each increment was light-polymerized for 20 s following manufacturers’ specifications with a visible light polymerization unit (Woodpecker; Dental Wireless LED Curing Light Lamp, USA) with an output of 1400 mW/cm2 and a wavelength between 420 and 480 nanometers [27]. The cylindrical blocks were thereafter removed from the Teflon molds, thus providing a cylinder with the same dimensions of the bisected cavity (6 mm diameter; 2 mm height). Lots of materials were fabricated and stored in a light proof receptacle with distilled water at 37°C. The specimens were subjected to Thermocycling (TC) in distilled water for 2 × 3000 cycles between 5 and 55°C (n=10). The materials used in the present investigation are presented in Table 1.
Material name |
Manufacturer | Material type | Matrix type | Filler content | Filler ratio wt (%) | Abbreviation |
|---|---|---|---|---|---|---|
Estelıte® Sigma Quick |
Tokuyama Tokyo, Japan | Nanohybrid composite | TEGDMA Hydrophobic Aromatic dimethacrylate |
Barium glass, colloidal silica, spherical silica-zirconia filler | 82 | ESQ |
Charisma Smart |
Heraeus-Kulzer, Germany | Nanohybrid composite | Bis-EMA TEGDMA HEDMA Modified organic matrix |
Silicate oxide, silicate glass pigment, stabilizer | 60 | CS |
3M Espe Filtek Z250 set |
3M/ESPE USA | Nanohybrid composite | Dimethacrylate resin | Barium Glass particles, the pre-polymer itanium trifluoride, mixed oxides | 75 | EFZ |
Filtek™ Restorative |
3M/ESPE USA | Bulk fill posterior composite |
Bis-GMA, UDMA, TEGDMA, bis-EMA | Silica filler, Non agglomerated/non-aggregated 4 to 11 nm zirconia filler, and aggregated zirconia/silica | 72.5 | FR |
Table 1. Materials used in this study.
The principle of the structural properties
The structural properties of the materials were performed by XRD pattern using CuKα radiation between 2-80° and Rad-B Dmax diffractometer. The phases in the materials were analyzed by using Jade 4.0. The micro-structural characterization was performed with scanning electron microscope (SEM, Leo EVO-40 VPX) with combined EDX unit (Bruker X flash detector 4010). FTIR Spectra were performed by using Perkin Elmer FTIR analysis system using KBr.
The principle of the microhardness
Surface roughness measurements were carried out by Optical microscope. Optical microscope photographs of the samples were taken with LeicaDM4000M microscope with 500X magnification. The Vickers hardness number was measured on the surface in contact with the stainless steel sheet using a micro-indentation tester (Emco Test Durascan) with a 100 N load applied during 45 s at two moments: 20 min and 24 h after light curing. The specimens were individually fixed in a holder and positioned in such a way that the test surface was kept perpendicular to the indentation tip. Measurements were made at the top surface of the samples. 3 measurements were taken from the surface of each cylindrical sample to minimize errors in measurements. Averages of 3 measurements were calculated. As a result, totally 15 measurements were taken from each group. For all tested materials, micro hardness means were calculated. Measurements were made at the top surface of the sample and three different measurements were taken from the surface of each cylindrical sample for minimization of the errors in measurements.
The principle of the thermal conductivity
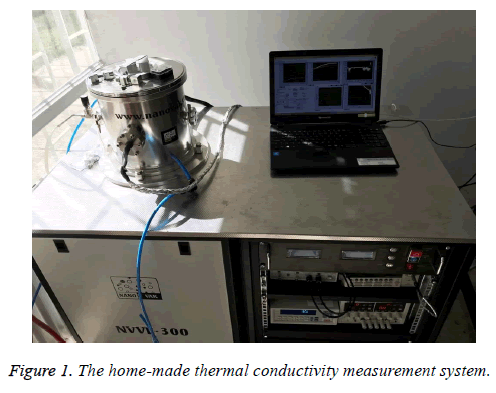
The heat conductivity of the samples was analyzed by the home made thermal conductivity measurement system (Figure 1). We used two brass blocks which the first base has a heater inside it and the second is the heat sink and both of them have k-type thermocouple inserted the surface of the blocks. We calibrated the system using Al (Alfa Aesar Cas No: 7429-90-5 which have thermal conductivity value 205 W/Km) [28]. It was used 120 W power to obtain temperature gradient in both side with PID temperature controller to reach 55°C temperature which is the highest temperature that can be applied without decomposition of the biomaterials.
The principle of the thermogravimetric analysis
Thermogravimetric analysis (TG/DTA, Schimadzu DTG 60 AH) was used to determine the phase transitions and mass gain or loss of the sample. The resin composites were subject to a temperature rise from 30 to 850°C at a heating/cooling rate of 10°C/min. During the thermal measurements, we can detect organic and inorganic component of the sample.
Results and Discussion
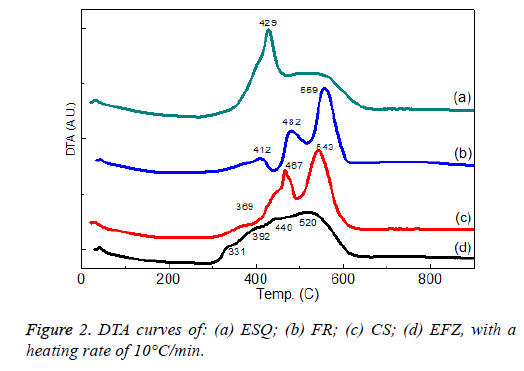
For the thermal analysis of the EFZ, CS, EFZ and ESQ composites we use differential thermal analysis to observe the thermal stability of the composites at high temperatures and also to determine the biocompability of the composites (Figure 2).
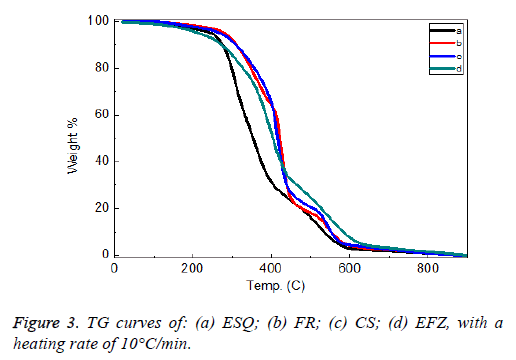
ESQ and EFZ composites show only one exothermic peak between 300-450°C and 300-600°C, respectively. The CS and EFZ composites show 2 exothermic peaks between 400-600°C. The weight loss of the composites is about 26% for the composites (Figure 3).
The sharp weight loss occurred between 200-650°C. The weight losses for all the composites are nearly equal and occurred at the same temperature range.
In a previous study, the authors showed that composites showed endothermic peaks between 253-363°C [29]. The endothermic peaks are related to the decomposition of the organic component and exothermic peaks are related to the carbonate group present in the composites. It was seen that the peak values were high in our work. This is caused by the fact that the filler content of the composites is excessive. Discacciati et al. found variable loss of mass in the range between 300 and 400°C [30].
A study by Atai et al., found that in thermal measurements the exothermic heat generated during isothermal cure is proportional to the number of double bonds reacted in the system [31].
In the work of Viljanen et al., different peak temperatures as measured for the photo polymerized specimens in the first heating ramp of the DSC scan have been observed [32]. The exothermic peaks indicate that the polymerization reaction is not complete after photo polymerization. Also, they found that the total polymerization exotherms of un-irradiated resins could not be determined because the resins did not polymerize although heated to 200°C in DSC. In this study, we found two exothermic peaks because of the structure and also chemical contents of the materials.
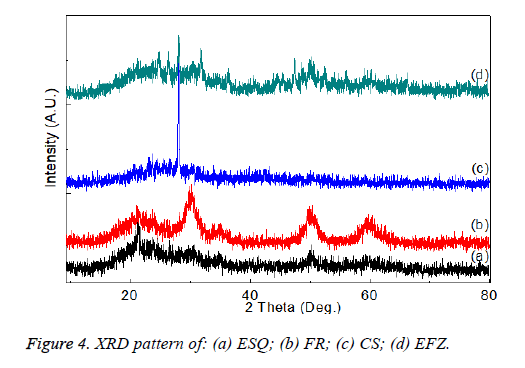
XRD pattern of the composite materials are given in the Figure 3 and it is easily seen that there are two different types of structures in the data. The first is the short range ordered phase which gives a broad halo in the XRD pattern and they are organic binder in the composites such as bisphenol-A-glycidyl methacrylate and the second is the crystalline phase which is the inorganic materials that give the peaks in the XRD pattern (Figure 4). It is seen that the broad peaks in the XRD pattern are related to formation of the nano-sized graind and the change of the peaks is related the change of the inorganic filler in the composites.
As described by Campos et al., XRD patterns were obtained using a PAN Analytical, model X'Pert PRO with X'Celerator detector, Rigaku D with Cu Kα radiation (λ=1.54186 A, 45 kV, 40 A) at room temperature [33].
In this study, XRD pattern using CuKα radiation between 2-80° and Rad-B Dmax diffractometer. It was observed that elemental analysis was carried out in different studies. The accuracy of the results obtained in these two techniques was found to support each other.
In a study by Tian et al., the XRD profile of the composites showed two diffraction peaks at the 2θ angles of 8.3° (dspacing= 1.065 nm) and 26.5° (d-spacing=0.336 nm), which were originated from fibrillar silicate single crystals [34].
In this study, It has been determined that the different peak values are related to the content of the organo-inorganic structure of the materials. The structures of the composites of ESQ, FR, CS and EFZ were found as Al2BaSi2O8 hexagonal, MoO3 orthorombic, ZrO2 cubic and SiO2 hexagonal, respectively.
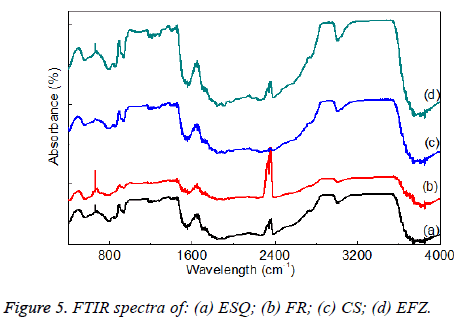
The bond structures of the composites were investigated by FTIR spectra (Figure 5). It is well known that the composites in dental research have BisGMA, UDMA and TEGDMA organic binder which consist of C, H, N and O ions in the structures.
A study by Pereira et al., said that the FTIR method for determining residual unsaturated groups in dental materials has recently been discussed in detail [35]. They found that the aromatic peak originates from the aromatic rings in the Bis- GMA molecule, the amount of which remains unchanged during the polymerization. The peaks used in the analysis are the methacrylate C=C absorbance at 1640-1635 cm-1 and the aromatic C=C absorbance at 1610-1605 cm-1. In this study, the bands between 3428 cm-1 and 3481 cm-1 are related to O-H vibration modes in the structure as seen in reference [36]. It was observed C-H stretching bands at 2915 cm-1 -2964 cm-1 and C-O-C modes were found at 1068 cm-1. The other bands at 1408 cm-1, 1621 cm-1 and 1728 cm-1 were corresponded to (CO3)2, NH-CO and C=O stretching modes of the ions in the composites [28].
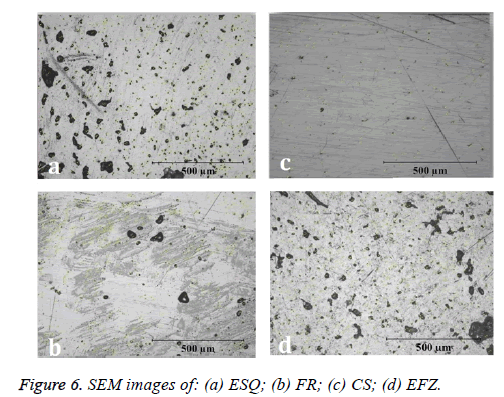
The SEM images of the composites named as ESQ, FR, CS and EFZ were given in Figures 6 (a)-6 (d). While the grain size of the composites was changed by the type of the composites as seen in the Figure 6, the nano-sized grain formation for the composites are expected since the better mechanical strength. Furthermore, it is well known that nano-sized samples have better properties when compared the others as stated in reference [37] which is expected properties of the dental composites [38]. The black regions in the Figure 6 are related to non-homogeneous grain formation which is unexpected results for dental treatments.
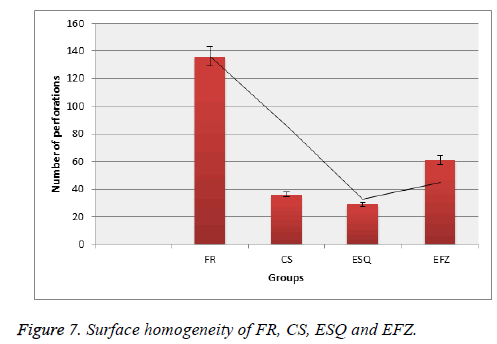
Prati et al. [39], evaluated the water absorption and solubility of different composite resins. They evaluated the surfaces of composite materials with SEM device. They found cavities and porous structures on the surfaces of the cylindrically prepared composite materials. They observed that these voids affected the physical and mechanical properties of composite materials. As a result of the researches, it is an undesirable situation to make the surface porous or to have a lot of gaps. In our study, the maximum porosity on the surface at 500X magnification was absorbed respectively FR, EFZ, CS and ESQ groups (Figure 7).
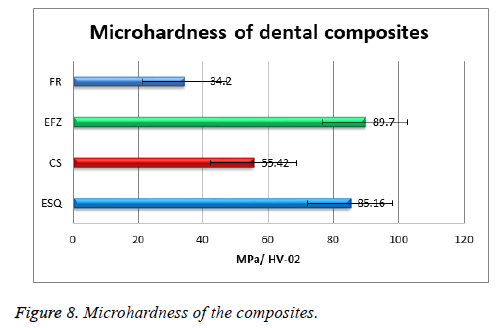
It is well known that the mechanical properties of the dental composite resins are one of the important subjects for clinic application [39]. The micro-hardness values of the composites were calculated by taking the average hardness of composites. The experimentally obtained micro-hardness values of the composites were given in Figure 8. The microhardness of the materials was found as EFZ, ESQ, CS and FR, respectively. While the lowest hardness value was observed in the composite named FR, the highest value of the micro-hardness were found as EFZ. These results suggest acceptable values when compared with the microhardness of human dentin teeth (30-55.5 MPa) [40]. According to our results, nanohybrid composite resins possess better Vickers microhardness than bulk fill posterior composite resins as shown in Figure 8. The matrix type and filler ratio of composites enhance their mechanical properties. In this study, the filler ratio of ESQ with the highest micro-hardness is the highest. In this study, we found that specimens showed significantly different microhardness values according to the different composition and filler particles of composite resins.
In the study made by Firoozmand et al., the microhardness value of ESQ and EFZ were found 38.35 ± 2.58 MPa and 60.72 ± 1.57 MPa, respectively [41]. Yeh et al., found the microhardness value of ESQ average 60.2 MPa [42]. Korkmaz et al. found microhardness value of EFZ as 89.01 ± 1.94 MPa [43]. Schneinder et al., found the microhardness value of EFZ as 55.58 MPa [44]. In this study, we found microhardness value of ESQ and EFZ as 85.16 MPa and 89.7 MPa, respectively. As a result of the studies, standardization about this parameter has not been achieved. The use of more than one technique may be more accurate with regard to microhardness measurements. The results we observed also made positive contribution to the literature.
It is well known that the particles in the composite with strong bounds can cause the increase of the mechanical strength. It is well known that the chemical bond between the resin matrix and filler has directly affected the mechanical strength of the composites [45]. In addition of this, larger particles in the structure have less mechanical properties when compared with others [3]. So the micro-hardness value of the composites may be related to grain size and bonding of the components in the structure.
The treatment of deep carious lesions is the removal of all infected and affected dentin to prevent pulp and to prolong the life of restorations. It is desirable that the thermal conductivity of the dentin tissue and the composite material be similar.
The effects of temperature changes on the adaptation of composite resins in dental applications especially in the restoration of deeply decaying teeth restoration have been extensively studied. But studies on updated restorative materials are lacking. A temperature rise of 5.5°C has been reported to damage the pulp [46,47].
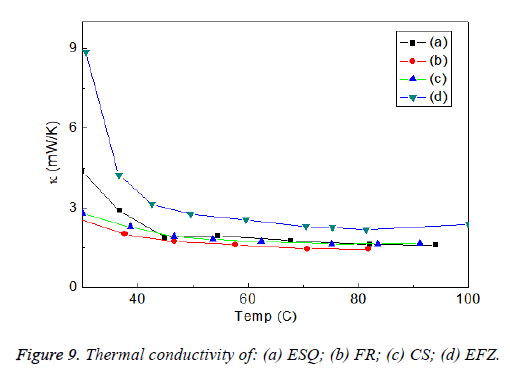
It is well known that the thermal conductivity can be calculated by the temperature gradient of the sample for a certain distance which the detail can be found in [27,28]. The temperature dependence of the thermal conductivity of the dental composites are given in the Figure 9 and it is found that EFZ at the room temperature have a values which below 9 mW/K and they were decreased with increasing temperature down to 2.8 mW/K. It can be said that the lowest thermal conductivity was obtained for the composites of ESQ, FR, and CS as in Figure 9. The expected behavior of the thermal conducting properties of the dental composites should be low enough for protecting the nerve inside of the tooth. The intraoral temperature of oral cavity is nearly about 70°C [48]. Thermal conductivity of the composites decreased about 60°C, and then all the composites became stable during 90°C (Figure 9).
The thermal conductivity of dentin was found about 0.57 W/m K [49]. Dentine has a low thermal conductivity and thermally protects the pulp tissue. In this study, the thermal conductivity was found to be as an average 3 mW/K at 60°C. This value ensures that the tooth remains vital. Four materials showed clinically acceptable values in terms of thermal conductivity. The results we observed in this study are in agreement with literature.
Conclusion
In this study, the structural, thermal and mechanical properties of the dental composites were investigated in detail. It should be noted that the composites consist of organic phase and crystalline phase as indicated in the XRD section. It can be said that variations in resin matrix and filler technology influenced the mechanical and physical behavior of different composite materials. FTIR spectra of the composites showed C-O-N-H bonds in the structure. While the lowest hardness value was observed in the composite named FR, the highest value of the micro-hardness were found as EFZ. The lowest thermal conductivity among the composites was found for the composite of FR.
Direct comparison of composite effectiveness in clinical studies is very difficult. Our study aimed to analyze in laboratory tests under standardized and simulated clinical conditions. The variability of the mechanical, chemical and physical properties measured within material groups.
The reason for the variation in the range of the structural properties, thermal conductivity, Differential Thermal Analysis (DTA), Thermogravimetric analysis (TG), surface homogeneity, micro hardness, X-ray analysis is not only due to the effect of experimental factors such as the measuring method, preparation of materials, but also because many factors such as type of hand pieces used, light curing unit, diameters of cylindrical blocks will affect these parameters.
Acknowledgements
This study was performed under the project provided by Inonu University research council under contract number 2015-48.
We would like to thank Erdinc OZ for performing the thermal conductivity measurements during to study.
References
- Dietschi D. Optimizing smile composition and esthetics with resin composites and other conservative esthetic procedures. Eur J Esthet Dent 2008; 3: 14-29.
- Braem M, Finger W, Van Doren VE, Lambrechts P, Vanherle G. Mechanical properties and filler fraction of dental composites. Dent Mater 1989; 5: 346-348.
- Willems G, Lambrechts P, Braem M, Celis JP, Vanherle G. A classification of dental composites according to their morphological and mechanical characteristics. Dent Mater 1992; 8: 310-319.
- Leprince JG, Palin WM, Vanacker J. Physico-mechanical characteristics of commercially available bulk-fill composites. J Dent 2014; 42: 993-1000.
- Czasch P, Ilie N. In vitro comparison of mechanical properties and degree of cure of bulk fill composites. Clin Oral Investig 2013; 17: 227-235.
- Abuelenain DA, Neel EAA, Al-Dharrab A. Surface and mechanical properties of different dental composites. Austin J Dent 2015; 2: 1019.
- Cramer NB, Stansbury JW, Bowman CN. Recent advances and developments in composite dental restorative materials. J Dent Res 2011; 90: 402-416.
- Kim KL, Namgung C, Cho BH. The effect of clinical performance on the survival estimates of direct restorations. Restor Dent Endod 2013; 38: 11-20.
- Kalachandra S, Kusy RP. Comparison of water sorption by methacrylate and dimethacrylate monomers and their corresponding polymers. Polymer 1991; 32: 2428-2434.
- Rueggeberg FA, Craig RG. Correlation of parameters used to estimate monomer conversion in a light-cured composite. J Dent Res 1988; 67: 932-937.
- Heatley F, Pratsitsilp Y, Mchugh N, Watts DC, Devlin H. Determination of extent of reaction in dimethacrylate-based dental composites using solid-state C-13 mas NMR-spectroscopy and comparison with FTIR spectroscopy. Polymer 1995; 36: 1859-1867.
- Costa LFL, Moraes JCS, Cruz FC, Viscovini RC, Pereira D. Infrared and far-infrared spectroscopy of (CH3OH)-C-13: TeraHertz laser lines and assignments. J Mol Spectroscopy 2007; 241: 151-154.
- Kwon SJ, Park YJ, Jun SH. Thermal irritation of teeth during dental treatment procedures. Restor Dent Endod 2013; 38: 105-112.
- Spierings TAM, Devree JHP, Peters MCRB, Plasschaert AJM. The influence of restorative dental materials on heat transmission in human-teeth. J Dent Res 1984; 63: 1096.
- Vaidyanathan J, Vaidyanathan TK, Wang Y, Viswanadhan T. Thermoanalytical characterization of visible light cure dental composites. J Oral Rehabil 1992; 19: 49-64.
- Dionysopoulos P, Watts DC. Dynamic mechanical-properties of an inlay composite. J Dentistry 1989; 17: 140-144.
- Lloyd CH. A differential thermal-analysis (DTA) for the heats of reaction and temperature rises produced during the setting of tooth colored restorative materials. J Oral Rehabil 1984; 11: 111-121.
- Lloyd CH, Brown EA. The heats of reaction and temperature rises associated with the setting of bonding resins. J Oral Rehabil 1984; 11: 319-324.
- Bashetty K, Joshi S. The effect of one-step and multi-step polishing systems on surface texture of two different resin composites. J Conserv Dent 2010; 13: 34-38.
- Yap AU, Lye KW, Sau CW. Surface characteristics of tooth-colored restoratives polished utilizing different polishing systems. Oper Dent 1997; 22: 260-265.
- Wilson F, Heath JR, Watts DC. Finishing composite restorative materials. J Oral Rehabil 1990; 17: 79-87.
- Schulze KA, Marshall SJ, Gansky SA, Marshall GW. Color stability and hardness in dental composites after accelerated aging. Dent Mater 2003; 19: 612-619.
- Whitehead SA, Wilson NH. The nature and effects of composite finishing pastes. J Dent 1989; 17: 234-240.
- Petersilka GJ, Bell M, Haberlein I. In vitro evaluation of novel low abrasive air polishing powders. J Clin Periodontol 2003; 30: 9-13.
- Kakaboura A, Fragouli M, Rahiotis C, Silikas N. Evaluation of surface characteristics of dental composites using profilometry, scanning electron, atomic force microscopy and gloss-meter. J Mater Sci-Mater Med 2007; 18: 155-163.
- Kumari CM, Bhat KM, Bansal R. Evaluation of surface roughness of different restorative composites after polishing using atomic force microscopy. J Conserv Dent 2016; 19: 56-62.
- Kamalak H, Demirel S, Oz E, Altin S. The leakage study between restorative and pulp capping materials and diffusion analysis by Fick laws. Biointerface Res Appl Chem 2016; 6.
- Kamalak H, Oz E, Demirel S, Altin S. The mechanical and heat conducting properties of dental composites. Biointerface Res Appl Chem 2016; 6.
- Nomura Y, Teshima W, Tanaka N. Thermal analysis of dental resins cured with blue light-emitting diodes (LEDs). J Biomed Mater Res 2002; 63: 209-213.
- Discacciati JAC, Orefice RL. Structural analysis on photopolymerized dental resins containing nanocomponents. J Mater Sci 2007; 42: 3883-3893.
- Atai M, Ahmadi M, Babanzadeh S, Watts DC. Synthesis, characterization, shrinkage and curing kinetics of a new low-shrinkage urethane dimethacrylate monomer for dental applications. Dent Mater 2007; 23: 1030-1041.
- ViIjanen EK, Skrifvars M, Vallittu PK. Dendritic copolymers and particulate filler composites for dental applications: Degree of conversion and thermal properties. Dent Mater 2007; 23: 1420-1427.
- Campos LMD, Boaro LC, Ferreira HP. Evaluation of polymerization shrinkage in dental restorative experimental composites based: BisGMA/TEGDMA, filled with MMT. J Appl Polymer Sci 2016; 133.
- Tian M, Gao Y, Liu Y. Bis-GMA/TEGDMA dental composites reinforced with electrospun nylon 6 nanocomposite nanofibers containing highly aligned fibrillar silicate single crystals. Polymer 2007; 48: 2720-2728.
- Pereira SG, Nunes TG, Kalachandra S. Low viscosity dimethacrylate comonomer compositions (Bis-GMA and CH (3) Bis-GMA) for novel dental composites; analysis of the network by stray-field MRI, solid-state NMR and DSC & FTIR. Biomaterials 2002; 23: 3799-3706.
- Kamalak H, Canbay CA, Yiğit O, Altin S. Physico-mechanical and thermal characteristics of commercially available and newly developed dental flowable composites. J Mol Structure 2018; 1156: 314-319.
- Ferracane JL. Resin composite-state of the art. Dent Mater 2011; 27: 29-38.
- Willems G, Lambrechts P, Braem M, Celis J-P, Vanherle G. A classification of dental composites according to their morphological and mechanical characteristics. Dent Mater 1992; 8: 310-319.
- Prati C, Mongiorgi R, Bertocchi G, Baldisserotto G. Dental composite resin porosity and effect on water absorption. Boll Soc Ital Biol Sper 1991; 67: 409-414.
- Khedmat S, Hashemi A, Dibaji F, Kharrazifard MJ. Effect of chloroform, eucalyptol and orange oil solvents on the microhardness of human root dentin. J Dent 2015; 12: 25-30.
- Firoozmand LM, de Araujo MA. Water sorption, hardness and scanning electron microscopy evaluation of dental composite resins submitted to high-risk decay model and intensive treatment with fluoride. Acta Odontol Latinoam 2011; 24: 141-149.
- Yeh ST, Wang HT, Liao HY, et al. The roughness, microhardness, and surface analysis of nanocomposites after application of topical fluoride gels. Dent Mater 2011; 27: 187-196.
- Korkmaz Y, Ozel E, Attar N, Aksoy G. The influence of one-step polishing systems on the surface roughness and microhardness of nanocomposites. Operative Dentistry 2008; 33: 44-50.
- Schneider LFJ, Moraes RR, Cavalcante LM. Cross-link density evaluation through softening tests: Effect of ethanol concentration. Dent Mater 2008; 24: 199-203.
- Fu SY, Feng XQ, Lauke B, Mai YW. Effects of particle size, particle/matrix interface adhesion and particle loading on mechanical properties of particulate-polymer composites. Composites Part B-Engineering 2008; 39: 933-961.
- Zach L, Cohen G. Pulp response to externally applied heat. Oral Surg Oral Med Oral Pathol 1965; 19: 515-530.
- Pohto M, Scheinin A. Microscopic observations on living dental pulp I. Method for intravital study of circulation in rat incisor pulp. Acta Odontologica Scandinavica 1958; 16: 303-314.
- Patel Z, Geerts GAVM. Temperature changes along a dental implant. Int J Prosthodontics 2011; 24: 58-63.
- Brown WS, Dewey WA, Jacobs HR. Thermal properties of teeth. J Dent Res 1970; 49: 752-755.
