Research Article - Journal of RNA and Genomics (2025) Volume 21, Issue 1
Study on the mechanism of salt-processed alismatis rhizoma (Alisma plantago-aquatica subsp. orientale (sam.) sam.) based on UPLC-Q-TOF-MS, pattern analysis, and transcriptome.
Lin Yan, Zemin Ou, Yi Chen, Yan Tong, Dewen Liu*, Jinyu Wang
Department of Medical Science, Institute of Chinese Materia Medica, China Academy of Chinese Medical Sciences, Beijing 100700, China
*Corresponding Author:
- Dewen Liu
Department of Medical Science, Institute of Chinese Materia Medica, China Academy of Chinese Medical Sciences, Beijing 100700, China
E-mail: dwliu@icmm.ac.cn, jinyu024@163.com
Received: 26-Aug-2023, Manuscript No. RNAI-23-110908; Editor assigned: 28-Aug-2023, RNAI-23-110908 (PQ); Reviewed: 11-Sept-2023, QC No. RNAI-23-110908; Revised: 20-Jan-2025, Manuscript No. RNAI-23-110908 (R); Published: 27-Jan-2025, DOI: 10.35841/2591-7781.21.1000218
Citation: Yan L, Ou Z, Chen Y, et al. Study on the mechanism of salt-processed alismatis rhizoma (Alisma plantago-aquatica subsp. orientale (sam.) sam.) based on UPLC-Q-TOF-MS, pattern analysis, and transcriptome. J RNA Genomics. 2025;21(1):1-12.
Keywords
Alismatis Rhizoma (AR), Salt-processed Alismatis Rhizome (SAR), Ultra-High Performance Liquid Chromatography-Tandem Quadrupole Time-Of-Flight Mass Spectrometry (UPLC-Q-TOF-MS), Terpenoid, Transcriptology
Abbreviations
AR: Alismatis Rhizoma; BC: Betweenness Centrality; BP: Biological process; CC: Cell component; CC: Closeness centrality; CH. P:Pharmacopoeia of the People's Republic of China; DC: Degree centrality; GO: Gene Ontology; HCA: Hierarchical Cluster Analysis; HPLC: High-Performance Liquid Chromatography; KEGG: Kyoto Encyclopedia of Genes and Genomes; MF: Molecular Function; OPLS-DA: Orthogonal Partial Least Square Discriminant Analysis; PCA: Principal Component Analysis; PPI: Protein-Protein Interaction Networks; RT-PCR: Real-Time Quantitative Polymerase Chain Reaction; SAR: Salt-Processed Alismatis Rhizoma; TCM: Traditional Chinese medicine
Introduction
Alismatis Rhizoma (AR) (The plant name corresponds to the latest revision in “World Flora Online”) is derived from the dried tuber of Alisma plantago-aquatica subsp. orientale (Sam.) Sam. and is widely known for its diuretic, dampnessreleasing, heat-releasing, turbid-reducing, and lipid-lowering effects. Both raw and salt-processed pieces of AR are commonly used in Traditional Chinese Medicine (TCM), as affirmed by the 2020 edition of the Pharmacopoeia of the People's Republic of China (CH. P). AR is primarily used to treat adverse urination and edema, with salt processing enhancing its nourishing yin, heat-reducing, and diuretic effects.
Salt roasting is a traditional processing method used in Chinese medicine, which is documented in ancient medical books as a means to introduce the medicine into the kidney and enhance its efficacy simultaneously. “Yizong Cuiyan" and "Yaopin Bianyi" records: "doctors with salt water fried, so that salt to the kidney, the main drop yin fire, to save kidney water", "Bencao Su" also recorded that "the capital kidney water, bladder diarrhea, must be funded in the salt fried". Records on the salt system of AR started in the Qing Dynasty, "Bencao Fengyuan" said, "Ze Xie, facilitate urination of raw, into the tonic salt and wine fried". “Feng's Jinnang Milu" cloud "diarrhea in the spleen and stomach diuretic medicine should be used raw, nourishing Yin, diuretic medicine should be mixed with salt water and fried, eight warm tonic medicines should be mixed with salt wine and fried". According to the "Depei Bencao", "It is used raw or stir-fried in wine to strengthen the spleen. To nourish yin and promote diuresis, it should be stir- fried in salt water." The previous studies of the research group have shown that both AR and Salt-processed AR (SAR) had a good curative effect on edema model rats with kidney yin deficiency, and the callback trend of related indexes in the low-dose SAR group was better than that in the low-dose AR group. Based on the records of the above ancient books and the previous research basis of the research group, it shows that the effect of SAR on nourishing yin and promoting diuresis is stronger than that of AR.
Presently, related literature mainly focuses on chemical composition and simple efficacy changes before and after processing to understand the processing mechanism of AR. Terpenoid components were mainly investigated in the aspect of chemical composition, and the related components were determined mainly by High-Performance Liquid Chromatography (HPLC), which has the problem of a limited number of compounds detected and needs reference substance ratios. Pharmacological effects are mainly focused on simple pharmacodynamic studies, mainly diuretic, anti-inflammatory, spleen-strengthening, and anti-fatigue effects. The research on the processing mechanism of AR is rarely reported and needs to be further discussed.
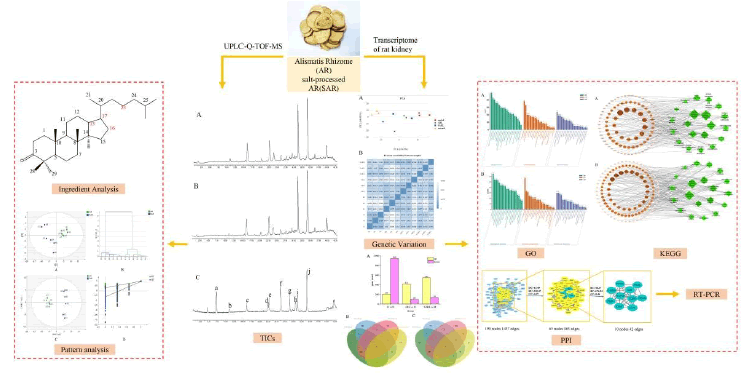
To this end, AR and SAR were selected as the research objects in this experiment. The terpenoid components before and after processing were determined by Ultra-High Performance Liquid Chromatography-Tandem Quadrupole Time-Of-Flight Mass Spectrometry (UPLC-Q-TOF-MS), and the peak area of chemical components was extracted for pattern analysis. The gene expression of different products of AR in the kidney tissue of rats with edema of kidney yin deficiency was obtained by transcriptional sequencing technique, and the changes of gene transcription were compared with those of the normal group and the model group to explore the similarities and differences of the mechanism of AR and SAR in improving the edema model of kidney yin deficiency. This approach aims to initially elucidate the correlation between the variances in efficacy and constituents, as well as investigate the mechanism of action for salt-processed AR [1].
Materials and Methods
Materials
AR and SAR are the same batches of medicinal materials, which were processed by Sichuan New Lotus Traditional Chinese Medicine Co., Ltd. (AR batch number: 2105090, SAR batch number: 2105145) and identified by He Xirong, a teacher of the Institute of TCM, Chinese Academy of TCM. The samples used in the transcriptome were the kidney tissues of rats taken from the previous pharmacodynamic experiment of the research group and frozen at -80°C.
Instruments
The following instruments were used in this study: BT125D 1/100000 Electronic Analytical Balance (Sedolis Scientific Instruments (Beijing) Co., Ltd.); ACQUITY UPLC H-Class Ultra-High-Performance Liquid Chromatograph and Xevo G2- S-QTOF tandem quadrupole time-of-flight high-resolution mass spectrometer (YDA194, Waters Corporation, USA); KQ-250DB ultrasonic cleaner (Kunshan Ultrasonic instrument Co., Ltd.); 5427R frozen centrifuge (German Eppendorf company); DYY-6C agarose gel electrophoresis instrument (Beijing Liuyi instrument Co., Ltd.); LightCycler480 Real-time PCR system (Switzerland Roche company); Universal Hood II gel imaging system (American BIO-RAD company).
Reagents
Chemical standards (purity>98%) of alisol F (CHB160926), and alismoxide (CHB160606) were purchased from Sichuan Chengdu Cloma biotechnology Co., Ltd. (Chengdu, China). Alisol A 24-acetate (Z-061-170417), 23-acetate alisol B (Y-036- 171216), alisol B (Z-045-180810), alisol G (Z-047-181008), and 23-acetate alisol C (Z-062-181015) were purchased from Chengdu Ruifensi Biotechnology Co., Ltd. (Chengdu, China). Alisol A (ST14480120), Alisol B (ST14490120), and Alisol C (ST32970105) were purchased from Shanghai standards technical service Co., Ltd. (Shanghai, China). 16-oxo alisol A (DST210924-346) was purchased from Chengdu Dester Biotechnology Co., Ltd. (Chengdu, China). TRUE script RT Master Mix (PR5802), 2 × Sybr Green Realtime quantitative Polymerase chain reactions (Real-time PCR) Mix (PR3302) were purchased from Beijing Eberson Biotechnology Co., Ltd. (Beijing, China). High-Performance Liquid Chromatography (HPLC)-grade methanol and acetonitrile were purchased from Merck (Darmstadt, Germany). Distilled water was purchased from Watson's Food and Beverage Co., Ltd. (Guangzhou, China).
Methods
UPLC-Q-TOF-MS comparison of the changes in AR and SAR
Preparation of sample solutions: A test solution was created by placing precisely weighed 1.0 g of AR in an Erlenmeyer flask with a stopper, mixing it with 25.0 mL of acetonitrile, and then weighing the mixture after 30 minutes of 100-Hz sonication. A similar procedure was used to create the solution for SAR, and six samples were prepared in parallel.
Preparation of reference solution: The identical 10 mL bottle held alisol A, alisol B, alisol C, alisol F, alisol G, 23-acetate alisol B, 23-acetate alisol C, 24-acetate alisol A, alismoxide, and 16-oxo alisol A, all of which were precisely weighed. Acetonitrile was added to dissolve the mixture and fix the volume, yielding a solution with a mass concentration of 0.2 mg •mL-1 for the mixed reference substance.
Conditions for UPLC-QTOF-MS/MS analysis: The samples were separated using ACQUITY UPLC BEH C18 (2.1 × 100 mm2, 1.7 μm) column. The parameters were as follows: flow rate 0.3 mL•min-1; injection volume 2 μL; column temperature 35°C; mobile phase: Acetonitrile (A)-0.1% formic acid-water (B); gradient conditions: 0-3 min, 10%-30% A; 3-18 min, 30%-40% A; 18-40 min, 40%-85% A; 40-40.1 min, 85%- 10% A; and 40.1-43 min, 10% A. Mass spectrometric analyses were performed on a Waters Xevo G2-S Q-TOF system with an electrospray ionization source, and the positive ion mode was used for data acquisition. The following MS conditions were set: cone gas flow, 50 L•h-1; desolvation gas flow, 600 L•h-1; desolvation temperature, 400°C; source temperature, 120°C; cone voltage, 40 V; and capillary voltage, 2.2 kV. The collision energy was set at 15-45 eV. The mass ranges were set at m/z 100-1200 for a full scan with a scan duration of 1 s [2].
Data processing: The raw spectra data were gathered and controlled with the help of the MassLynx4.1 software (Waters Corporation, MA, USA). After extracting the compound's molecular ion peak and automatically integrating the peak area, the change index of the peak area was calculated as follows: SIMCA14.1 performed Principal Component Analysis (PCA), Hierarchical Cluster Analysis (HCA), and Orthogonal Partial Least Square Discriminant Analysis (OPLS-DA) at the same time as the change index=the average value of the SAR peak area/the average value of the AR peak area.
Transcriptome comparison of the effects of salting
Extraction of total RNA: Trizol was used to extract total RNA. From the refrigerator at -80°C, three kidneys from the normal group, model group, low-dose AR group, and low-dose SAR group were removed in parallel. Add a suitable amount of liquid nitrogen and pulse the grinder until it is fully operational. A precise 50-100 mg sample was weighed, 1 mL Trizol and 250 μL chloroform were added, the sample was rapidly shaken for 15 s, and the room temperature was allowed to elapse for 3 minutes. Then, using centrifugation, the topmost solution containing RNA was collected. Remove the upper solution by sucking it out, then add an equal amount of isopropanol, stir, and let sit for 10 minutes at room temperature. After that, centrifuge to remove the supernatant, add 1 mL of 75% ethanol, and repeat to remove the supernatant, RNA is in precipitation [3].
Library construction, quality inspection, and sequencing: The mRNA containing poly(A) tail was enriched using Oligo(dT) magnetic beads, and the fragmented mRNA was obtained through random fragmentation. The first strand of cDNA was synthesized via reverse transcription, with the fragmented mRNA serving as the template, and an oligonucleotide as the primer. The second strand of cDNA was synthesized using dNTPs in the DNA polymerase I system. The resulting double-stranded cDNA was purified, followed by terminal repair, A-tailing, and ligation of adapter sequences. Subsequently, cDNA fragments ranging from 370-420 bp were amplified by PCR and further purified to obtain the library. The library was pre-quantified and detected before precise quantification using qRT-PCR to ensure library quality. After library validation, Illumina sequencing was performed using fluorescent-labeled dNTPs, DNA polymerase, and primer pairs. This experiment was completed by Beijing Nuohe Zhiyuan Technology Co., Ltd.
Data quality control and preliminary analysis: Base recognition converts the image data collected by the highthroughput sequencer into sequence data, which includes information on the sequencing quality and the sequence information of the sequence fragments. The original data were then filtered to assure the accuracy of the results and the validity of the data, as well as for quantitative and correlation analyses of gene expression level and sequence alignment to the reference genome.
Differential gene screening: To examine the differences in gene expression between the normal group, model group, lowdose AR group, and low-dose SAR group, DESeq 2 and the Edge R software package were used. |log2foldchange| >2 and a difference of p<0.05 are screening criteria for genes that are differentially expressed [4].
Enrichment analysis of differential genes and Protein- Protein Interaction Networks (PPI): The online database Metascape performed GO and KEGG enrichment analyses on the chosen differentially expressed genes, including Biological Process (BP), Cell Component (CC), Molecular Function (MF), and KEGG pathway. STRING database provides the foundation for PPI analysis. The discrete targets were buried, the moderate confidence was set to >0.4, the differential genes were entered into the STRING online database, and the TSV format of the results was stored. Cytoscape 3.8.0 and the CytoNCA plug-in were used to evaluate the data, and the key targets were screened in addition to the three topology characteristics of Degree Centrality (DC), Betweenness Centrality (BC), and Closeness Centrality (CC) in the interactive network nodes. And Cytoscape 3.8.0 and the bioinformatics platform were used to visualize the outcomes.
RT-PCR verification of core targets: The RNA of the samples was adjusted to the same concentration using nonenzyme water after determining the concentration of the other Illumina sequencing samples, and the cDNA was generated by reverse transcription using TRUE script RT master mix. Predenaturation at 94°C for 30 s; denaturation at 94°C for 5 s, annealing at 55°C for 15 s, and extension at 72°C for 10 s, for 45 cycles were the amplification conditions [5]. The expression of the target gene was determined using the 2-ΔΔCt technique, with β-actin serving as the internal reference gene. The primers used in the experiment were designed and synthesized by Beijing Qingke Biotechnology Co., Ltd. The sequence of primers is shown in Table 1.
| Primers | Primer sequence(5' to 3') | Length/bp |
|---|---|---|
| PTPRC-F | TCGGCCCAGAAGTCTTTGTC | 137 |
| PTPRC-R | GCTGCTGAGTGTCTGAGTGT | |
| CD4-F | AAGGACTGGCCAGAGACTCA | 188 |
| CD4-R | CGAGGTACTTTCACAGGGCA | |
| LCP2-F | CCCCAACACCAACTCCATGT | 135 |
| LCP2-R | TCATGGTTGGGCGAGTGATT | |
| FCGR3A-F | TCCGTGGCAGTCTATGAGGA | 138 |
| FCGR3A-R | CAGATGGTGAGGTCGCAAGT | |
| CD8A-F | TGCTTTCTGTCGCTGAACCT | 134 |
| CD8A-R | CGCAGCACTTCGCATGTTAG | |
| ITGAX-F | GGCAGACGTTTCCAAGTTGC | 148 |
| ITGAX-R | GGGCCTGGCTCACTAAGAAC | |
| PLEK-F | CTCACGGACTGGGAAATGAG | 145 |
| PLEK-R | ACCCATCTGAGGAAGGCGAA | |
| CCR5-F | ACAAGAAACTCTGGCTCTTGC | 126 |
| CCR5-R | GAGCTGGGCTGCAATTTGTT | |
| CSF1R-F | TGGGGAGAAGAGTAGGACCAC | 148 |
| CSF1R-R | GCCACTAGGCTCGATGACAG | |
| TLR2-F | TGGAGGTCTCCAGGTCAAATC | 130 |
| TLR2-R | ACCAGCAGCATCACATGACA | |
| β-actin-F | GTACTCTGTGTGGATCGGTGG | 141 |
| β-actin-R | GCAGCTCAGTAACAGTCCG |
Table 1. Primers’ information.
Results
Chemical composition identification
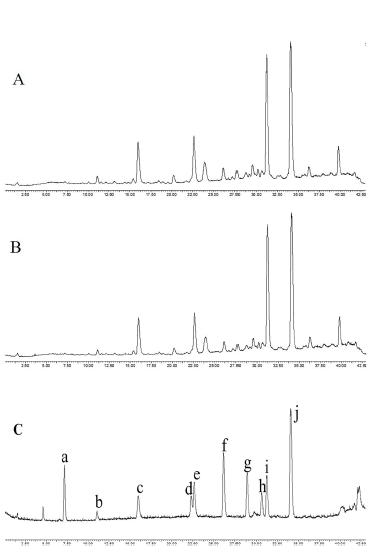
Figure 2 displays the total ion flow diagram (TIC) using a positive ion model to compare the chemical constituents of AR and SAR. The preliminary analysis results can be found in Table S1 of the supporting information. Upon examination of the chart, there were no notable differences in the chemical composition between AR and SAR, and any evident formation or disappearance of novel components following salt processing [7]. Combined with relevant literature, 63 primary components and 47 major terpenoids-including 2 sesquiterpenes and 45 triterpenoids such as alisol A, 23-acetate alisol B, and C were effectively identified using relative retention times, accurate molecular weights, and secondary mass spectrometry fragmentation information. Additionally, compounds 1, 7, 14, 25, 30, 46, and 52 were verified utilizing standards.
Note: a: Alismoxide; b: 16-oxo alisol A; c: Alisol C; d: Alisol F; e: 23-acetate alisol C; f: Alisol A; g: 24-acetate alisol A; h: Alisol G; i: Alisol B; j: 23-acetate alisol B.
Chemical composition analysis
Out of the 47 compounds identified, terpenoids have been categorized based on their structural characteristics and previous literature. They are divided into six types:
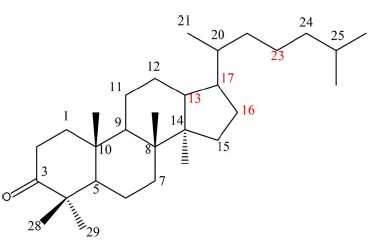
• Type 1 comprises compounds 13, 15, 18, 36, 43, 45, 49, 50, 53, 55, 57, and 58, possessing a six-membered ring with an oxygen bridge between C16 and C23.
• Type 2 includes compounds 3, 7, 11, 14, 24, 25, 26, 28, 29, 33, 35, 37, 40, 42, 48, and 59, displaying a keto substitution at position C16.
• Type 3 encompasses compounds 22, 27, 30, 31, 38, 39, 46, 47, 51, 52, 62 and 63, having an open fat chain substitution at position C17.
• Type 4 is made up of compounds 1 and 6, which are sesquiterpenes.
• Type 5 consists of compounds 9, 32, and 34, characterized by tricyclic triterpenes, and
• Type 6 comprises compounds 16 and 19, characterized by a ternary ring with an oxygen bridge between C13 and C17.
Triterpenes undergo cleavage and rearrangement around C23-C24, leading to the formation of key skeleton ions such as [M+H-H2O]+, [M+H-HAc]+, [M+H-2H2O-HAc]+, with a loss of
H2O (18 Da) or HAc (60 Da). When there is an oxygen ring between C24 and C25, C4H8O (72 Da) is lost, and when there is no oxygen ring, C4H10O2 (90 Da) is lost. Further details about
the fragmentation patterns of various representative compounds are provided in the supporting information (Figure 3) [8].
Pattern analysis
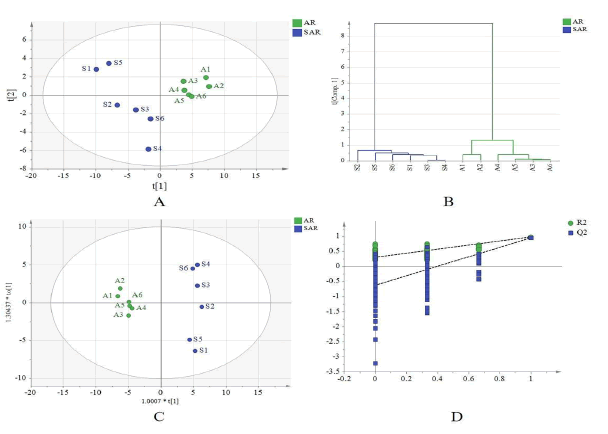
The molecular ions of AR and SAR compounds were imported into MassLynxv4.1 for ion current diagram extraction, and peak area data was automatically obtained. Six sample peak area data were analyzed using SIMCA14.1 with PCA, OPLS-DA, and HCA techniques, as depicted in Figure 4. The analyses revealed evenly distributed AR and SAR groups on either side of the Yaxis, indicating homogeneity within each group [9]. Additionally, the positive ion detection mode successfully distinguished AR and SAR, indicating significant chemical composition changes due to salt processing. HCA confirmed two distinct groups, while OPLS-DA analysis demonstrated clear distinctions between the two groups with an R2X of 0.857 and an R2Y of 0.983. Lastly, a 200th replacement test confirmed the model had no over fitting and possessed reliable predictive ability.
(Note: A1∼A6 is 6 samples of AR; S1∼S6 is 6 samples of SAR)
Quality inspection results of RNA samples
After conducting RNA-Seq sequencing on the transcriptional group of rat kidneys, the initial data from the normal, model, low-dose AR, and low-dose SAR groups were obtained [10]. Following the removal of low-quality and joint data, a total of 46,953,335, 44,113,875, 42,387,223, and 45,195,287 clean reads were obtained for the respective groups, with corresponding total sizes of 7.04, 6.62, 6.36, and 6.78 G. As indicated in Table 2, the base sequencing error rate for all samples was controlled at 0.03%. The Q20 values for the normal, model, low-dose AR, and low-dose SAR groups were 97.24%, 96.19%, 95.92%, and 96.78%, respectively. In comparison, the Q30 values were 92.56%, 90.55%, 89.95%, and 91.71%, respectively. Furthermore, the GC base contents of all samples were largely similar. Through reference sequence alignment, it was discovered that each sample group had a successful reading count of over 93%, as shown in Table 3. These results illustrate that the sequencing data from this experiment is of high quality, and as such, can be considered reliable and suitable for subsequent analyses.
| Sample | Raw reads | Clean reads | Clean bases | Error rate | Q20 | Q30 | GC pct |
|---|---|---|---|---|---|---|---|
| N1 | 50 740 796 | 49 745 730 | 7.46 G | 0.03 | 97.78 | 93.63 | 48.51 |
| N2 | 51 022 986 | 49 288 450 | 7.39 G | 0.03 | 97.62 | 93.24 | 48.89 |
| N3 | 43 227 392 | 41 825 824 | 6.27 G | 0.03 | 96.33 | 90.8 | 48.52 |
| M1 | 45 709 774 | 43 525 402 | 6.53 G | 0.03 | 96.2 | 90.57 | 46.97 |
| M2 | 45 655 098 | 44 017 828 | 6.60 G | 0.03 | 96.12 | 90.4 | 46.09 |
| M3 | 46 164 916 | 44 798 394 | 6.72 G | 0.03 | 96.24 | 90.67 | 46.78 |
| ARL1 | 45 328 984 | 43 515 766 | 6.53 G | 0.03 | 94.85 | 87.79 | 47.11 |
| ARL2 | 45 751 802 | 44 026 218 | 6.60 G | 0.03 | 96.47 | 91.1 | 47.06 |
| ARL3 | 42 329 896 | 39 619 686 | 5.94 G | 0.03 | 96.45 | 90.97 | 46.41 |
| SARL1 | 45 561 712 | 44 133 664 | 6.62 G | 0.03 | 97.74 | 93.47 | 47.34 |
| SARL2 | 47 127 160 | 45 489 770 | 6.82 G | 0.03 | 96.19 | 90.61 | 47.44 |
| SARL3 | 47 210 816 | 45 962 428 | 6.89 G | 0.03 | 96.42 | 91.04 | 46.7 |
Table 2. Quality assessment for sequencing data.
| Sample | Total reads | Total/% | Unique/% | Multi/% | Exon/% | Intron/% | Intergenic/% |
|---|---|---|---|---|---|---|---|
| Normal | 46 953 335 | 95.16 | 88.33 | 6.83 | 84.31 | 3.35 | 12.34 |
| molder | 44 113 875 | 93.86 | 86.7 | 7.17 | 83.74 | 3.45 | 12.81 |
| ARL | 42 387 223 | 93.52 | 86.31 | 7.2 | 83.26 | 3.82 | 12.92 |
| SARL | 45 195 287 | 94.53 | 87.51 | 7.01 | 84.18 | 3.31 | 12.51 |
Table 3. Clean reads distribution in different regions of the reference genome.
Correlation analysis of gene expression
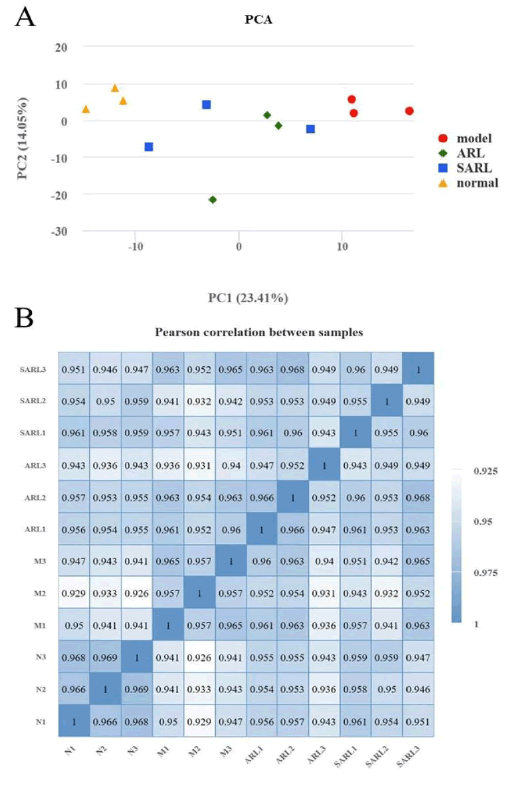
PCA can reflect the influence of gene expression on the sample, dividing the distance between samples based on the difference in gene expression. This distance represents the similarity between samples. Similarly, the Pearson correlation coefficient also represents the correlation between sample variables. When the correlation coefficient between samples is closer to 1, it means that there is a stronger correlation between samples based on the similarity of gene expression. As depicted in Figure 5A, in the normal, model, low-dose AR, and low-dose SAR groups, each sample within the same group is closely clustered, while each group is dispersed from one another, indicating that the mRNA expression in kidney tissue of rats in each group differs. The Pearson correlation coefficient analysis demonstrated a high correlation between the low-dose AR and the low-dose SAR groups (represented by darker color in Figure 5B), indicating that the detected gene changes were similar between the two groups. In contrast, the correlation coefficient between the normal and model groups was smaller (with lighter colors in Figure 5B), suggesting a significant difference in gene expression between these groups and indicating that the previous research group's modeling method could change the level of gene expression in the rat kidney. After treatment, the correlation of gene expression level increased compared with the normal group, indicating that low doses of AR and SAR can positively regulate the expression level of relevant genes [11].
Differential gene analysis
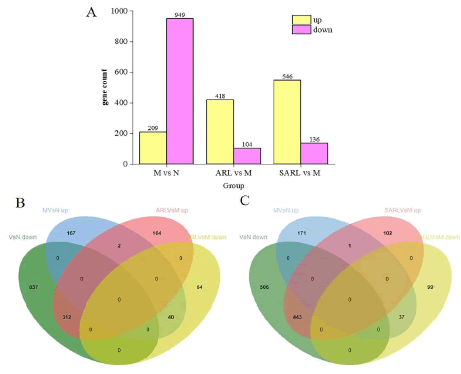
The analysis of the original data obtained through transcriptome sequencing indicated significant differential expression of genes among the various groups, as detailed in Figure 6A. Between the model group and the normal group, a total of 1158 differential genes were identified, with 949 genes being down-regulated and 209 genes being up-regulated. These findings strongly suggest that the construction of the kidney yin deficiency edema model markedly affected gene expression in rat kidney tissue. A comparison between the model group and the low-dose AR group revealed 522 differential genes, comprising 418 up-regulated genes and 104 down-regulated genes. Additionally, when compared to the model group, there were 682 differential genes between the low-dose SAR group and the model group, including 546 up-regulated genes and 136 down-regulated genes [12]. Following low-dose treatment with AR, 40 significantly up-regulated genes and 312 significantly down-regulated genes among the model group were significantly down-regulated and up-regulated, respectively. Similarly, following low-dose treatment with SAR, 37 significantly up-regulated genes and 443 significantly down-regulated genes among the model group were significantly down-regulated and up-regulated, respectively, as depicted in Figures 6B and C. These results demonstrate that both low-dose AR and low-dose SAR interfere with gene expression in the kidneys of rats with kidney-yin deficiency edema, with the number of regulated genes being significantly higher in the low-dose SAR group than in the low- dose AR group [13].
GO analysis of differential genes
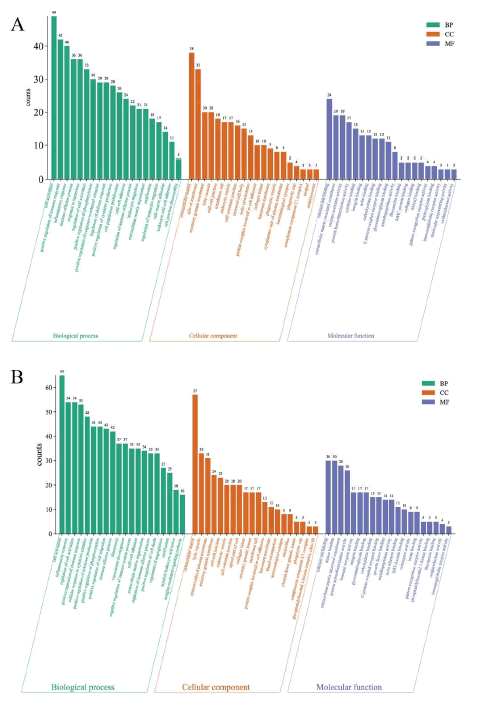
The study revealed notable differences between the low-dose AR and SAR groups in terms of acquired biological processes, cell components, and molecular functions with 629, 77, and 68 entries for the former and 1078, 88, and 108 for the latter [14]. The results of the GO enrichment analysis were visually presented in Figure 7, exhibiting the top 20 gene entries of biological processes, molecular functions, and cellular components with the most significant disparity in the gene set between the AR and SAR groups. These findings provide crucial insights into the differential genetic basis of AR and SAR.
This study conducted a GO enrichment analysis on 60 gene items with the most significant difference in gene sets between AR and SAR. Out of the 60 gene items, 36 were found to be identical. These items comprised 11 biological processes, 12 molecular functions, and 13 cellular components. Biochemical processes identified the primary roles of cell activation, positive regulation of immune response, inflammatory response, positive regulation of phosphorylation, and positive regulation of cytokines. The molecular functions mainly include calcium binding, immunoglobulin receptor activity, extracellular matrix structure components, and G proteincoupled receptor binding, among others [15]. In cellular components, lytic vacuoles, membrane rafts, extracellular matrix, and immune synapses were identified as key components. The results of the GO enrichment analysis suggest that both AR and SAR play crucial roles in promoting inflammatory reactions and immune regulation in the treatment of kidney yin deficiency-related edema. Interestingly, the genes in the low-dose SAR group not only covered those in the lowdose AR group but also were more diverse. This may explain why the efficacy of the low-dose SAR group is superior to that of the low-dose AR group. Details of specific gene items and names can be found in Tables S2, S3, and S4 in the appendix. The survey results for different gene items are presented in Table S5 of the appendix.
KEGG analysis of differential genes
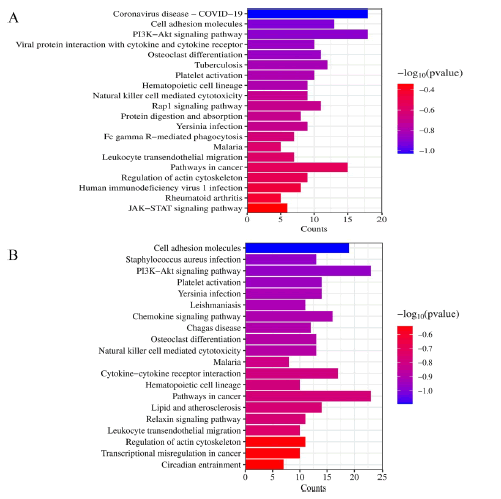
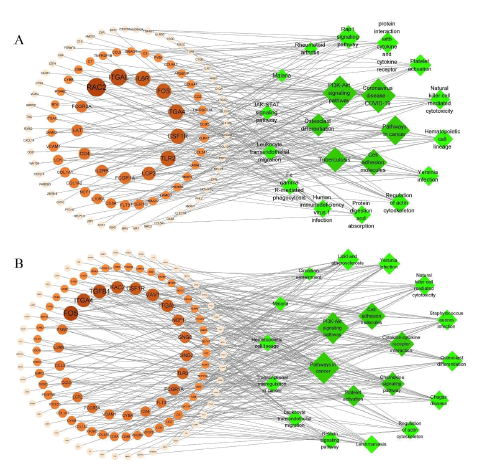
The study yielded results that identified 58 pathways in the low-dose AR group and 98 pathways in the low-dose SAR group. It was observed that the enrichment pathway in the lowdose SAR group was essentially a subset of the pathways present in the low dose AR group, as illustrated in Figure S9 [16]. The top 20 signal pathways, which exhibited the most significant differences, are displayed in Figures 8 and 9, and a target-path diagram is depicted. Figure 8 emphasizes the significant enrichment of AR and SAR in cell adhesion molecules, PI3K-Akt signaling pathway, platelet activation, and leukocyte transendothelial migration pathways. Distinguishing the low-dose SAR group from the low-dose AR group, it was noted that the former exhibited substantial enrichment in the cGMP-PKG signaling pathway, MAPK signaling pathway, Ras signaling pathway, Intestinal immune network for IgA production, and other pathways. Thus, it can be concluded that the mechanism employed by SAR to address the edema of kidney-yin deficiency may be distinct from what is observed in AR. Furthermore, the pathways covered by the low-dose SAR group were more comprehensive than those present in the low-dose AR group. The outcomes of this study reveal that SAR has a distinctive impact on the cell signaling pathways of interest.
Further analysis of the KEGG enrichment pathway showed significant enrichment in the PI3K-Akt signaling pathway in the pathway map. This signaling pathway is the target of the differential gene set of AR and SAR and is expected to be the primary way of improving kidney yin deficiency-related edema, as shown in Figure 8. Figure S7 illustrates the genes involved in the enrichment of the PI3K-Akt signaling pathway in AR and SAR. Notably, 11 pathways overlapped in AR and SAR among the top 20 pathways (Table S6). In terms of gene targets involved in the same signal pathway, the low-dose SAR group included the genes of the low-dose AR group coupled with additional genes (as depicted in Figure S9). Overall, these results suggest that low-dose SAR may be a more efficient treatment strategy from a molecular standpoint. The acquired knowledge may provide new insights for developing effective therapeutic approaches for kidney yin deficiency-related diseases that require further evaluation in future studies.
PPI analysis of differential genes
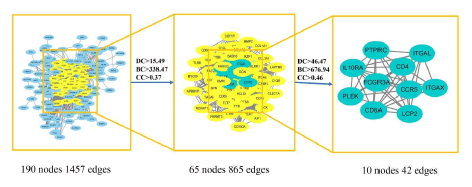
In this academic study, the number of differentially expressed genes in the treatment of kidney yin deficiency edema between AR and SAR was found to be 262 [17]. The overlapping genes were then analyzed using the STRING online tool and imported into cytoscape3.8.0 software, where the CytoNCA plug-in was employed to calculate the average values of DC, BC, and CC, resulting in values of 15.49, 0.37, and 338.47, respectively. To identify core targets for the treatment of kidney yin deficiency edema, the DC, BC, and CC values were multiplied by 3, 2, and 1.25, respectively. The resulting values were then used to screen and identify 10 core targets, namely PTPRC, CD4, LCP2, FCGR3A, CD8A, ITGAX, PLEK, CCR5, CSF1R, and TLR2, as presented in Figure 10. Detailed topology parameters can be found in Table 4.
| Number | Gene Symbol | Degree | Betweeness | Closeness |
|---|---|---|---|---|
| 1 | PTPRC | 83 | 4 669.57 | 0.57 |
| 2 | CD4 | 70 | 3 159.37 | 0.53 |
| 3 | LCP2 | 59 | 1 348.11 | 0.49 |
| 4 | CD8A | 54 | 1 418.56 | 0.5 |
| 5 | FCGR3A | 53 | 847.77 | 0.49 |
| 6 | ITGAX | 51 | 1 001.56 | 0.49 |
| 7 | PLEK | 51 | 1 259.77 | 0.47 |
| 8 | CCR5 | 50 | 841.81 | 0.48 |
| 9 | CSF1R | 49 | 1 230.38 | 0.48 |
| 10 | TLR2 | 48 | 1346.04 | 0.5 |
Table 4. Core target statistics.
RT-PCR verification results of core targets
Compared to the normal group, the model group's mRNA transcription level for related genes demonstrated a downward trend, with significant differences observed for all genes except ITGAX and PLEK (p<0.05) [18]. Conversely, the expression level of related genes in the AR and SAR showed an upward trend when compared to the model group. This trend aligned with the results of the transcriptional analysis, suggesting credible sequencing outcomes. Please refer to Table 5 for further details.
| Gene | Normal | Model | Low-dose AR group | Low-dose SAR group |
|---|---|---|---|---|
| PTPRC | 2.39 ± 0.54 | 0.63 ± 0.30## | 1.81 ± 0.49* | 2.21 ± 0.20** |
| CD4 | 2.26 ± 0.44 | 0.79 ± 0.17## | 1.18 ± 0.11 | 1.80 ± 0.51* |
| LCP2 | 2.14 ± 0.25 | 0.48 ± 0.08## | 1.30 ± 0.38* | 1.01 ± 0.26 |
| FCGR3A | 1.99 ± 0.58 | 0.64 ± 0.11## | 1.91 ± 0.53* | 2.10 ± 0.44** |
| CD8A | 2.13 ± 0.29 | 0.57 ± 0.27## | 1.52 ± 0.52* | 1.59 ± 0.17* |
| ITGAX | 2.20 ± 1.14 | 1.08 ± 0.28 | 1.73 ± 0.81 | 2.11 ± 1.20 |
| PLEK | 1.90 ± 0.43 | 0.69 ± 0.12 | 2.06 ± 0.68 | 1.50 ± 0.77 |
| CCR5 | 2.30 ± 0.26 | 0.62 ± 0.26## | 1.41 ± 0.15* | 1.77 ± 0.23** |
| CSF1R | 2.24 ± 0.24 | 1.45 ± 0.08# | 1.98 ± 0.36 | 1.94 ± 0.35 |
| TLR2 | 2.24 ± 0.45 | 0.73 ± 0.23# | 1.68 ± 0.74 | 1.62 ± 0.09 |
| Note: #p<0.05, ##p<0.01 compared to normal group; *p<0.05, **p<0.01 compared to model group) | ||||
Table 5. Results of the transcriptional level of core target mRNA (x ± s, n=3).
Discussion
TCM is a unique healthcare system with a long history of use in China and is increasingly gaining recognition worldwide. TCM contains numerous plant-derived natural products, with multiple potential pharmaceutical applications. The chemical composition of TCM is the material basis for its efficacy, and differences in pharmacological activity and utility of different processed varieties of TCM are due to changes in chemical composition. In this context, the current study aimed to investigate the variation in terpenoid components following the salt processing of AR, which has been used as a diuretic agent in TCM for centuries.
Terpenoids are complex organic compounds with a range of biological activities and are found in many TCMs. In the current investigation, the terpenoid components of AR were compared before and after processing using UPLC-Q-TOFMS. Results showed that there was no significant change in the overall terpenoid content after salt processing, but there was a marked variation in individual compounds. Multivariate statistical analyses demonstrated a significant change in the compound content after salt processing. Specifically, most of the chemical components of AR decreased after salt processing, and some compounds, such as 24-acetate alisol A and alisol B, increased. Previous studies have suggested that certain compounds of AR, including 16-oxo-alisol A, 24- acetate alisol A, 23-acetate alisol B, 23-acetate alisol C, alisol A, alisol B, and alisol C, may be responsible for its diuretic activity. Analysis of the change index of in vitro chemical composition also showed that salting had a great effect on the contents of these components, especially alisol A and alisol B, which increased significantly after salt treatment and positively influenced the diuretic activity of AR. Furthermore, Wang et al found that 24- acetate alisol A was active in terms of AR’s diuretic activity but that the content of 23-acetate alisol B decreased after salting, which could affect the overall quality of AR and its processed products [19].
Although the main components of AR and SAR were determined, the specific quantity ratio relationship of the main terpenoids needs further investigation to verify the scientific nature of SAR. The study also showed that 23-acetate alisol B, 24-acetate alisol A, and alisol B could induce autophagy, promote apoptosis, and produce nephrotoxicity in HK-2 cells. However, the toxicity could be reduced by optimizing the ratio of the three components. Moreover, the total triterpenoid extract of AR, which serves as an efficacious diuretic ingredient, can optimize the ratio of the five major triterpenoids (23-acetate alisol B, alisol B, 24-acetate alisol A, alisol A, 23-acetate alisol C), thereby boosting the diuretic efficacy. Overall, SAR has great potential to increase the content of corresponding diuretic components and optimize the dose ratio relationship of the main components, thereby reducing nephrotoxicity. This may be an important reason why the low-dose SAR group is superior to the low-dose AR group. In summary, our study provides valuable insights into the chemical composition of AR and SAR and their diuretic activities. Our findings also suggest that salting may be an effective approach to increase the diuretic properties of AR while reducing nephrotoxicity. The results contribute to the development of new and more effective TCMs that can meet the changing healthcare needs of modern society.
The enrichment analysis of AR and SAR using GO revealed that 10 genes, including PTPRC, SLC11A1, TLR2, CD74, CD4, CCL5, HMCN1, LAT, C3, and CLEC7A, were frequently identified. These genes mainly modulate signal transduction molecules and their encoded proteins primarily mediate immune system and inflammatory responses. For instance, TLR2-encoded proteins are Toll-like receptors that play an integral role in pathogen sensing and innate immune activation. CD4 proteins can initiate or enhance the early stages of T-cell activation and serve as a crucial mediator for intermediate neuron damage in the central nervous system in cases of infectious and immune-mediated diseases, while CD74 contributes to immune response regulation and antigen presentation. Unlike the low-dose AR group, the low-dose SAR group showed increased CD2, LCP1, and KLRK1 frequency, among other targets whose encoded proteins play a significant role in pathogen recognition and innate immune activation.
The PI3K-Akt signaling pathway can regulate cell metabolism, proliferation, and function, and participate in the regulation of cell survival, growth, and angiogenesis [20]. The pathway can phosphorylate various downstream factors, such as enzymes, kinases, and transcription factors, to modulate cell function. It can also regulate glycogen storage by controlling glycogen synthase kinase-3, which is a key protein in glycogen synthesis. Therefore, activating this pathway can promote liver glycogen synthesis, enhance energy consumption, and supplement glycogen levels in rats with kidney yin deficiency. Increasing the phosphorylation level of PI3K and Akt pathway proteins can correct disorders of glucose and lipid metabolism and reverse insulin resistance. Elevated levels of the pathway activation can release anti-inflammatory cytokines, attenuate the inflammatory response in renal tissue, and improve proteinuria in mice. The low-dose SAR group had a more significant effect on target regulation, and the encoded proteins were associated with inflammation and other reactions, which may account for the better efficacy of SAR compared to AR.
Conclusion
In this experiment, we used UPLC-Q-TOF-MS to compare the in vitro components of AR and SAR. We found that the salting process did not affect the types of chemical components significantly, but it had a considerable impact on the content of main terpenoids. SAR showed an elevation in the content of 23-acetate alisol C and a decrease in the content of 23-acetate alisol B, which may expand the genes regulated in the same pathway and extend the range of signal targets. In the process of AR salting, the content of the main components and the impact of their mutual ratio on efficacy need to be elucidated further. The dose-effect relationship should be established, and the effects of the main components' content and compatibility on drug action should be discussed to explain the internal mechanism of AR salting.
Funding
This research was funded by the National Natural Science Foundation of China (Grant No. 82003951).
Author Contributions
Conceptualization, LY, YC, and TY; Methodology, LY, ZO, and DWL; Formal Analysis, LY, YC, and JYW; Investigation, YJW, ZO, and YT; Resources, DWL, and JYW; Writing- Original Draft Preparation, LY, DWL, and YJW; Writing- Review and Editing, LY, YC, ZO, DWL, and TY; Supervision, JYW; Project Administration, DWL; Funding Acquisition, DWL; All authors have read and agreed to the content of the manuscript.
Conflict of Interest
The authors declare that they have no conflict of interest.
References
- Chen X, Li H. Protective effects of raw and different concoctions of Alismatis Rhizoma on acute liver injury in mice. Chin Med Mat. 2006;6:592-3.
- Chen Z. Different regions ze epsom salt in the water extraction liquid before and after the main ingredients and diuretic effect analysis. J North Pharm. 2016;13(09):126-7.
- CP Commission. Pharmacopoeia of the People's Republic of China. People’s Medical Publishing House, Beijing, China. 2020.
- Cui FQ, Wang YF, Gao YB, et al. Effects of BSF on podocyte apoptosis via regulating the ROS?mediated PI3K/AKT pathway in DN. J Diabetes Res. 2019;2019(1):9512406.
[Crossref] [Google Scholar] [PubMed]
- Dai M, Li S, Shi Q, et al. Changes in triterpenes in alismatis rhizoma after processing based on targeted metabolomics using UHPLC-QTOF-MS/MS. Molecules. 2021;27(1):185.
[Crossref] [Google Scholar] [PubMed]
- Han W, Lin X, Guo N, et al. 1HNMR analysis of constituent transformations before and after salt preparation of Alismatis Rhizoma. Chin J Magn Reson. 2016;33(1):117-24.
- Johnston A, Ponzetti K, Anwer MS, et al. cAMP-guanine exchange factor protection from bile acid-induced hepatocyte apoptosis involves glycogen synthase kinase regulation of c-Jun NH2-terminal kinase. Am J Physiol Gastrointest Liver Physiol. 2011;301(2):G385-400.
[Crossref] [Google Scholar] [PubMed]
- Liu Y. The Preliminary Pharmacological Study on Fujian Zexie Terpenoids Components “Clearing Damp and Promoting Diuresis”. Hefei, China: Anhui University of Chinese Medicine. 2018.
- Mensali N, Grenov A, Pati NB, et al. Antigen-delivery through invariant chain (CD74) boosts CD8 and CD4 T cell immunity. Oncoimmunology. 8(3):1558663.
[Crossref] [Google Scholar] [PubMed]
- Nilsen NJ, Vladimer GI, Stenvik J, et al. A role for the adaptor proteins TRAM and TRIF in toll-like receptor 2 signaling. J Biol Chem. 2015;290(6):3209-22.
[Crossref] [Google Scholar] [PubMed]
- Powell DA, Frelinger JA (2017) Efficacy of resistance to Francisella imparted by ITY/NRAMP/SLC11A1 depends on route of infection. Front Immunol. 2017;8:206.
[Crossref] [Google Scholar] [PubMed]
- Suga H, Sugaya M, Fujita H, et al. TLR4, rather than TLR2, regulates wound healing through TGF-β and CCL5 expression. J Dermatol Sci. 2014;73(2):117-24.
[Crossref] [Google Scholar] [PubMed]
- Tao Y, Jiang E, Yan J, et al. A biochemometrics strategy for tracing diuretic components of crude and processed Alisma orientale based on quantitative determination and pharmacological evaluation. Biomed Chromatogr. 2020;34(2):e4744.
[Crossref] [Google Scholar] [PubMed]
- Wang C. Research on Relevancy of Efficacy-Toxicity-Chromatogram and Its Mechanism of Total Terpenoids as Preparation Units Basing on “Component Structure” Theory. Hefei, China: Anhui University of Chinese Medicine. 2016.
- Wang J, Zhang C, Xu P, et al. Phosphoinositide 3?kinase/protein kinase B regulates inflammation severity via signaling of Toll?like receptor 4 in severe acute pancreatitis. Mol Med Rep. 2018;17(6):7835-44.
[Crossref] [Google Scholar] [PubMed]
- Wang LX, Wu QN, Zhang Q, et al. Basic study of diuretic active compounds in Rhizoma Alismatis. West China J Pharm Sci. 2008;23(6):670-2.
- Wang X, Ji CG, Zhang JZ (2015) Glycosylation modulates human CD2-CD58 adhesion via conformational adjustment. J Phys Chem B. 119(22):6493-501.
[Crossref] [Google Scholar] [PubMed]
- Wang XS, Zhu YL, Lyu MY, et al. Anti-fatigue effect of lubian on kidney Yin deficiency and kidney Yang deficiency mice and mechanism based on PI3K-Akt pathway. China J Chinese Materia Medica. 2023:3032-8.
[Crossref] [Google Scholar] [PubMed]
- Wang Y, Luo Y, Yao Y, et
