Research Paper - Materials Science and Nanotechnology (2018) Volume 2, Issue 2
Structural and electrical properties of manganese doped cobalt ferrite nanoparticles.
1Department of Physics, Military Institute of Science and Technology (MIST), Dhaka, Bangladesh
2Department of Physics, Bangladesh University of Engineering and Technology (BUET), Dhaka, Bangladesh
- *Corresponding Author:
- F. A. Khan
Department of physics
Bangladesh University of Engineering and Technology (BUET)
Dhaka, Bangladesh
E-mail: fakhan@phy.buet.ac.bd
Accepted date: August 16, 2018
Citation: Ahsan MZ, Khan FA. Structural and electrical properties of manganese doped cobalt ferrite nanoparticles. Mater Sci Nanotechnol. 2018;2(2):1-9.
Abstract
The structural, electrical and magnetoresistive properties of manganese doped cobalt ferrite nanoparticles have been investigated through measurements of dc and ac magnetic properties. The samples were synthesized via standard solid state reaction route. The X-ray diffraction patterns confirm the formation of spinel structure of the synthesized samples. Field Emission Electron Microscopy (FESEM) is done to estimate the average particle size. The energy dispersion spectrum marks the presence of Co, Mn, Fe and O in the studied sample. The dielectric constant and impedance were measured in the frequency range 100 Hz to 120 MHz and temperature range 400oC to 1200oC. Frequency dependent dispersion exhibits an anomalous behavior in the range between 1 MHz and 10 MHz. A pronounced leftward shift of relaxation peaks in the dispersion observed in the loss factor tanδ curve. The fabricated nanoparticles have shown semiconducting behaviour at low frequency regime (100 Hz, 1 kHz and 10 kHz) but a purely insulating behaviour at higher frequency regime (100 kHz and 1 MHz) indicating a second order phase transition. The magnetoresistive properties of Co1.125Mn0.125Fe1.875O4 in particular is assumed to be originated from the localized electrons and the magnetoresistance decreases monotonically with increasing magnetic field and hence bears the signature of a semiconducting material. However comparing the transvers and longitudinal magnetoresistance of the material we found that both the magnetoresistive parameters are magnetic field dependent and thus presumed to be a signature of mixed metallic and semiconducting nature of the material.
Keywords
Cobalt ferrite, dielectric constant, ac conductivity, dielectric relaxation, magnetoresistance.
Introduction
Cobalt ferrites are hard ferrite materials because of their excellent chemical stability, mechanical hardness, reasonable saturation magnetization and high magneto crystalline anisotropy [1]. They are now being used in high-density recording media, ferro-fluids, Magnetic Resonance Imaging (MRI), biomedical diagnostics, radio frequency hyperthermia and drug delivery etc. Nanocrystalline cobalt ferrites are also the potential candidates for the fabrication of microwave components, memories, capacitors, and filter design as reported elsewhere in literatures [1-6]. It is of inverse spinel structure where relatively larger oxygen ions (O2-) form cubic closed pack (ccp) lattice. It’s tetrahedral (A) and octahedral (B) sites formed by the oxygen ions (O2-) are occupied by metal ions (Fe3+ and Co2+ ions). A site is occupied by Fe3+ ions and the B site by Fe3+ and Co2+ ions in equal proportionate [7]. Earlier studies show that cobalt ferrites doped with metallic ions have received renewed attention among the researchers to optimize them both for sensor and high frequency applications. These applications are mostly based on their structural, magnetic and electrical properties and their tailoring the substitution level of the dopants, sintering temperature, and their particle size [7]. Accordingly efforts have already been made to substitute Co or Fe by metal ions for changing the structural, magnetic and electrical properties in a controlled manner as reported in various literatures. Cobalt ferrite is a magnetic semiconductor, where Fe2+ and Co2+ ions refer to the n-type and p-type carriers respectively. These carriers are localized and isolated from each other and leading to hoping mechanism of charge transport between metal ions of different valences at crystallographically equivalent lattice points as reported in literature [8]. So, substitution of Mn in cobalt ferrite system both in stoichiometric and non-stoichiometric compositions may have the ability to control Co/Fe ratio and thus may change the electrical properties of the system under the influence of ac field and temperature variation. In the recent past it is reported that the conductivity in Sn substituted CoFe2O4 ferrites is predominantly due to the intrinsic bulk grains at room temperature. However with increasing temperature evolution of grain boundary conduction has been appeared to have occurred [9]. The dielectric dispersion is rapid at lower frequency region and remains almost independent at the higher frequency region. The inclusion of Zn into the CoZnxFe2-xO4 has no pronounced effect on the dielectric constant at higher frequency, but significantly decreases at the lower frequency range as reported earlier [10]. The frequency and temperature dependent dielectric constants indicate that pure CoFe2O4 exhibits two dielectric relaxations in the frequency range of 1–10 kHz while Gd substituted CoFe2O4 compositions exhibit only single relaxation at 1 kHz. The dielectric constant of CoFe2- xGdxO4 is temperature independent up to 5500°C while the dielectric constants increase with the increasing temperature for the temperature T>5500°C. The loss tangent reveals the typical behaviour of a change in relaxation rates in CoFe2-xGdxO4 as reported in literature [11]. Magnetoresistance (MR) which is the change of a material's resistivity with an increasing magnetic field is a well-known phenomenon and an important magnetotransport property to probe the material’s capability to control the electron transport properties in the sensor and spintronics applications. Most of the magnetoresistive devices are built upon ferromagnetic materials though non-magnetic materials also possess the magnetoresistive property. In ferromagnetic metals and alloys, MR effects in the order of 2% are usually obtained in low fields as reported in various literatures. In the recent past a change of even 99.9% in resistivity have already been discovered in the perovskite system Lal-xCaxMnO3, which is termed as the "colossal" magnetoresistance. However, investigations on the above focused aspect of manganese doped cobalt ferrite nanoparticles have been rarely reported .We report in this paper the structural, temperature and the frequency dependent electrical properties, and the magnetoresistance of manganese doped cobalt ferrite nanoparticles, which may open up a new window in the field of sensor, actuator, switching and in dielectric applications.
Experimental
The samples have been prepared by conventional solid state
reaction route using the planetary ball milling technique. Three
different series of samples Co1+xMnxFe2O4(CMF), CoMnxFe2-
xO4 (CFM) and Co1+xMnxFe2-xO4(CFMZ) were synthesized
with x=0.125 for all three series of samples. The powder of
Co2O3, MnO2 and Fe2O3 were mixed in desired proportion
and hand milled for 2 h before calcination. The hand mixed
powders are calcined at 550 C prior to ball milling for 12 h.
The calcined powders of these samples have been analyzed
for their structural properties and for scaling the particle
size distribution using X-ray diffraction and Field Emission
Scanning Electron microscopy (FESEM). The EDS spectrum
was used to confirm the presence of compositional elements
in each sample. The sample powders were then pelletized to
disc shape and sintered at 750 C for 1 h. These pellets were
then used to measure the dielectric properties, dc resistance
and impedance in a Waynekerr 6500B Impedance analyzer
coupled to oven with the PID regulator for accurate temperature
dependence analysis. AC resistivity (ρac) was calculated using the conventional formula using the geometrical parameters of
each sample. The temperature dependent measurements of ac
magnetic permeability and permittivity were done at frequencies
100 Hz, 1 kHz, 10 kHz, 100 kHz and at 1 MHz . The dielectric
loss factor tanδ was calculated from the measured values of
real (ε') and imaginary (ε'') parts of dielectric constant. The
ac conductivity was calculated by using the formula σac=2πfε0 ε'tanδ [12]. The current vs voltage (I-V) measurements were
done using a conventional 4 point -probe method to analyze
the magnetoresistance and field dependent dc resistivity for the
sample series CFMZ system having composition Co1+xMnx Fe2-
xO4. The magnetoresistance was calculated using the formula 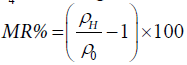 , where ρ0 is the calculated resistivity in
absence of the magnetic field and ρH is the magnetoresistance
in presence of the magnetic field. For the measurements of ac
permittivity as a function of frequency and also temperature,
the samples are clamped between the electrodes. Proper care
was taken so that no entrapped air is present in between the
electrodes and the material samples. For the measurements of
ac permittivity as a function of temperature, the samples are
clamped in a specific sample holder designed for the temperature
dependent properties measurements. The temperature of the
samples are accurately controlled using a PID controlled oven
and a temperature controller.
, where ρ0 is the calculated resistivity in
absence of the magnetic field and ρH is the magnetoresistance
in presence of the magnetic field. For the measurements of ac
permittivity as a function of frequency and also temperature,
the samples are clamped between the electrodes. Proper care
was taken so that no entrapped air is present in between the
electrodes and the material samples. For the measurements of
ac permittivity as a function of temperature, the samples are
clamped in a specific sample holder designed for the temperature
dependent properties measurements. The temperature of the
samples are accurately controlled using a PID controlled oven
and a temperature controller.
Results and Discussion
Structural properties
X-Ray Diffraction (XRD): Figure 1 shows the X-Ray
Diffraction (XRD) patterns of the studied samples. All three
figures confirm the cubic spinel structures of the samples. The
similar pattern is observed for all the three systems such as CMF,
CFM and CFMZ however their Full Width Half Maximum
(FWHM) values differ as determined by the software (match 3),
which is listed in the list of structural parameters. The peak at 30°,
35°, 37°, 43°, 54°, 57° and 62° corresponds to the crystal planes
(220), (511), (222), (400), (422), (511) and (400) respectively.
The presence of these planes in the patterns confirms the cubic
spinel structure of all the samples along with residual oxide
phases as reported in the literature [7]. The other prominent
peaks in the patterns at 26°, 41°, 49° and 64° corresponds to the
Fe2O3 (hematite) phase, which may have originated from the
low calcination temperature (550°C < 800°C) as explained in the literature [12]. The average crystallite size (D) of all the samples
has been calculated from the corresponding highest peaks using
the Scherrer’s formula [13]. The Stanley’s equations have been
used to evaluate tetrahedral and octahedral hoping and bond
lengths using the calculated lattice constants for all the samples.
Besides the X-ray density (px) and porosity of the samples have
been calculated using  and
and respectively. All
the structural parameters of the studied samples are listed in the Table 1. The values of the structural parameters are in agreement
with the literature values as reported in literature [7].
respectively. All
the structural parameters of the studied samples are listed in the Table 1. The values of the structural parameters are in agreement
with the literature values as reported in literature [7].

Figure 1: XRD Pattern for (a) Co0.875Mn0.125Fe2O4 (CMF) (b) CoMn0.125Fe1.875O4 (CFM) and (c) Co1.125Mn0.125Fe1.875O4 (CFMZ).
| Parameters | Co0.875Mn0.125Fe2O4 Co/Fe = 0.44 | CoMn0.125Fe1.875O4 Co/Fe = 0.53 | Co1.125Mn0.125Fe1.875O4 Co/Fe = 0.60 |
|---|---|---|---|
| Crstallite size: | 15.12 nm | 16.71 nm | 19.83 nm |
| Lattice Constant, | 8.401 Å | 8.402 Å | 8.436 Å |
| Tetrahedral hopping length, | 3.637 Å | 3.638 Å | 3.653 Å |
| Octahedra hopping length | 2.970 Å | 2.971 Å | 2.983 Å |
| Tetrahedral Bond length, | 1.819 Å | 1.819 Å | 1.827 Å |
| Octahedral bond length, | 2.100 Å | 2.100 Å | 2.109 Å |
| X-ray density, | 5.072 g/cm3 | 5.071 g/cm3 | 5.009 g/cm3 |
| Porosity | 8.989% | 9.073% | 8.277% |
| Strain | 0.0075 | 0.0068 | 0.0058 |
Table 1: Estimated Structural parameters
From Table 1 it is observed that the crystallite size, lattice constant, tetrahedral and octahedral hoping and bond lengths increase from one system to other having the same amount of Mn content (x=0.125) in the sample. The reason for increasing the aforesaid parameters is attributed to the increase in ionic radii. In the CMF system the larger Mn2+(0.83 Å) replaces comparatively smaller Co2+(0.78 Å) ions whereas in CFM system it replaces further smaller Fe2+(0.49 Å) ions [13] resulting in decrease in the lattice constants of CFM from CMF system. The combined effects of ionic radii of Co2+ and the replacement of Fe2+ by Mn2+ ions due to non-stoichiometric composition can be attributed to the increase of the aforesaid parameters in CFMZ system. The X-ray density is found to decrease and maintains the as usual inverse relationship with the lattice constant. The decreasing trend of strain can be ascribed to the increasing crystallite sizes of all the studied systems.
Field Emission Scanning Electron Microscopy (FESEM):
Figure 2 shows the Field Emission Scanning Electron (FESEM) micrographs along with corresponding distribution histograms of the samples of three systems namely CMF, CFM and CFMZ. The micrographs exhibit randomly agglomerated particles of nearly spherical shaped particles with average sizes 6.88 nm, 14.70 nm and 16.79 nm as estimated from the histograms of CMF, CFM and CFMZ systems respectively. It also indicates that the particle size increases as determined from the XRD patterns and is attributed to the larger ionic radii of Co2+ compared to Fe2+ ions with the increasing Co/Fe ratio (Table 1) at fixed Mn (x=0.125) concentration. The EDS spectrum indicates the presence of Co, Mn, Fe and O in all three systems of samples. The EDS graph also indicates that the NPs are free from any impurity elements.

Figure 2: FESEM micrographs, histograms and EDS spectrums for Co0.875Mn0.125Fe2O4 (b) CoMn0.125Fe1.875O4 (CFM) and (c) Co1.125Mn0.125Fe1.875O4
Electrical properties
Frequency dependent properties: In an ac field, the dielectric constant becomes a complex quantity and is given by ε=ε'-jε'' where ε' is the real part which represents the stored energy, and ε'' is the imaginary part which corresponds to the dissipated energy [14]. The dielectric properties of ferrite materials are influenced by many factors like fabrication method, structural homogeneity, cation distribution, grain size, density, porosity, history of sintering, etc. [15,16]. Figure 3 shows the graphs for the real part (ε'), imaginary part (ε'') and the loss factor tanδ of dielectric constant, and ac resistivity (ρac) as a function of frequency at Room Temperature (RT) in logarithmic scale for the three compositions CMF, CFM and CFMZ systems while the Mn content remains constant at 0.125 (i.e. x=0.125). Both the real part (ε') and imaginary part (ε'') of dielectric constant as shown in Figure 3 (a) and (b) exhibit the normal behaviour up to 0.1 MHz. This behavior of dielectric constant with the frequency can be explained on the basis of Maxwell Wagner polarization model, which states that the conductivity and dielectric properties have the common origin of charge carriers and hoping between Fe2+ and Fe3+ions [17]. At lower frequencies, the hoping frequency of charge carriers follows the applied field, which results in the increase of the dielectric constant. However at higher frequencies, the hoping frequency of charge carriers lags behind the applied field and hence the dielectric constant decreases due to the random dipolar orientations [18]. The dispersion of ε' as shown in Figure 3 (a) between 1 MHz and 10 MHz demonstrates anomalous behavior because of the change of space charge polarization to ionic polarization across the grain boundaries due to the presence of ferrous ions in the B site as explained in the literature [7]. The peak at 1 MHz in the dispersion of ε'' as shown in Figure 3 (b) indicates the resonance condition which implies the faster electron hoping between ferric and ferrous ions in the B site. The variation of tanδ with the increase of frequency as shown in Figure 3 (c) demonstrates the anomalous dielectric behavior for all the systems because of the dielectric relaxation peaks. This behavior can be explained by Rezlescu model, which states that the relaxation peaks may be produced due to collected contribution of p-type (Co2+) and n-type (Fe2+) charge carriers and small polarons, originated from the large coupling constant and narrow conduction band [17]. The pronounced leftward shift of relaxation peaks in the dispersion of tanδ as shown in Figures 3 (c) is observed while the Co/Fe ratio is 0.6, which may arise from the larger concentration of p-type (Co2+) carriers in the B site due to their slower mobility [5, 7]. From the Figure 3 (d) the ac resistivity (ρac) is found to decrease with frequency almost exponentially for all the systems. This behavior of ρac for NPs can also be explained on the basis of Maxwell-Wagner interfacial polarization and is in agreement with Koop’s phenomenological theory [19,20],which suggested that the ferrite compact acts as multilayer capacitors and also the grain and grain boundaries have accounted for possessing different properties. The effect of multilayer capacitors increases with the increase of frequency leading to cause this decrease in ρac as explained in the literature [18]. At low frequency i.e. below 0.001 MHz, ρac is found to be significantly higher for the CFMZ system compared to other two systems. This behaviour is attributed to the higher Co/Fe ratio arising from the replacement of Fe2+ by Mn2+ in the B site. The ac resistivity of CMF system is found to be higher compared to that of CFM system below the frequency 0.01 MHz due to slower mobility of Co2+ (p type carriers) ions in the B site. However, above frequency 0.01, the difference in ρ ac is negligibly low for all the systems and finally become constant and leading it to be independent of frequency.

Figure 3: Graphs for (a) Real part, ε' , (b) Imaginary part, ε'', (c) tan δ loss of dielectric constant (d) ac resistivity (ρ_ac)as a function of frequency.
Temperature dependent properties: The temperature dependence of dielectric constant at selected frequencies is illustrated in Figure 2 for the CFMZ system while x=0.125 in the temperature range 40°C – 120°C. At lower temperature, both the real (ε') and imaginary (ε'') parts of dielectric constant are found to increase for the frequencies 100 Hz, 1 kHz and 10 kHz but it is almost independent at 100 kHz and 1 MHz as seen from Figures 4 (a) and (b). At higher temperature both of them are found to decrease from different peak (temperature) points at 100 Hz, 1 kHz and 10 kHz. This nature of variation of dielectric constant is contrary to the previous results of indium substituted cobalt ferrite as reported in literature [21] and therefore unique and significant. At low but above room temperature, the initial increase of dielectric constant is likely to be originated from the additional contributions of interfacial and dipolar polarization, strongly temperature dependent, due to larger concentration of p-type (Co2+) carriers in the B site because of non-stoichiometric composition. At higher temperature, the thermal energy, supplied by the temperature boosts the mobility of charge carriers that enhances the hoping rate between A and B site and causing to reduce the interfacial polarization across the grain boundary. This phenomenon decreases the dielectric constant at higher temperature. The constancy in dielectric constant for the frequencies 100 kHz and 1 MHz is due to only presence of ionic and electronic mechanisms of polarization, which are completely independent of temperature. The decrease of dielectric constant with frequency can be ascribed to the four mechanisms of polarization. At higher frequency, only electronic contribution is present in dielectric constant whereas at lower frequencies other three mechanisms contribute to the rapid increase of dielectric constant as explained in literature [7,14].

Figure 4: Graphs for (a) Real part, ε'and (b) Imaginary part, ε'' of dielectric constant as a function of temperature of CFMZ with Mn = 0.125.
Figure 5 shows the variation of dielectric constant as a function of temperature (40° – 120°C) of the CFM system where x=0.125 for selective frequencies as mentioned above. The temperature dependence of dielectric constant at 100 kHz and 1 MHz is found to be similar in nature to that of the CFMZ system for the same reason as explained above. However, the variation in dielectric constant with temperature at 100 Hz is found to be dissimilar to that of CFMZ system and previously reported results of indium substituted cobalt ferrite [14]. The decreasing trend of dielectric constant at 100 Hz may be a result of transformation of interfacial polarization to ionic polarization due to hoping of charges between Co2+ and Fe2+ ions in the B site at the lower temperature. At higher temperature, the increase in dielectric constant isexpected to be originated from the enhanced hoping rate resulted from the boosted mobility of charge carriers by the extra thermal energy from the higher temperature as explained in the case of indium substituted cobalt ferrite as reported in the literature [14]. But the variation of dielectric constant at 1 kHz is found to be similar to that of CFMZ system up to 100°C, afterwards it exhibits anomalous behavior. From Figure 5 (b), it is observed that the nature of variation of ε'' is almost similar to that of ε' up to 90°C at 100 Hz, but its negative region implies the change of polarization direction due to increase of Co2+/Fe2+ ratio for the substitution of Mn2+ in the B site. The increase in dielectric constant at 10 kHz and 1 MHz as seen from Figures 5 (a) and (b) is expected to cause from the only presence of electronic polarization, which is independent of temperature. The relaxation time (τ) was calculated from the peaks of ε' of dielectric constant from ε' vs.T curves as shown in Figures 4 (a) (CFMZ) and 5 (a) (CFM) using the values of ε''of dielectric constant at corresponding temperature from ε'' vs.T curves as shown in Figures 4 (b) (CFMZ) and 5 (b) (CFM) at selected frequencies by the equation ωε'' τ= ε'(ω), modified from the Debye formula [22] since ε'∞~0 and listed in Table 2:

Figure 5: Graphs for (a) Real part, ε' and (b) Imaginary part, ε'' of dielectric constant as a function of temperature of CFM with Mn = 0.125.
| System/Frequency | 100 Hz | 1 KHz | 10 KHz | 100 KHz | 1 MHz |
|---|---|---|---|---|---|
| CFMZ System : Co1.125 Mn0.125 Fe1.875 O4 | 30.28 ms | 6.70 ms | 1.74 ms | 0.47 ms | 0.19 ms |
| CFM System : CoMn0.125 Fe1.875 O4 | 123.57 ms | 8.52 ms | 2.01 ms | 0.08 ms | 0.01 ms |
Table 2: Relaxation time constant (τ)
From Table 2, it is seen that for both the system, the relaxation time (τ) decreases with the increase of frequency, which is normal and further confirmation of dielectric behavior of the systems.
Figure 6 shows the ac resistivity (ρac) of both the CFM and CFMZ systems with Mn content (x= 0.125) at selected frequencies in the temperature range 40°C–120°C. The ac resistivity (ρac) is found to decrease with the increase of temperature at all the selected frequencies for CFM system as shown in Figure 4 (a) and at selected frequencies 100 Hz, 1 kHz and 10 kHz for CFMZ system as shown in Figure 6 (b). This decrease of ρac exhibits the semiconductor behavior whereas the same of CFMZ system is found to increase with temperature at 100 kHz and 1 MHz as shown in Figure 6 (c), which implies the insulator behavior and displaying a signature of second order phase transition from ferri- to para- phase. The decrease in ρac with temperature as usually can be attributed to the thermally activated increased mobility of charge carriers that results in more transfer of electrons from one ion to another as explained in literature [14]. However the increase in ρac with temperature for CFMZ system at 100 kHz and 1 MHz is expected to cause from the slower mobility of greater concentration of Co2+ ions (p-type carriers) in the B site due to its non-stoichiometry. These p-type carriers could not follow the ac field variation at higher frequencies (100 kHz and 1 MHz) and ultimately results in Warburg impedance in the grain boundaries due to accumulation of charge carriers across the grain boundaries. These accumulated charge carriers prohibit the charge transportation by hoping mechanism and thus causes the increase of ρac.

Figure 6: log (ρ_ac) vs. 1000/T graphs of (a) CFM system and (b) CFMZ system for Mn content (x = 0.125) (c) CFMZ system at 100 kHz and 1 MHz.
Figure 7 shows the variation of ac conductivity (σac) as a function of temperature of both the CMF and CFMZ systems in the temperature range 40°C–120°C at selected frequencies. It is known that the ac conductivity of dielectric materials is the summation of two terms and related by the equation σac= σ0(T)+σ(ω,T),where the first term σ0(T) corresponds to the dc component i.e. independent of frequency, which is related to the drifting of charge carriers and follows the Arrhenius relation but the second term σ (ω,T) is frequency dependent and related to the dielectric relaxation caused by the localized electric charge carriers. The nature of variation of σac with temperature for the CFM systemat all selected frequencies as shown in Figure 7 (a) is almost exponential and similar to that of indium doped cobalt ferrite nanoparticles as reported in the literature [14], which may be ascribed to the enhanced hoping of charges due to the increased mobility of charge carriers across the grain boundaries. The variation of σac for the CFMZ system is almost linear with temperature at 100 Hz, 1 kHz and 10 kHz as shown in Figure 7 (b), which is significant but not in consistent with the previous reported results [17]. This nature of variation in σac may be attributed to the concurrent contribution of both the n-type (Fe2+/Fe3+) and p-type (Co2+/Co3+) charge carriers accumulated across the grain boundaries in their hoping mechanism for ionic redistribution by thermal agitation due to its non-stoichiometry. The decrease in σac with temperature is noticed at 100 kHz and 1 MHz as shown in Figure 7 (c), which corresponds to the increase in ρac The reason of this nature of variation in σac is similar to the increase in ρac as discussed above.

Figure 7: σ_ac vs. T graphs of (a) CFM system and (b) CFZM system at 100 Hz, 1 kHz and 10 kHz (c) CFMZ system at 100 kHz and 1 MHz.
Magnetoresistance
Figure 8 shows the nature of variation of magnetoresistance
(MR), normalized resistivity  and the rate of change of
resistivity
and the rate of change of
resistivity  as a function of magnetic field (H) of CFMZ
system for transverse and parallel field direction to the current
respectively at RT. In both the direction, negative MR is
obtained and found to increase with the increase of magnetic
field as shown in Figure 8 (a).This nature of variation in MR is found to exhibit the normal behaviour and almost in agreement
with the previous reported results of this kind of materials. The
negative value of MR entails the dominance of n-type carriers
i.e. Fe2+ ions in the hoping process of this system. This fact
is confirmed from the decrease of normalized resistivity with
the increase of magnetic field as show in Figure 8 (b), which
may be ascribed to the weakening of spin-orbit coupling under
the influence of externally applied magnetic field. However,
the observed large value of negative MR, compared to other
such ferromagnetic materials is expected to arise from the
spin-dependent electron scattering due to the field induced
change of the canting angle of manganese spins for inherent
antiferromagnetic effect of Mn2+ in the B site [23]. Besides, the
marked difference in MR is observed between the transverse
and parallel directions to the current, which can be explained
on the basis of cross section for scattering in the ferromagnetic
materials. If the field and magnetization are oriented transverse
to the current, then the electronic orbits are in the plane of the
current, and there is a small cross-section for scattering, giving a
low resistance state. Conversely for fields applied parallel to the
current, the electronic orbits are oriented perpendicular to the
current, and the cross-section for scattering is increased, giving
a high resistance state [24]. Furthermore, the rate of change of
resistivity is found to decrease almost exponentially with the increase of the applied magnetic field as shown in Figure 8 (c) that is expected to cause from the combined effects of the faster
hoping of Fe2+ ions (n-type carriers) across the grain boundaries
and the higher mobility of n-type carriers. The higher rate of
change of resistivity in the low field region may make this
CFMZ system more suitable to be used in the field of position
sensor and biosensor applications.
as a function of magnetic field (H) of CFMZ
system for transverse and parallel field direction to the current
respectively at RT. In both the direction, negative MR is
obtained and found to increase with the increase of magnetic
field as shown in Figure 8 (a).This nature of variation in MR is found to exhibit the normal behaviour and almost in agreement
with the previous reported results of this kind of materials. The
negative value of MR entails the dominance of n-type carriers
i.e. Fe2+ ions in the hoping process of this system. This fact
is confirmed from the decrease of normalized resistivity with
the increase of magnetic field as show in Figure 8 (b), which
may be ascribed to the weakening of spin-orbit coupling under
the influence of externally applied magnetic field. However,
the observed large value of negative MR, compared to other
such ferromagnetic materials is expected to arise from the
spin-dependent electron scattering due to the field induced
change of the canting angle of manganese spins for inherent
antiferromagnetic effect of Mn2+ in the B site [23]. Besides, the
marked difference in MR is observed between the transverse
and parallel directions to the current, which can be explained
on the basis of cross section for scattering in the ferromagnetic
materials. If the field and magnetization are oriented transverse
to the current, then the electronic orbits are in the plane of the
current, and there is a small cross-section for scattering, giving a
low resistance state. Conversely for fields applied parallel to the
current, the electronic orbits are oriented perpendicular to the
current, and the cross-section for scattering is increased, giving
a high resistance state [24]. Furthermore, the rate of change of
resistivity is found to decrease almost exponentially with the increase of the applied magnetic field as shown in Figure 8 (c) that is expected to cause from the combined effects of the faster
hoping of Fe2+ ions (n-type carriers) across the grain boundaries
and the higher mobility of n-type carriers. The higher rate of
change of resistivity in the low field region may make this
CFMZ system more suitable to be used in the field of position
sensor and biosensor applications.

Figure 8: Graphs (a) Magnetoresistance (MR %) (b) Normalized resistivity (ρ_H/ρ_0 ) as a function of magnetic field for CFMZ system with Mn(x) = 0.125 (c) combined effects of the faster hoping of Fe2+ ions (n-type carriers) across the grain boundaries and the higher mobility of n-type carriers
Conclusion
Nanoparticles of three systems, CMF, CFM and CFMZ with Mn=0.125 of manganese doped cobalt ferrite nanoparticles have been synthesized via standard solid state reaction route using the planetary ball milling technique. The existence of peaks in the XRD patterns of the 3 systems of samples confirms the formation of spinel structure. The dielectric constants show interesting relaxation behavior over certain frequency band which could be attributed to the influence of an antiferromagnetic dopant in a ferri-magnetic solute. The other measured parameters e.g., the Resistance (R) and Impedance (Z) also support the dielectric relaxation behavior of the samples in the frequency range 100 Hz to 120 MHz and temperature range 40°C–120°C. The increase of lattice constant from one compositional system to the other system with Mn content 0.125 is observed due to the effect of larger ionic radii. The average particle size is estimated to be 6.88 nm, 14.70 nm and 16.79 nm for CMF, CFM and CFMZ systems respectively from FESEM. The EDS spectrum confirms the existence of constituents with no traceable impurities. The variation of tanδ with the increasing frequency demonstrates the anomalous dielectric behavior for all the systems because of the dielectric relaxation peaks. This behaviour expected to be originated from the collective contributions from p-type and n-type charge carriers along with small polarons due to large coupling constant and narrow conduction band. The pronounced leftward shift of relaxation frequency in the dispersion of tanδ is attributed to the larger concentration of p-type (Co2+) carriers in the B site due to their slower mobility. The relaxation peaks in the dispersion of tan δ corresponds to the dissipation of energy and released as heat, which may be used in dielectric heating applications. At lower frequency i.e. below 1 kHz, the ac resistivity (ρac)is found to be significantly higher for the CFMZ system compared to other two (CFM and CMF) systems. This behavior is attributed to the higher Co/Fe due to the replacement of Fe2+ by Mn2+ in the B site. At higher temperature both the real (ε’) and imaginary (ε”) parts of dielectric constant of CFMZ system is found to decrease from different peak (temperature) points at the selected frequencies 100 Hz, 1 kHz and 10 kHz, which is unique in this case and is assumed to be the signature of ferri- to para- phase transition. The relaxation time constant (τ) is found to be maximum at 100 Hz and minimum at 1 MHz for CFM system as compared to that of CFMZ system from Table 1. The decreasing trend of τ with frequency is typical of frequency dependent dielectric behavior of the studied systems. Both the system exhibits semiconductor behaviour at the selected frequencies 100 Hz, 1 kHz and 10 kHz but show insulator behavior at higher frequency regime 100 kHz-1 MHz. Materials with this kind of frequency response are suitable for switching and actuator applications. Also, the higher rate of change of resistivity in the lower field region which is thought to have originated from the combined effects of faster hoping of Fe2+ ions and their higher mobility might make the CFMZ system suitable for position sensor and biosensor applications.
Acknowledgement
The authors are thankful to the International Science Programs (ISP), Uppsala University, Sweden for financial and technical support. The authors are also thankful to the Department of Glass and Ceramics Engineering (GCE), Bangladesh University of Engineering and Technology (BUET), and to the Department of Physics, Military Institute of Science and Technology (MIST) for their experimental support.
References
- Waje SB, Hashim M, Ismail I. Effects of sintering temperature on grain growth and the complex permeability of Co0.2Ni0.3Zn0.5Fe2O4 material prepared using mechanically alloyed nanoparticles. J Magn Magn Mater. 2011;323(11):1433-9.
- Ahmed R, Gul IH, Zarar M, et al. Improved Electrical Properties of Cadmium Substituted Cobalt Ferrites Nanoparticles for Microwave Application. J Magn Magn Mater. 2016;405:28-35.
- Kolekar YD, Sanchez L, Rubio EJ, et al. Grain and grain boundary effects on the frequency and temperature dependent dielectric properties of cobalt ferrite–hafnium composites. Solid State Commun. 2014;184:34-9.
- Shivakumar N, Narayanasamy A, Chinnasamy CN, et al. Influence of thermal annealing on the dielectric properties and electrical relaxation behaviour in nanostructured CoFe2O4 ferrite. J Phys Condens Matter. 2007;19:386201.
- Ponpandian N, Balaya P, Narayanasamy A. Electrical conductivity and dielectric behaviour of nanocrystalline NiFe2O4 spinel. J Phys Condens Matter. 2002;14:3221–37.
- Singh JP, Kumar H, Singhal A, et al. Solubility limit, magnetic interaction and conduction mechanism in rare earth doped spinel ferrite. Applied Science Letters. 2016;2(1):03-11.
- Ahsan MZ, Khan FA. Study of Structural, Electrical and Magnetic Properties of Manganese Doped Cobalt Ferrite Nanoparticles with Non-stoichiometric Composition. Journal of Physical Science and Application. 2017;7(6):30-7.
- Verwey EJW, Boer JH. Surface oxide films. Journal of the Royal Netherlands Chemical Society 1936;55(8):675-87.
- Ugendar K, Vaithyanathan V, Patro LN, et al. Temperaturedependent magnetization, anisotropy and conductivity of CoFe2−xSnxO4 (x = 0.025, 0.05, 0.075): appearance of grain boundary conductivity at high temperatures. J Phys D Appl Phys. 2016;49:305001.
- Khan A, Alam M, Al-Quaderi GD, et al. Dielectric and Transport Properties of Zn-Substituted Cobalt Ferrites. J Bangladesh Acad Sci. 2013;37(1):73-82.
- Rahman MT, Vargas M, Ramana CV. Structural characteristics, electrical conduction and dielectric properties of gadolinium substituted cobalt ferrite. J Alloy compd. 2014;617:547–62.
- Yadav RS, Kuřitka I, Vilcakova J, et al. Impact of grain size and structural changes on magnetic, dielectric, electrical, impedance and modulus spectroscopic characteristics of CoFe2O4 nanoparticles synthesized by honey mediated solgel combustion method. Advances in Natural Sciences: Nanoscience and Nanotechnology. 2017;8:045002.
- Yadav SP, Shinde SS, Kadam AA, et al. Structural, morphological, dielectrical and magnetic properties of Mn substituted cobalt ferrite. Journal of Semiconductor. 2013;34:093002.
- Nongjai R, Khan S, Asokan K, et al. Magnetic and electrical properties of In doped cobalt ferrite nanoparticles. J Appl Phys. 2012;112:084321.
- Shirsath SE, Toksha BG, Jadhav KM. Structural and magnetic properties of In3+ substituted NiFe2O4. Mater Chem Phys. 2009;117:163.
- George M, Nair SS, John AM, et al. Structural, magnetic and electrical properties of the sol-gel prepared Li0.5Fe2.5O4 fine particles. J Phys D Appl Phys. 2006;39:900.
- Kambale RC, Shaikh PA, Bhosale CH, et al. The effect of Mn substitution on the magnetic and dielectric properties of cobalt ferrite synthesized by an auto combustion route. Smart Mater Struct. 2009;18:115028.
- Jonker GH. Analysis of the semiconducting properties of cobalt ferrite. J Phys Chem Solids. 1959;9:165.
- Rezlescu N, Rezlescu E. Dielectric properties of copper containing ferrites. Phys Status Solidi A. 1974;23(2):575.
- Koop’s CG. On the Dispersion of Resistivity and Dielectric Constant of Some Semiconductors at Audio frequencies. Phys Rev. 1951;83(1):121–4.
- Nlebedim IC, Melikhov Y, Jiles DC. Temperature dependence of magnetic properties of heat treated cobalt ferrite J Appl Phys. 2014;15:043903.
- Maxwell JC. Electricity and Magnetism. Oxford University Press, UK. 1973.
- Chahara K, Ohno T, Kasai M. Magnetoresistance in magnetic manganese oxide with intrinsic antiferromagnetic spin structure. Applied Physics Letter. 1993;63:1990.
- Nickel J. Magnetoresistance Overview. Computer Peripherals Laboratory HPL-95-60. 1995.