Research Article - Biomedical Research (2017) Volume 28, Issue 13
Stratified classification of plant species based on venation state
Bong Mei Fern1, Mohd Shafry Mohd Rahim1*, Tanzila Saba2, Abdulaziz S. Almazyad3 and Amjad Rehman31MaGIC-X UTM-IRDA Digital Media Centre, Universiti Teknologi Malaysia, Skudai, Johor, Malaysia
2College of Computer and Information Sciences Prince Sultan University, Riyadh, Saudi Arabia
3College of Computer and Information Systems Al-Yamamah University, Riyadh, Saudi Arabia
- *Corresponding Author:
- Mohd Shafry Mohd Rahim
MaGIC-X UTM-IRDA Digital Media Centre
Universiti Teknologi Malaysia, Malaysia
Accepted date: May 8, 2017
Abstract
This paper presents a novel approach for classifying leaf based on its five types of venation: palmate, parallel, pinnate, uninervous and reticulate. This novel approach is called Binary Directional Pattern (BiDirP); it outperforms traditional Edge Orientation Histogram (EOH) because it reduces the influence of outlier data or noise if the summation of distance in histogram method is used. Besides that, BiDirP index is closer to human perspective and easily categorizes leaves into their venation state as simply as matching their BiDirP index based on their BiDirP venation range. This method is less time consuming as it does not require powerful classifiers that train for longer time in order to get better performance. Overall, BiDirP outperforms the EOH by 11.48% in accuracy; for BiDirP, percentage accuracy of venation classification is 96.02% while it is 84.54% for EOH.
Keywords
Leaf recognition, Binary directional pattern, Leaf venatio, Edge orientation histogram, Canny edge detection.
Introduction
Leaf veins are hierarchical fine lines of different sizes and patterns found on the surface of the leaf [1-3]. They consist of vascular bundles made of two main transport tissues: xylem and phloem. The arrangements of leaf veins configure a unique and intricate pattern called leaf venation [4,5]. Leaf venation is an important feature for botanists and taxonomists to identify and catalogue a plant species. Leaf venation feature can become a more important key when the plant species is differentiated with similar leaf shape and has similar related characteristics [6-8]. For example, the delimitations of the genera Shorea and Hopea are supported by leaf venation where both of them are from the family Dipterocarpaceae. Besides that, leaf venation features are used to differentiate plant species from the same genus too, like Xanthoceroideae and Lepisanthes sensu lato which are from the genera Sapindaceae [9]. Also, the pattern of leaf veins gives important information to other fields such as hydraulic efficiency [10,11], theoretical modelling [12], phylogenetic relationship among plant species [13] and pharmacological approaches [14].
In this research, we used stratified sampling to cluster the population of plant species into homogeneous subgroup. Herein, we stratumed (sub-population) the leaf species by clustering them based on their lobes, shape, apixal, basal, margin and venation. However, we presented the clustering method based on their vein order types, which are: parallel, pinnate, palmate, uninervous and reticulate venations. The advantages of using stratified sampling are: (i) it reduces the search space, lowers computation and requires less memory capacity for finding a leaf species from a large population; (ii) it reduces the variability in enquiry search space which is able to produce more precise recognition; (iii) minimizes execution time and reduces time for recognizing a leaf species in subpopulation or smaller homogeneous sub-group; (iv) is more systematic.
There are some research findings on leaf are based on its density, the angle between veinlet, the thickness or diameter of veinlet and the number of veinlet [15]. These measurements can be easily affected by many other factors, for example the thickness or diameter of veinlet and the number of veinlet can be influenced by the age of leaf. The density of leaf venation is influenced by the resolution of image and the venation detection methods, so the extracted features are unstable and unreliable. However, in this research, Binary Directional Pattern (BiDirP) which is based on the botanical knowledge is utilized. This method is more human perspective and able to divide the leaf into sub-group which can reduces the searching space to match the query image with the sample leaf collected in database. The propose method is also advantageous when it comes to unclear leaf venation.
Materials and Methods
Dataset
In this research, we used Flavia dataset to evaluate our algorithm performance. Flavia dataset encompasses 32 plant species with total leaf samples of 1907 which include 5 general venation states namely, pinnate, palmate, reticulate, parallel and uninervous. The leaf samples are either scanned or photographed, which the author did not state clearly in his article [15]. However, the samples are prepared in 1600 × 1200 resolution, which is considered as low for capturing the information of leaf venation, as the colour contrast of leaf vein and leaf tissue is considered not significant. Therefore, it is a challenging task to extract the information of leaf venation network.
Vein feature extraction
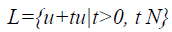
To localize the edge direction efficiently, the lines extracted from pre-processing B are further divided into smaller segmented line called L. In this research, every line segment is bounded by two distinct end points with ten continuous pixels linked between start point Pstart and end point Pend. L is a subset of B, L B and L is a line segment, parameterized as Equation 1. The parameters t should be a natural number which is a whole number; that is, a positive number but excluded zero, in this situation, the t value is 10.
 →(1)
→(1)
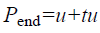
The parameter u represents the starting point; Pstart of line segment and u+tu represents the end point Pend of line segment. The above statement is presented as Equations 2 and 3.
 →(2)
→(2)
 →(3)
→(3)
In this case, line segment was assumed as the hypotenuse of a right triangle as presented in Figure 1. The line ͞A͞B represents the line segment, point A represents the start point of line segment, Pstart and Pend denote the end point of the line segment, Pend. However the dash line ͞A͞C denotes the horizontal distance and the dash line ͞C͞B represents the vertical distance. The angle of the line segment (angleL) can be obtained by using Equation 4.

Figure 1: Line segment acting as hypotenuse of right triangle.
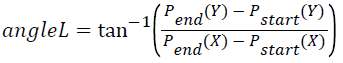 →(4)
→(4)
The directional line segment is basically encoded in eight directions which are Anglei={0º, 45º, 90º, 135º, 180º, 225º, 270º, 315º} or equivalent to Radiani, i={0, π/4, π/2, 3π/4, π, 5π/4, 3π/4, 7π/4}. However, for the line segment which is bent, arbitrary and deviated from being straight line, these are denoted as curve or strands and there are non-directional line segment. In total, the line segment is grouped into nine directional units which are 0º, 45º, 90º, 135º, 180º, 225º, 270º, 315º, curve. The traditional edge histogram excludes the existence of curve. Leaf venation, especially tertiary venation is in strand condition.
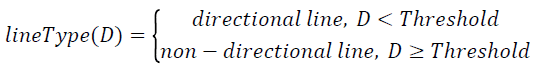
The line segment, which lies along start point Pstart and end point Pend, is called directional line segment. Conversely, the non-directional lines do not lie straight but diverge and deviate. Non-directional lines are then grouped into curve unit. Below is an equation to determine whether the line segments are directional lines or non-directional lines.
 →(5)
→(5)
 →(6)
→(6)
 →(7)
→(7)
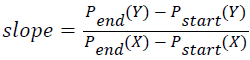
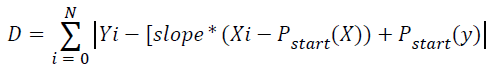
According to Clapham and Nicholson, slope is a statistic which indicates the direction and steepness for a line as presented in Equation 5. Equation 6 computes the total number of each point from line segment that deviated from the straight line with two distinct end points, Pstart and Pend. The parameter N represents the total pixel in line segment and i={1, 2, 3,.., N}. Finally, the total number of deviation, D determines the categorization of line segment either into directional line or non-directional line, according to Equation 7.
The frequency and number of occurrence of each directional unit is computed as presented in a graphical representation called edge histogram. The edge histogram is well described in the distribution of the venation direction. However, this descriptor is ideal with a complicated statistic representation that cannot be interpreted directly from human perceptive and easily influenced by false edge.
Converting them into binary pattern
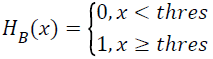
To simplify the Edge Histogram (EOH), we binarized the edge histogram to Binary Edge Histogram (BEH), using thresholding method and finally transformed it into binary directional pattern. In this case, binary directional pattern retains its discriminative power but slightly outperforms the edge histogram as it discards the insignificant outlier or noise. Traditional edge histogram calculates the summation of distance between histogram or uses powerful classifiers to differentiate among them. The former approach may easily be influenced by an outlier data or noise, but with the latter, it takes longer time to learn the dataset. The frequency of each directional unit in edge histogram is equal to 1’s if it is greater or equal to a defined threshold (Threshold). Conversely, if the value is less than the defined threshold, the unit directional is equal to 0’s. Equation 8 converts the edge histogram to binary edge histogram and Table 1 presents the example of conversion between edge histogram and binary edge histogram.
| Angle code | 0 | 1 | 2 | 3 | 4 | 5 | 6 | 7 | 8 |
| Directional unit | 0 | π/4 | π/2 | 3π/4 | π | 5π/4 | 3π/4 | 7π/4 | Non-directional/curve |
| Angle | 337.5 to 22.4 | 22.5 to 67.4 | 67.5 to 112.4 | 112.5 to 157.4 | 157.5 to 202.4 | 202.5 to 247.4 | 247.5 to 292.4 | 292.5 to 337.4 | Non-directional/curve |
| EOH | 11 | 0 | 270 | 0 | 0 | 0 | 0 | 13 | 20 |
| Calculation | 11<Threshold | 0<Threshold | 270>Threshold | 0<Threshold | 0<Threshold | 0<Threshold | 0<Threshold | 13<Threshold | 20<Threshold |
| BEH | 0 | 0 | 1 | 0 | 0 | 0 | 0 | 0 | 0 |
Table 1: The example of conversion between edge histogram and binary edge histogram.
 →(8)
→(8)
The binary edge histogram is then arranged to 3 × 3 square matrix denoted as DP, according to the directional pattern. In which the centre of the matrix located at DP22 represents the non-directional curve. The left uppermost located at DP11 represents 3π/4 or 135º. The right uppermost located at represents the angle of π/4 or 45º and so forth. Below is the equation to get the index of Binary Directional Pattern (BiDirP). Figure 2a displays the angle in circle and Figure 2b depicts the 3 × 3 square matrix of angle code according to its direction. Figure 2c represents the range angle in angle code, angle ± 45/2. Figure 3a displays the arrangement of binary edge histogram based on the angle code in matrix form as presented in Figure 2. Figure 3b presents the binary pattern map in the exponential of two according to the angle code presented in Figure 2. The parameter Dc denotes the total number of column element in matrix and the parameter Dr denotes the total number of row element in matrix.

Figure 2: (a) Angle presented in circle (b) Angle presented in matrix form (c) Angle code presented in matrix form according to its angle or direction.

Figure 3: (a) Arrangement of binary edge histogram in 3 × 3 square matrix and called binary edge matrix, MA (b) Binary pattern map in the exponential of two according to direction, MB.
Matching Method
The result of BiDirP is the summation of multiplication of each element in matrix MA and matrix MB. According to the above example in Figures 2 and 3, the index of BiDirP is 4; which means this leaf species possesses parallel venation. Below are the index of BidirP for other venation types and the calculation of each venation state (Table 2).
| Venation type | Index of BiDirP |
|---|---|
| Parallel | 4 |
| Pinnate | 14 or 224 |
| Palmate | 14 to 255 |
| Reticulate | >256 |
| Uninervous | 0 |
Table 2: The index of BiDirP for each venation state.
Results and Discussion
In this research, we test our novel approach BiDirP with flavia dataset. The average venation classification accuracy for parallel vein using BiDirP and EOH is approximately indifferent at about 95%. BiDirP outperforms EOH with 13.74% for uninervous-veined. For reticulate-veined, BiDirP defeats EOH with 21.83% and achieves 96.98%. The accuracy for discriminate palmate-veined leaves by using EOH is even worse compared to BiDirP. EOH only reaches 61.21% which is 38.34% lower than BiDirP. BiDirP achieves higher classification accuracy which is 91.45 and EOH achieves only 70.59% in pinnate-veined. Uncertain leaf venation either pinnate-veined or reticulate-veined; therefore, both methods are achieved at 100% accuracy. Overall, BiDirP outperforms the EOH by 11.48%, where venation classification percentage for BiDirP is 96.02% and EOH, 84.54%.
Conclusion
This paper has presented a novel approach for leaf venation classification that outperforms a traditional Edge Orientation Histogram in terms of time usage and accuracy percentage. Our algorithm is tested by Flavia dataset of which the sample plant species comprises five basic different venation states namely pinnate, parallel, reticulate, palmate and uninervous. The Stratified Sampling approach divided the plant species into several venation state groups which reduced the searching space when undergoing plant identification. The suggested novel approach named BiDirP has promising result, as an advanced traditional Edge Orientation Histogram with 11.48% accuracy on leaf venation classification. The other leaf part such as leaf margin, apex, base, shape, lobes and sinuses are suggested using Stratified Sampling approach too, as subdivide them into group before undergo numerical analysis can largely reduce the search space to match plant species.
References
- Saba T, Rehman A, Sulong G. An intelligent approach to image denoising. J Theor Appl Info Technol 2012; 17: 32-36.
- Soleimanizadeh S, Mohamad D, Saba T, Rehman A. Recognition of partially occluded objects based on the three different color spaces (RGB, YCbCr, HSV). 3D Res 2015; 6: 1-10.
- Saba T, Rehman A, Sulong G. Improved statistical features for cursive character recognition. Int J Innov Comp Info Contr 2011; 7: 5211-5224.
- Muhsin ZF, Rehman A, Altameem A, Saba A, Uddin M. Improved quadtree image segmentation approach to region information. Imag Sci J 2014; 62: 56-62.
- Saba T, Al-Zahrani S, Rehman A. Expert system for offline clinical guidelines and treatment. Life Sci J 2012; 9: 2639-2658.
- Mundher M, Muhamad D, Rehman A, Saba T, Kausar F. Digital watermarking for images security using discrete slantlet transform. Appl Math Info Sci 2014; 8: 2823-2830.
- Norouzi A, Rahim MSM, Altameem A, Saba T, Rada AE, Rehman A, Uddin M. Medical image segmentation methods, algorithms, and applications. IETE Tech Rev 2014; 31: 199-213.
- Meethongjan K, Dzulkifli M, Rehman A, Altameem A, Saba T. An intelligent fused approach for face recognition. J Intel Sys 2013; 22: 197-212.
- Li-Min C, Zhi-Xin W, Ming C, Jian-Hui L, Qiong L, Nian-He J. Leaf venation and its systematic significance in Sapindaceae of China. Plant Divers Resourc 2014; 419-432.
- Zwieniecki MA, Melcher PJ, Boyce CK, Sack L, Holbrook NM. Hydraulic architecture of leaf venation in Laurus nobilis L. Plant Cell Env 2002; 25: 1445-1450.
- Brodribb TJ, Feild TS, Jordan GJ. Leaf maximum photosynthetic rate and venation are linked by hydraulics. Plant Physiol 2007; 144: 1890-1898.
- Runions A, Fuhrer M, Lane B, Federl P, Rolland-Lagan AG, Prusinkiewicz P. Modeling and visualization of leaf venation patterns. ACM Trans Graphics 2005; 24: 702-711.
- Abere TA, Onwukaeme DN, Eboka CJ. Pharmacognostic evaluation of the leaves of Mitracarpus scaber Zucc (Rubiaceae). Trop J Pharm Res 2007; 6: 849-853.
- Hickey LJ, Wolfe JA. The bases of angiosperm phylogeny: vegetative morphology. Ann Missouri Botanical Garden 1975; 538-589.
- Candela H, Alonso-Peral MM, Ponce MR, Micol JL. Role of HEMIVENATA and the ubiquitin pathway in venation pattern formation. Plant Signal Behav 2007; 2: 258-259.