Research Article - Biomedical Research (2017) Volume 28, Issue 2
Statistical analysis of pulse rate variability quantified through second derivative photoplethysmogram (SDPPG) and its compatibility with electrocardiographic (ECG) heart rate variability
Mohanalakshmi S1,2*, Sivasubramanian A3 and Swarnalatha A41Research Scholar, Anna University, Chennai, India
2Department of Electronics and Communication Engineering, MNM Jain Engineering College, Chennai, India
3School of Electronics Engineering, VIT University, Vandalur, Chennai, India
4Department of Electronics and Communication Engineering, St. Joseph’s college of Engineering, Chennai, India
- *Corresponding Author:
- Mohanalakshmi S
Department of Electronics and Communication Engineering.
MNM Jain Engineering College, India
Accepted on June 11, 2016
Abstract
Heart Rate Variability (HRV) and Pulse Rate Variability (PRV) are non-invasive techniques to assess the function of autonomic nervous system and presently, PRV is considered to be a good alternative to HRV. We investigated a different approach to potentially show that the second derivative of Photoplethysmography signals (SDPPG) can measure PRV with accurate detection of “a” waves through re-sampling technique which normalizes the signal and ensures the presence of “a” waves in all its recurrences. PPG and ECG signals of 28 records, each of 10 second duration that varies from healthy adults to unhealthy and aged patients with different morphologies such as regular and irregular heart rhythms, low and varying amplitudes, obtained from the large-scale openly available database from PhysioNet were employed for the performance evaluation and validation. The performance of “a” wave detection algorithm resulted in 99.75% sensitivity and 100% positive predictivity. In this study, a-a intervals of SDPPG signals and R-R intervals of ECG signals were used to determine PRV and HRV indices such as the standard deviation of heart beat interval (SDNN) and the root-mean square of the difference of successive heart beats (rMSSD). HRV and PRV indices thus obtained from ECG and SDPPG were compared by linear regression analysis. Highly significant correlations were found between PRV indices(r=0.902207) estimated through SDPPG measures and the corresponding HRV indices (r=0.825032), substantiating that PRV can be an alternative for HRV.
Keywords
Performance evaluation, Pulse contour analysis, Zero-crossing points, Cardiovascular disease (CVD), Photoplethysmography (PPG), Second derivative of the PPG signal (SDPPG).
Introduction
Heart rate variability (HRV) refers to the beat-to-beat alterations in heart rate and it provides a measure of the control of heart rate exerted by the autonomic nervous system [1]. Metrics of HRV are widely used in medical diagnostics and physiological research. Abnormal patterns of HRV have been associated with coronary artery disease [2], sudden death or heart failure [3,4]. HRV metrics are usually based on non-invasive measurements of cardiac function using electrocardiography (ECG) or photoplethysmography (PPG). A precise point is identified in each cardiac cycle and inter-beat interval (IBI) between those points in adjacent ECG heartbeats or PPG pulse beats is measured to estimate HRV metrics and pulse rate variability (PRV) respectively. Some researchers have correlated PRV and HRV [5,6] confirmed PRV as a good surrogate of HRV and some directly used PRV as an alternative of HRV [7], though some studies suggested that PRV derived from PPG is not a surrogate for HRV derived from ECG [8].
Heart beat and therefore HRV can be calculated from PPG contour itself, but reliable detection of heart beats is much more challenging owing to various noises and artefacts and hence, an efficient algorithm has to take the above challenges into account. The analysis of PPG waveform was easily quantified by the second derivative of PPG signal (SDPPG) that allowed an easier and accurate interpretation of heart beats by clearly defined peaks than the original PPG signal. In SDPPG analysis, five distinctive waves have been identified for each cardiac cycle (heartbeat) as “a” (early systolic positive wave), “b” (early systolic negative wave), “c” (late systolic re-increasing wave), “d” (late systolic re-decreasing wave) and “e” (early diastolic positive wave), as shown in Figure 1. The a-wave seems to be the most suitable for heart rate calculations because of its amplitude and sharpness.

Figure 1. A schema of the photoplethysmogram (PPG, Top) and the second derivative of the photoplethysmogram (SDPPG, Bottom).The SDPPG consists of 5 waves and each wave is consecutively named 'a', 'b', 'c', 'd', and 'e' wave, respectively.
Taniguchi et al. [9] applied a-a interval of SDPPG to determine heart rate as an alternative to ECG. Mohamed Elgendi et al. [10] detected “a” waves in SDPPG signals, generating blocks of interest followed by a dynamic event duration threshold and utilized a-a intervals for evaluating HRV indices, standard deviation of normal to normal intervals (SDNN) and root mean square of the difference of successive heart beats( rMSSD). The blocks thus formed may be undesirable, if it has noise and there is a probability that points of interest (“a” waves) might be missed, if these blocks are eliminated. Moreover, any change in threshold values would affect the performance of “a” detection algorithm.
The objective of this study was to substantiate that PPG signal can be used as an alternative for ECG in the assessment of HRV through SDPPG. A new SDPPG analysis algorithm for an automatic detection of “a” wave is proposed in this paper as accurate detection of a wave is vital to assess HRV. The algorithm exploits re-sampling technique to ensure “a” waves are present in all its recurrences and does not involve any threshold values, eliminating the setback on the performance of the algorithm, if parameters are altered. The rest of this paper is organized as follows: materials and methods are elucidated in the second section; the third section is dedicated to system evaluation and result analysis; the last one is for concluding remarks.
Materials and Methods
Database used
PPG and ECG signals with different morphologies such as baseline fluctuations, low and varying amplitudes and irregular heart rhythms of 10 seconds duration with a sampling rate of 125 Hz from the openly accessible database (PhysioNet) were experimented for HRV analysis using MATLAB. The database encompasses high resolution physiologic waveforms (such as ECG, blood pressures, plethysmograms, respirations) that were obtained from adult patients, both genders male and female aged between 21 Years and 90 years with various pathologies like Acute myocardial infarction, Acute pulmonary heart disease, Acute respiratory failure, Hypertensive disease etc.
Methodology
HRV estimate by various time domain measures proposed in [11] suggested that HRV can be calculated using the mean standard deviation of the length of the cardiac cycle that are determined either from the RR intervals of a short ECG segment or the a-a intervals of the SDPPG. Peak detection method was adapted to measure ‘a’ peaks in SDPPG to comply with the detection of R peaks in ECG, for subsequent estimation of PRV and HRV respectively. The estimation of HRV involves three major steps: accurate detection of a-waves in SDPPG and R peaks in ECG, computation of a-a intervals and RR intervals and calculation of the PRV and HRV respectively.
Detection of a-waves
The proposed ‘a’ wave detection algorithm consists of three main stages: pre-processing (band pass filtering and second derivative calculation), beat evaluation and resampling and finally, feature extraction (detection of ‘a’ waves) as outlined in Figure 2.

Figure 2. Flowchart of the proposed algorithm for “a” wave detection.
Pre-processing (Band pass filtering and second derivative calculation)
An efficient band pass filter is used to eliminate highfrequency noise that exist above 9 Hz and low-frequency noise which causes baseline wandering that exist up to 0.5 Hz to condition the raw PPG waveforms, as most of the energy is below 9 Hz. Figures 3A and 3B illustrates a raw PPG signal and filtered PPG signal with baseline drift eliminated respectively. The second derivative was applied to the filtered PPG signal using Equation 1 and Figure 3C shows SDPPG of the filtered signal.
SDPPG=PPG (next)-2*PPG (Current) + PPG (Previous) → (1)

Figure 3. The proposed “a” and “R” detection algorithm output (A) Raw unprocessed PPG and ECG signal (B) Filtered PPG signal with baseline drift elimination (C) SDPPG signal (D) SDPPG signal with all its peaks above zero crossing (E) Detected “a” waves on SDPPG signal (F) Detected R peaks on ECG signal.
Beat evaluation and signal resampling
ECG signals are used to validate the beat detection with reference to its annotation available in the database. If the PPG waveform is clear and ECG annotation is present, a beat was taken into account based on its presence or absence. Many researchers utilized searching window [12] and authors in [13] generated blocks of interest using two event-related moving averages to locate ‘a’ waves and these waves might be missed either in the selective window or blocks of interest. Generally, bio signals related to heart activity are aperiodic but are recurring i.e., the harmonic components of two successive recurrences of the PPG signal and its derivatives can be at different frequencies, where recurrence is the duration from peak to peak. The lengths of PPG and SDPPG signal recurrences are normalized by re-sampling to ensure that all the harmonic components are processed in the same way such that the number of samples is same for all its recurrences and aligned with other recurrences of the signal. The Mth samples of each period are then averaged.
Feature extraction
The algorithm seeks the positive zero-crossing points in each beat of SDPPG, assuming all peaks as “a” peaks as shown in Figure 3D and evaluates onsets and systolic peaks in accordance with ECG annotation. It also assumes global maximum point as ‘a’ wave, after co-ordinating with all other maximal points in all its recurrences. It is found that the average amplitude of “a” wave ranges from 0.0148 to 0.048 and the deviation has been fixed as ± 0.005. In case, if a point is not detected in any time interval, it attempts to relocate it based on its average amplitude and deviation of ± 0.005, starting from first beat to last beat, thereby recovering any missed ‘a’ points. Figure 3E shows detected “a” waves.
Detection of R peaks
The R peaks in ECG signal is estimated by setting an amplitude threshold of 0.63 of its maximum amplitude. The peaks above this threshold level are detected as R peaks for every beat in accordance with the approved ECG annotations in the database as shown in Figure 3F.
Estimation of a-a intervals and RR intervals
The length of the consecutive a-a intervals from SDPPG and consecutive RR intervals from ECG were used for the time domain analysis of PRV and HRV respectively, determined from Equations 2 and 3.
aa [i] = a [i + 1] – a [i] → (2)
RR [i] = RR [i + 1] – RR [i] → (3)
Where a [i+1] and a [i] are the consecutive a waves in each SDPPG signal and aa [i] is the a-a interval and RR [i+1] and RR [i] are the consecutive R peaks in each ECG and RR [i] is the RR interval.
HRV and PRV analysis
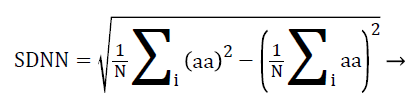
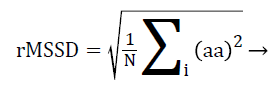
Statistical analysis of HRV from time domain are of two types, statistics calculated directly from RR intervals also called normal-to-normal intervals (NN intervals) and statistics derived from the differences between successive NN intervals. The most commonly used indices derived from NN intervals are standard deviation of NN intervals (SDNN) from the first type and the square root of the mean squared differences of successive NN intervals (RMSSD) from the second type. Here, the RR interval is replaced by a-a interval for PRV analysis, calculated using Equations 4 and 5.
 (4)
(4)
 (5)
(5)
Where N is the total number of successive a-a intervals and i is a counter ranging from 1 to N.
Results and Discussion
Evaluation of “a” waves
Two standard statistical parameters, sensitivity (Se) and positive predictivity (P)+ given in Equations 6 and 7 were estimated for performance evaluation of ‘a’ wave detection.
Se=TP/(TP+FN) → (6)
P+=TP/ (TP+FP) → (7)
TP is the number of true positives (a wave detected as a wave), FN is the number of false negatives (a wave not detected) and FP is the number of false positives (non-a wave detected as a wave). If the PPG waveform is evident, beat detection was taken as TP for its presence, FN if absent and FP for an imperceptible PPG waveform. For instance, all global maximum peaks that have moving point coordination were chosen to affirm as TP or discard them as FP or FN. The algorithm accounted pointed peaks (high amplitude) for the ‘a’ wave and the statistical quality of the signal like mean and standard deviation does not change considerably with time.
Regular heart rhythm, irregular heart rhythm and varying amplitude non-stationary PPG signals are analysed as shown in Figure 4. However, it accounted a failure, with exactly one FN, as shown in Table 1, cause of the failure being low amplitude ‘a’ waves. It also earned no failures, leading to a positive predictivity of 100% and a sensitivity of 99.76% revealing the robustness of the algorithm.

Figure 4. PPG signal and SDPPG signals with detected “a” waves for (A) regular heart rhythm, (B) irregular heart rhythm and (C) nonstationary and varying amplitudes. Here, the ‘star’ represents the detected “a” wave using the proposed algorithm.
| Record | No of beats | TP | FP | FN | Se (%) | P+ (%) |
|---|---|---|---|---|---|---|
| 1 | 17 | 17 | 0 | 0 | 100 | 100 |
| 2 | 16 | 16 | 0 | 0 | 100 | 100 |
| 3 | 20 | 20 | 0 | 0 | 100 | 100 |
| 4 | 19 | 19 | 0 | 0 | 100 | 100 |
| 5 | 16 | 16 | 0 | 0 | 100 | 100 |
| 6 | 20 | 20 | 0 | 0 | 100 | 100 |
| 7 | 17 | 17 | 0 | 0 | 100 | 100 |
| 8 | 17 | 17 | 0 | 0 | 100 | 100 |
| 9 | 14 | 14 | 0 | 0 | 100 | 100 |
| 10 | 16 | 16 | 0 | 0 | 100 | 100 |
| 11 | 18 | 18 | 0 | 0 | 100 | 100 |
| 12 | 21 | 21 | 0 | 0 | 100 | 100 |
| 13 | 18 | 18 | 0 | 0 | 100 | 100 |
| 14 | 15 | 15 | 0 | 0 | 100 | 100 |
| 15 | 18 | 18 | 0 | 0 | 100 | 100 |
| 16 | 17 | 17 | 0 | 0 | 100 | 100 |
| 17 | 14 | 14 | 0 | 0 | 100 | 100 |
| 18 | 18 | 18 | 0 | 0 | 100 | 100 |
| 19 | 15 | 15 | 0 | 0 | 100 | 100 |
| 20 | 12 | 12 | 0 | 0 | 100 | 100 |
| 21 | 13 | 13 | 0 | 0 | 100 | 100 |
| 22 | 18 | 18 | 0 | 0 | 100 | 100 |
| 23 | 16 | 16 | 0 | 0 | 100 | 100 |
| 24 | 20 | 20 | 0 | 0 | 100 | 100 |
| 25 | 12 | 12 | 0 | 0 | 100 | 100 |
| 26 | 15 | 15 | 0 | 0 | 100 | 100 |
| 27 | 15 | 15 | 0 | 0 | 100 | 100 |
| 28 | 14 | 13 | 0 | 1 | 92.86 | 100 |
Table 1. Overall performance of the “a” wave detection algorithm.
Evaluation of HRV and PRV
Correlation coefficient analysis was used to examine the association and strength of the two quantitative variables. Table 2 shows SDNN and rMSSD index calculated for 28 subjects. PRV features are highly comparable to those of HRV, as observed from Figure 5a and Figure 5b which shows a strong positive correlation between the two HRV indices RMSSD and SDNN with r=0.902207 and r=0.825032 for PPG and ECG signals respectively. Figures 5c and 5d shows a negative correlation between the heart rate and HRV indices, with rMSSD index is more negatively correlated with the HR (r =-0.09805) than the SDNN index (r =-0.0098).
| Record input | PPG signal | ECG signal | ||||
|---|---|---|---|---|---|---|
| Average a-a interval |
SDNN | rMSSD | Average R-R interval |
SDNN | rMSSD | |
| 1 | 0.6117 | 0.0109 | 0.0408 | 0.6107 | 0.0108 | 0.0407 |
| 2 | 0.6531 | 0.0153 | 0.0467 | 0.6505 | 0.0101 | 0.05 |
| 3 | 0.5628 | 0.2394 | 0.036 | 0.504 | 0.0026 | 0.0265 |
| 4 | 0.67 | 0.2416 | 0.1781 | 0.5304 | 0.0071 | 0.0312 |
| 5 | 0.7513 | 0.1932 | 0.0646 | 0.6935 | 0.0037 | 0.0533 |
| 6 | 0.6806 | 0.1851 | 0.0504 | 0.6893 | 0.2561 | 0.0613 |
| 7 | 0.6769 | 0.008 | 0.0521 | 0.6794 | 0.0038 | 0.0523 |
| 8 | 0.7023 | 0.0059 | 0.0625 | 0.7745 | 0.0067 | 0.0704 |
| 9 | 0.8269 | 0.2277 | 0.078 | 0.7738 | 0.1076 | 0.071 |
| 10 | 0.7013 | 0.002 | 0.0615 | 0.7773 | 0.003 | 0.0648 |
| 11 | 0.5565 | 0.015 | 0.0348 | 0.559 | 0.0149 | 0.0349 |
| 12 | 0.5015 | 0.106 | 0.0359 | 0.5805 | 0.124 | 0.0371 |
| 13 | 0.591 | 0.0039 | 0.0421 | 0.632 | 0.0041 | 0.0421 |
| 14 | 2.442 | 0.97 | 0.335 | 0.7418 | 0.1544 | 0.0689 |
| 15 | 1.091 | 0.5888 | 0.155 | 0.7632 | 0.2289 | 0.0797 |
| 16 | 0.6967 | 0.0051 | 0.0581 | 0.6751 | 0.0059 | 0.0519 |
| 17 | 0.7225 | 0.0608 | 0.0558 | 0.7267 | 0.0944 | 0.0611 |
| 18 | 0.5231 | 0.006 | 0.0291 | 1.2674 | 0.7793 | 0.2126 |
| 19 | 1.9664 | 0.9523 | 0.3458 | 0.8632 | 0.0056 | 0.0863 |
| 20 | 0.8448 | 0.0153 | 0.0845 | 0.8632 | 0.0056 | 0.0863 |
| 21 | 0.9104 | 0.436 | 0.1009 | 0.7553 | 0.0203 | 0.063 |
| 22 | 0.5989 | 0.0077 | 0.0399 | 0.6383 | 0.0045 | 0.0456 |
| 23 | 1.143 | 0.7073 | 0.168 | 0.6497 | 0.0033 | 0.0464 |
| 24 | 0.7342 | 0.7356 | 0.1582 | 0.7427 | 0.1384 | 0.063 |
| 25 | 0.304 | 0.028 | 0.018 | 0.3029 | 0.0494 | 0.0138 |
| 26 | 0.6277 | 0.028 | 0.0439 | 0.6697 | 0.0841 | 0.0482 |
| 27 | 0.6714 | 0.125 | 0.0491 | 0.6623 | 0.1383 | 0.0483 |
| 28 | 0.7513 | 0.1932 | 0.0646 | 0.6935 | 0.0037 | 0.0533 |
Table 2. PRV and HRV indices calculated from SDPPG and ECG.

Figure 5. Relations between (a) SDNN and rMSSD calculated from SDPPG (b) SDNN and rMSSD calculated from ECG s (c) HR and rMSSD from SDPPG (d) HR and SDNN from SDPPG.
Conclusion
HRV is the effect of various influences of autonomic nervous system on heart rate, extensively obtained from ECG signals but it is limited in practical applications such as homecare and mobile medical assistance due to inconvenience of measurement. Therefore, PRV derived from SDPPG has been verified in terms of ease and convenience for HRV measurement. In this paper, we have proposed SDPPG analysis algorithm to report accurately a points to calculate a-‘a’ intervals for PRV measurement and correlated with HRV indices similar to those obtained using ECG.
Many researchers analysed the performance evaluation of ‘a’ waves either in a small dataset or for selected patients like normotensive young subjects. The proposed algorithm was tested on a large-scale openly accessible database from PhysioNet for performance evaluation with different morphology such as regular and irregular heart rhythms, low and varying amplitudes and from healthy adults to unhealthy and aged patients and achieved 99.75% sensitivity and 100% positive predictivity ensuring its robustness. Moreover, the resampling technique eliminates the need for optimising threshold values and also ensures the presence of ‘a’ points in all its recurrences compared to [8], where the undesired blocks are essentially eliminated using threshold values. The proposed approach has provided better detection accuracy as compared to the existing methods for the detection of ‘a’ waves in SDPPG signals. However, it is necessary to study and further validate this method on a larger dataset before applying it for clinical purposes.
The results from time domain (SDNN and rMSSD indices) and the correlation coefficient analysis prove that PRV can be a substitute for HRV. There is a strong positive correlation between SDNN and rMSSD indices, with respect to both SDPPG and ECG, indicating that the 10-second recordings are adequate to reliably measure both PRV and HRV. These indices also show a negative correlation with heart rate, with the rMSSD index being more negative. The current study strongly suggests that PPG signals can be used as a good alternative to derive HRV parameters quantified through SDPPG. Future work will involve investigation of stress in depressed patients through PRV.
References
- Nazeran H, Chatlapalli S, Krishnam M. Effect of novel Nano scale energy patches on spectral and nonlinear dynamic features of heart rate variability signals in healthy individuals during rest and exercise. Eng Medi Biol Soc 2005; 5563-5567.
- Baumert JH , Haggenmiller C, Adt M, Frey AW. Hypertensive patients with coronary artery disease and an abnormal pattern of heart rate variability. Comp Cardiol 1994; 373-376.
- Stein PPK, Kleiger MRE. Insights from the study of heart rate variability. Annual Rev Medi 1999; 50: 249-261.
- Mietus JE, Peng CK, Henry I, Goldsmith RL, Goldberger AL. The pNNx files: re-examining a widely used heart rate variability measure. Heart 2002; 88: 378-380.
- Enze Yu, Dianning He, Yingfei Su, Li Zheng and Lisheng Xu. Feasibility Analysis for PRV to Replace HRV of The Healthy Subject’, in Proceedings of the IEEEI International conference on robotics and biometrics 2013; 1025-1073.
- Posada-Quintero HF, Delisle-Rodríguez D, Cuadra-Sanz MB. Evaluation of pulse rate variability obtained by the pulse onsets of the photoplethysmographic signal. Physiol Meas 2013; 34: 179-188.
- Srinivas K, Ram gopal Reddy L, Srinivas R. Estimation of heart rate variability from peripheral pulse wave using PPG sensor. 3rd kula lampur Int conf Biomed Eng 2006; 15: 325-328.
- Constant I, Laude D, Murat I, Elgozhi JL. Pulse rate variability is not a surrogate for Heart rate variability. Clin Sci 1999; 97: 391-397.
- Taniguchi K, Nishikawa A, Nakagoe H, Sugino T, Sekimoto M, Okada K, Takiguchi S, Monden M, Miyazaki F. Evaluating the surgeon's stress when using surgical assistant robots. The 16th IEEE International Symposium on Robot and Human interactive Communication 2007; 888-893.
- Mohamed E, Mirjam J, Friso DB. Heart rate variability measurement using the second derivative photoplethysmogram. Biosignals Proc Bio-Inspired Syst Sig Proces 2010; 266-277.
- Task force of the European society of cardiology the North American society of pacing and electrophysiology. Heart rate variability: Standards of measurement, physiological interpretation, and clinical use. Circulation 1996; 93: 1043-1065.
- Li BN, Dong MC, Vai MI. On an automatic delineator for arterial blood pressure
- waveforms. Biomedi Sig Proc Contrl 2010; 5: 76-81.
- Mohamed E, Ian N, Matt B, Derek A, Dale S. Detection of ‘a’ and ‘b’ waves in the acceleration photoplethysmogram. BioMed Eng O 2014; 13: 139.