Research Article - Journal of Biochemistry and Biotechnology (2021) Volume 4, Issue 5
Radix Astragali and Notoginseng saponins improve glucose and fatty acid metabolism through upregulated adiponectin and it downstream signaling pathway.
Shih-Chien Huang1,2, Shih-Chuan Liu2, Ching-Pin Lin3,4, Chien-Chun Li1 ,Yi-Ching Li5 ,Shu-Fen Huang6, Yi-Chu Tang6, Kamesh Venkatakrishnan1, You-Cheng Shen2*
1Department of Nutrition, Chung Shan Medical University, Taichung, Taiwan
2Department of Health Industry Technology Management, Chung Shan Medical University, Taichung, Taiwan
3Department of Internal Medicine and Division of Gastroenterology, Chung Shan Medical University Hospital, Taichung, Taiwan
4Department of Pharmacology, School of Medicine, Chung Shan Medical University, Taichung, Taiwan
5Institute of Biochemistry, Microbiology and Immunology, Chung Shan Medical University, Taichung, Taiwan
6Department of Biochemistry, National Defense Medical Center, Taipei, Taiwan
- Corresponding Author:
- You-Cheng Shen
Department of Health Industry Technology Management
Chung Shan Medical University
Taichung, Taiwan
E-mail: youcheng@csmu.edu.tw
Accepted date: August 29, 2021
Citation: Huang SC, Liu SC, Lin CP, et al. Radix Astragali and Notoginseng saponins improve glucose and fatty acid metabolism through upregulated adiponectin and its downstream signaling pathway. J Biochem Biotech. 2021;4(5): 1-8
Abstract
This study was aimed to evaluate the effects of saponins rich Radix Astragali and Radix Notoginseng (ANS) on adiponectin mRNA and its downstream signaling proteins in 3T3-L1 adipocytes as well as their effects on glucose and fat metabolism in rat, and obese subjects. 3T3- L1 adipocytes were used to determine the levels of adiponectin mRNA and protein expression of AMPK, p-AMPK, pACC, and GLUT4. In the animal studies, 16 rats were orally administered with either placebo or ANS (0.1 mg/kg; orally). A clinical trial was conducted on healthy obese subjects, who were divided into placebo and ANS groups and consumed either placebo or ANS (5 capsules/day). ANS increased adiponectin mRNA by 103% and 248% in normal and palmitate- induced (IR) 3T3-L1 adipocytes and the protein expressions of AMPK, p-AMPK, pACC, and GLUT 4, and glucose uptake were significantly improved (p<0.01). ANS treated rats showed a significant decrease (p<0.05) in the levels of blood glucose (11%) and serum insulin (38%) than control rats. In the human trial, ANS increased adiponectin levels by 29.51% and reduced body weight, BMI, body fat, TG, and LDL-c in ANS treated subjects compared to the placebo group. Overall, ANS could up-regulate adiponectin mRNA, AMPK, pAMPK, pACC, and GLUT4 in adipocytes as well as improve glucose regulation and fatty acid oxidation in adipocytes, rats, and healthy obese human subjects. Thus effective in mitigating glucose and fatty acid dysfunction and its related metabolic syndrome.
Keywords
Adiponectin, Saponins, ANS, 3T3-L1 adipocytes, Obese subject.
Introduction
Impaired glucose and fatty acid metabolic functions (obesity) have been implicated in various metabolic syndrome including diabetes mellitus, obesity, and cardiovascular diseases [1]. Adipose tissue is responsible for the secretion of various adipokines and peptide hormones that directly or indirectly regulate fatty acid oxidation and glucose regulation [2]. Adiponectin is a fat hormone secreted by adipocytes as well as osteoblasts, myocytes, and epithelial cells. Adiponectin levels are significantly lowered in obese subjects [3,4]. Many researchers have demonstrated that adiponectin deficiency would result in glucose and fatty acid dysfunction [5,6].
Hence, many scientists started to focus on adiponectin as it could be a promising agent to ameliorate obesity and its related underlying complications through regulating glucose and fat metabolism.
In recent times, people are showing immense interest in traditional and complementary medicine especially Traditional Chinese Medicine (TCM), to deal with various metabolic syndromes [7]. Radix Astragali (Huangqi) or Astragalus membranaceus roots have been traditionally used for treating various ailments, especially hepatic and spleen disorders, as well as immune functions [8]. Studies have revealed that the presence of various major phytocomponents like triterpenoid saponins (isoastragalosides, astragalosides I-IV), flavonoids, and polysaccharides might be the reason for various biological functions [9,10]. Radix Notoginseng (Tianqi) or Panax Notoginseng is one of the most widely used TCM and has been traditionally used to cure trauma, pain, and internal bleeding and injury [11]. Panax Notoginseng contains an array of active phytocomponents including saponins (ginsenoside-Rb1, Rg1, Rd, Re, Rc), flavonoids (quercetin, kaempferol), sterols, saccharides (sucrose, sanchinan A) [12].
Both Radix Astragali and Radix Notoginseng have common active ingredients like saponins, flavonoids, which are responsible for most of their biological functions. Many TCM practitioners use this combinational TCM for treating various complications like type 2 DM, kidney disorders, and immune disorders [13-15]. Previous studies have indicated that both Radix Astragali and Radix Notoginseng separately could effectively increase the production of adiponectin and suppress the progression of obesity and its related complications via regulating glucose and fat metabolism [16-20]. However, to the best of our knowledge, this is the first study that attempts to evaluate the effect of a specific mixture of saponins from Radix Astragali and Radix Notoginseng on adiponectin mRNA and adiponectin-mediated signaling proteins and their effects in 3T3-L1 adipocytes as well as the glucose and fat indices in rat and healthy obese subjects.
Materials and Methods
Samples and chemicals
ANS samples were provided by NuLiv Science USA Inc (Brea, CA, USA). ANS consists of 50 mg of an equal mixture of Radix Astragali (10:1 hydroethanolic extract) and Radix Notoginseng (50:1 aqueous extract) rich in saponins (>2.5%; astragalosides and ginsenosides especially Rg1) that were conferred by HPLC analysis as indicated previously by our co-team [21].
Cell line
3T3-L1 pre-adipocytes cell line was purchased from America Type Culture Collection (ATCC; VA, USA) and were cultured with Dulbecco’s Modified Eagle’s Medium (DMEM) supplemented with 100 IU/ml penicillin, streptomycin, 1% non-essential amino acids, 10% Fetal Bovine Serum (FBS) were bought from Hyclone (UT, USA) and maintained in 5% CO2 at 37°C. When cells were confluent, differentiation of 3T3-L1Cells was carried out by the addition of differentiation inducers [0.5 mM isobutyl-methylxanthine, 0.24 mM dexamethasone, 10 µg insulin, 10% FBS with DMEM] for 48 h. 3T3-L1 cells were allowed to differentiate further by adding FBS, insulin and the medium was changed every 2 days until adipocytes formation. More than 90% of the adipocyte cells expressed the adipocyte phenotype between 8 and 10 days after the initiation of differentiation and were used for the experiments. Those mature adipocytes were monitored by morphological assessment and Oil red O staining. ANS (0.01 µg/mL) extract was dissolved in DMSO and the DMSO alone treated cells act as the control.
Palmitate-induced Insulin Resistance (IR) cell model: Fully differentiated 3T3-L1 adipocytes were treated with serum-free DMEM along with 0.1% Bovine Serum Albumin (BSA) and 500 µM of palmitate (palmitic acid by dissolving in ethanol). Control cells were treated only with Di-Methyl Sulf Oxide (DMSO).
Quantification of adiponectin mRNA by qPCR: Real- time quantitative PCR (q-PCR) was used to quantify the gene expression of adiponectin in 3T3-L1 cells treated with ANS. The differentiated 3T3-L1 cells were harvested after incubating with DMSO (normal) and palmitate (insulin resistant) and followed by treatment with placebo and ANS. The total RNA was extracted using TRIzol reagent (Invitrogen, CA, USA) based on the manufacturer protocol. Extracted RNA was reverse transcribed to cDNA using reverse transcription PCR master kit (Applied Bio systems, MA, USA) with primers of adiponectin (Forward- 5?AGAGAAGGGAGAAAGGAGATGC 3? and Reverse 5?TGAGCGATACACAT-AAGCGGC 3?) at different conditions for denaturation, annealing, and extension. The final cDNA was detected using CFX q-PCR fluorogenic detection system (Bio-Rad, CA, USA) coupled with an SYBR green RT-PCR mixture kit. Two independent triplicate experiments were carried out for adiponectin and the threshold cycle (Ct) values were averaged (mean). The total mRNA expression of adiponectin and each group was normalized to GADPH expression yielding the ΔCt value.
Glucose absorption: Glucose uptake in 3T3-L1 adipocytes was examined by the addition of 2-[1-14C] deoxy-D- glucose as mentioned previously by Shao-Ling and others [22]. In short, 3T3-L1 cells (1 × 10⁵ cells-serum starved) were washed with Krebs-Ringer Phosphate (KRP) buffer and followed by the addition of placebo/control or ANS and again washed with KRP buffered solution and followed by addition of 100 nM insulin for 30 min and 5 mM of 2-[1- 14C] deoxy-D-glucose was added and incubated at 37°C for 10 min. Cells were again washed with PBS solution and lysed using an SDS solution (2%) and filtered. Then the protein content of cell lysate was determined using the BCA protein assay kit and then the intracellular uptake of glucose was quantified (radioactivity) by using a liquid scintillation counter (Top Count, Packard Bio Sciences, CT, USA).
Western blot for quantification of adiponectin downstream signaling molecules: 3T3-L1 cell line was treated with ANS or placebo and lysed (lytic buffer) and the subcellular mixture was extracted using Proteome Extract Subcellular Proteome Extraction Kit (Calbiochem, Millipore; CA, USA). The protein levels of subcellular fractions were estimated using the BCA protein assay kit. A protein sample of equal concentration (40 µg) of cells treated with either placebo and/or ANS and separated using SDS-PAGE electrophoresis and probed (electro- transferred) onto a PVDF membrane. Then the membrane was incubated with different primary antibodies of AMP-activated protein kinase (AMPK), phosphorylated- Acetyl Co-A Carboxylase (pACC), pAMPK, Glucose transporter type-4 (GLUT4) (Cell signaling, MA, USA), and α-tubulin (house-keeping with different dilution rate 1:1000) for overnight at 4°C. Then followed by secondary HRP-conjugated antibodies (Abcam, Cambridge, UK). Finally, the protein signal was visualized with the help of a chemiluminescence ECL kit (Pierce, Thermofisher, USA) and the protein expressions were picture (by digital camera-Nikon) were captured and quantified using ImageJ analyzing Software from NIH (MD, USA).
Animal study
Experimental rats and grouping (Ethical approval): In total, 16 healthy eight-week-old male Sprague-Dawley rats weighing 180 ± 10 g were procured from the National Animal Laboratory of NSC (Taipei, Taiwan). All the rats were maintained in ambient laboratory conditions (22- 24°C; 55-65 moisture) and housed in a cage with full access to water and rat feed (ad libitum) in a 12 h light/ dark cycle. All the animal procedures used in this study were approved by the Ethical Clearance Board (ECB) at Chung Shan Medical University (CSMU-124/2020) and performed under the NIH guide for the care and handling of animals.
Oral Glucose Tolerance Tests (OGTT): The baseline blood sample analysis on blood sugar level indicated no statistical difference between placebo and ANS groups on day 0. Rats in the treatment group received 0.1 mg/kg ANS (n=8) 12 h before OGTT. A bolus of glucose (50% v/w, 1 g/kg) was orally administered. Blood samples were collected from the tail at -40, 0 (fasting value), 30, 60, and 90 min before and after the glucose administration. A Lifescan glucose analyzer (Los Angeles, CA, USA) was utilized for glucose concentration determination.
Insulin assay: The baseline blood sample analysis on insulin level indicated no statistical difference between the placebo and ANS (treatment) groups on day 0. The rats in the treatment group received 0.1 mg/kg ANS 12 h before the insulin sensitivity test. A bolus of glucose (50% v/w, 1 g/kg) was orally administered to the rats in both the placebo and the treatment groups. Blood samples were collected from the rats’ tails at -40, 0 (fasting value), 30, 60, and 90 min before and after the glucose administration. Insulin levels were determined on an ELISA analyzer (TecanGenios, Salzburg, Australia) with the use of commercially available ELISA kits (Diagnostic Systems Laboratories, Inc., Webster, TX, USA), by the manufacturer’s instructions.
Sample collection: All the rats were euthanized with ether and blood samples were collected and serum samples were collected by centrifuging at 12000 × g for 15 min and the pale-yellow serum upper layer was collected. Serum glucose was determined in rats using a rat-specific Glucose ELISA kit from My Bio Source (CA, USA). While, serum insulin levels were determined using a commercial ELISA insulin kit purchased from Diagnostic System Laboratories, Inc (TX, USA) based on suppliers’ protocol.
Clinical trial
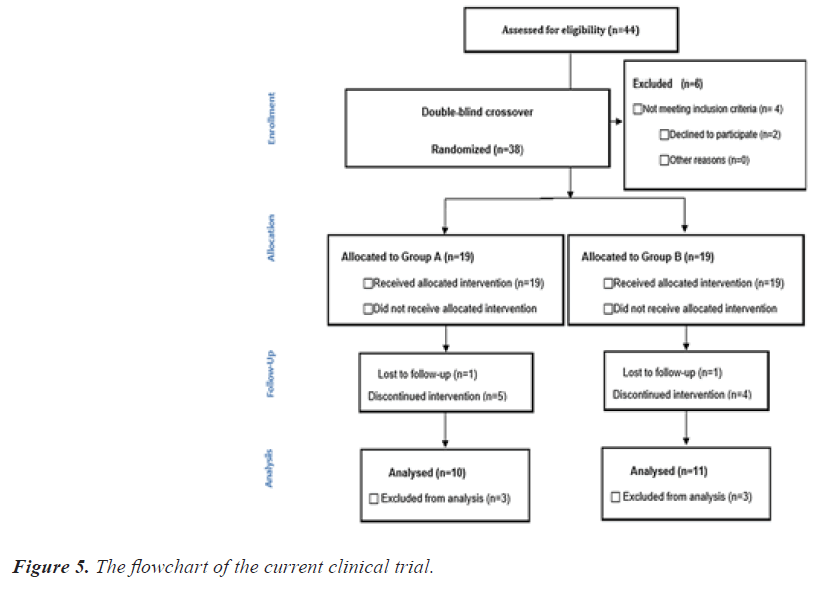
Study design: For the randomized, placebo-controlled, double-blind, crossover clinical trial, a total of 44 healthy obese subjects aged between 20 and 60 were recruited via newspaper advertisements and flyers. Of the recruits, only 38 subjects were enrolled into this trial based on various inclusion criteria (aged 20 and above who volunteered to participate in the trial with body mass index (BMI) ? 27 or body fat ? 30% without any major health complications) and exclusion criteria (subjects with cardiovascular disease, liver disease, cancer, uncontrolled diabetes mellitus, chain/heavy smokers or pregnant or lactating women and/or with BMI>35). This trial was conducted at Chung Shan Medical University Hospital (Taichung, Taiwan) by following the guidelines in the Declaration of Helsinki (1990) and with the approval of the Institutional Review Board of Chung Shan Medical University Hospital (Protocol No. CS16098). Moreover, this trial has been registered on ClinicalTrials.gov (NCT03654391). Before the study, subjects were asked to provide the necessary information and sign an informed consent form.
Experimental grouping and sample collection: The recruited 38 subjects were equally separated into 2 groups (placebo and ANS). The two groups went through a 12- week phase I and a 12-week phase II study, separated by a 4-week washout period. Each participant took 5 capsules per day of either ANS or placebo (50 mg ANS in each capsule; 2 capsules before breakfast and 3 before dinner) for 12 weeks. Participants were asked to maintain their normal lifestyle and dietary habits (no caloric restrictions). Out of the 38 subjects, 21 subjects completed the trial with 17 subjects withdrew due to personal and other health issues. Blood samples were collected at baseline (0 weeks), 6th, 12th, 16th, 22th, and 28th weeks in fasted subjects, and various biochemical parameters including lipid profile and adiponectin were measured using a commercial kit (Abcam, Cambridge, UK). Anthropometric parameters like body weight, body mass index (BMI), waist circumference, and body fat level were also measured using a body fat analyzer (Karada Scan 371, OMRON, Japan).
Statistical analysis: All the cell line studies are repeated as triplicate (n=3) to get a concordance and are expressed as mean ± standard deviation (SD). Whereas, in animal studies, all the values for each group were expressed as mean ± SD (n=8). All the experimental groups are inter- compared by One-way ANOVA and followed by Student’s t-test using SPSS software (IBM, USA). Similarly, for the clinical trial, the difference between the placebo and ANS groups at a different time interval (6th or 12th weeks) was determined by Student’s t-test using SPSS software (IBM, USA). A P-value of less than 0.05 is deemed statistically significant.
Results
In-vitro (Cell line), with adipocytes study
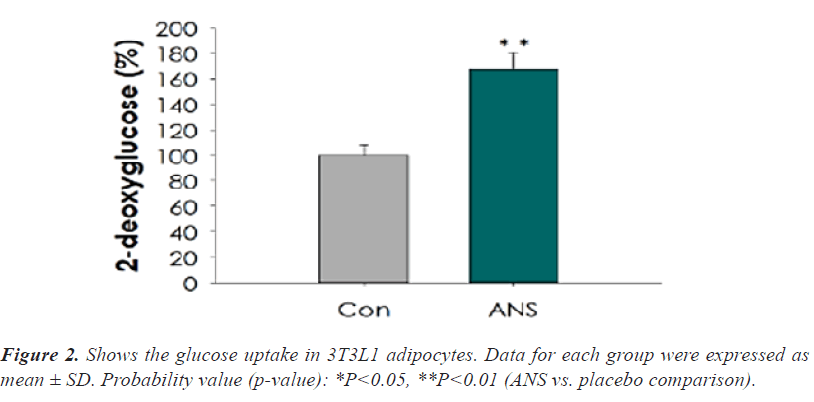
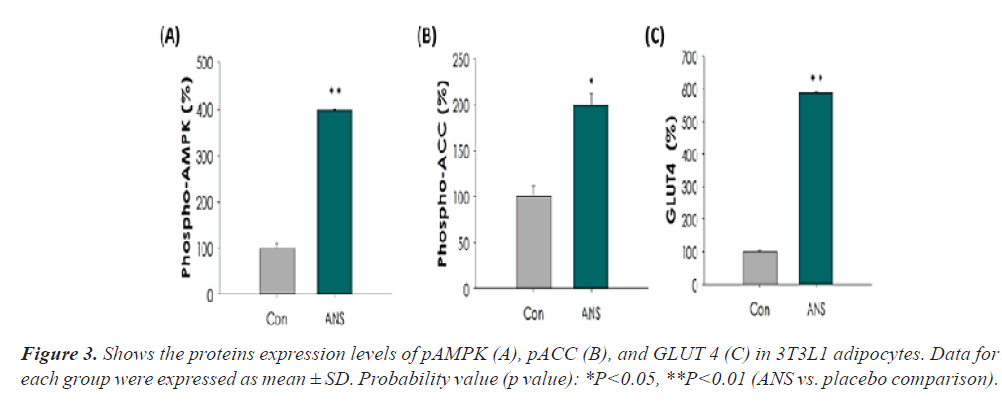
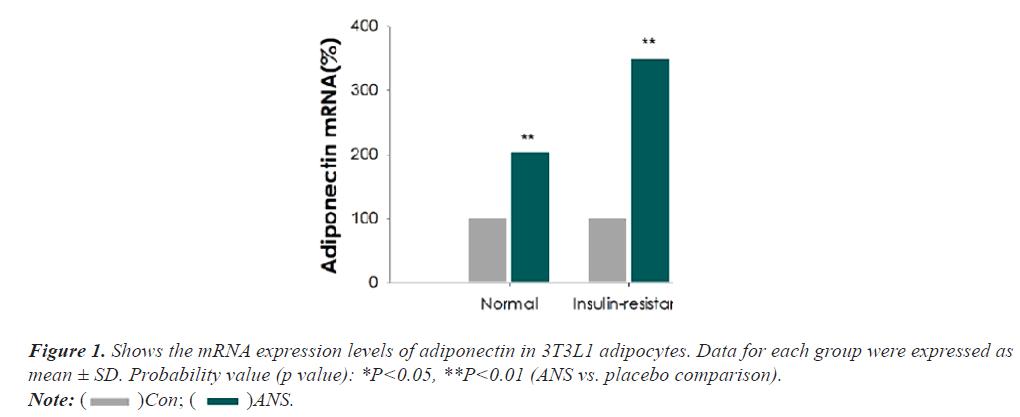
As indicated, the mRNA expression levels of adiponectin were considerably escalated (p<0.05) in the normal (103%) and IR (palmitate)+ANS group (248%). The 3T3L1 adipocyte cells treated with ANS showed a notable increase (p<0.05) in glucose uptake (68%) than DMSO- treated control cells. Meanwhile, 3T3L1 cells co-cultured with ANS displayed a significant up regulation (p<0.05) in the protein expressions of pAMPK, pACC, and GLUT 4 compared to control (Figures 1-3).
Animal study
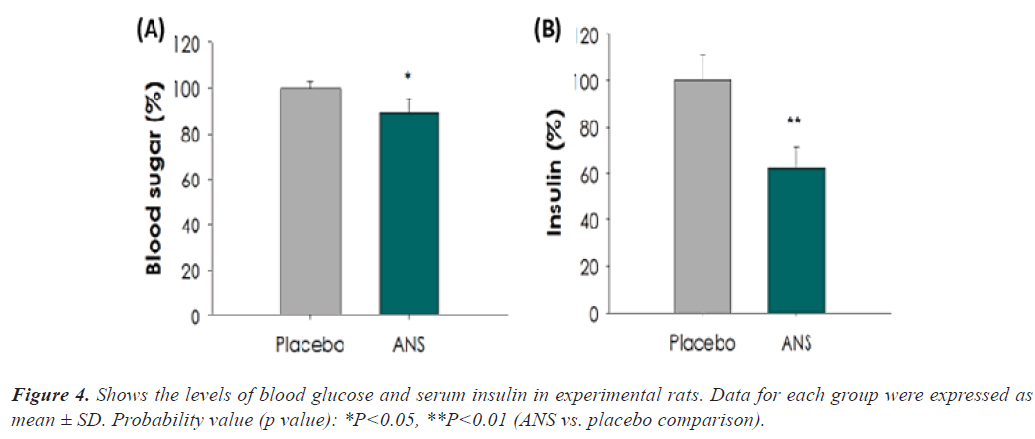
The impact of placebo and ANS on blood glucose (OGTT- glucose tolerance) and serum insulin. Rats treated with ANS showed a significant reduction in blood glucose (11% AUC) and serum insulin (38% AUC), compared to placebo-treated rats (p<0.05). The above data indicate that ANS could significantly enhance glucose uptake and thus exemplify its ability to lower glucose intolerance (Figure 4).
Clinical trial
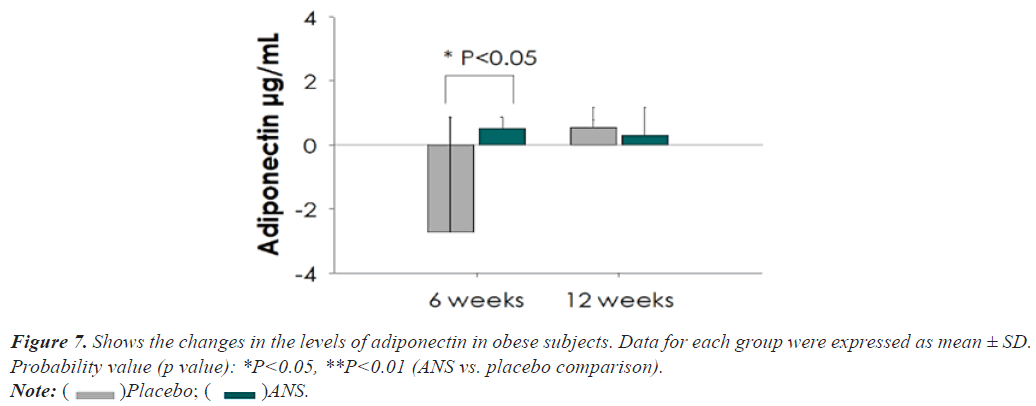
The flowchart of the present clinical trial is exemplified in Figure 5. After 12 weeks of oral supplementation with ANS, subjects in the ANS treated group considerably reduced (p<0.05) their body weight, body fat, and BMI compared to the placebo group (Figure 6). Similarly, the levels of triglyceride (TG) and low-density lipoprotein cholesterol (LDL-c) were significantly reduced (p<0.05) in subjects treated with ANS. No changes were observed in the case of total cholesterol (TC) or high-density lipoprotein cholesterol (HDL-c) (Table 1). Moreover, ANS supplemented obese subjects showed elevated levels of adiponectin (29.51%) as compared with the placebo group. Additionally, the calorie intake of all subjects was measured but did not show any significant changes (Figures 4-7).
| Parameters | Groups | Baseline | 6th week | 12th week |
|---|---|---|---|---|
| Cholesterol (mg/dl) | ANS | 185.76 ± 36.37 | 188.95 ± 42.65 | 183.95 ± 41.16 |
| Placebo | 190.90 ± 35.55 | 191.33 ± 42.30 | 183.57 ± 34.77 | |
| Triglyceride (mg/d) | ANS | 109.76 ± 53.06 | 111.10 ± 64.43 | 98.96 ± 55.80* |
| Placebo | 121.90 ± 71.60 | 108.33 ± 56.59 | 117.57 ± 76.96 | |
| LDL-c (mg/dl) | ANS | 112.32 ± 27.70 | 114.02 ± 36.85 | 109.16 ± 33.73 |
| Placebo | 117.75 ± 30.49 | 116.71 ± 34.61 | 107.76 ± 26.84* | |
| HDL-c (mg/dl) | ANS | 50.43 ± 13.77 | 48.95 ± 12.58 | 50.17 ± 14.18 |
| Placebo | 50.40 ± 14.03 | 49.65 ± 14.43 | 51.90 ± 17.26 |
Data for each group were expressed as mean ± SD. Probability value (p value): *P<0.05, **P<0.01 (ANS vs. placebo comparison). LDL-c: Low Density Lipoprotein cholesterol; HDL-c: High Density Lipoprotein cholesterol.
Table 1. Shows the effect of ANS on lipid profile in obese subjects.
Discussion
An ample number of studies indicated that suppressed production of adiponectin is associated with impaired glucose regulation and fatty acid oxidation [2-4]. Since adiponectin could regulate the cellular energy metabolism in cells through modulating the AMPK signaling pathway. Elevated adiponectin results in increased AMPK phosphorylation (pAMPK), which in turn modulates ACC (via phosphorylation-pACC) and promotes fatty acid oxidation. Furthermore, AMPK also enhances glucose transporter GLUT4 regulation in adipose tissue and contributes to increased glucose uptake and lower insulin resistance [23,24]. The above statement clarified the importance of adiponectin and fat and glucose metabolism. If any drug or agent which positively modulates adiponectin, it would alter fat and glucose metabolism and thereby be used for ameliorating fat and glucose dysfunction or disorders including obesity and DM. Previous studies have reported that saponins from plants could upregulate adiponectin production [17-24]. Both Radix Astragali and Radix Notoginseng (rich in saponins) have been reported to enhance the production of adiponectin and suppress the progression of obesity [16-20]. Few researchers also indicated that polysaccharides and flavonoids in Radix Astragali and Radix Notoginseng might also contribute to increased adiponectin production [16-19].
To the best of our knowledge, this is the very first study conducted to check the effects of a specific mixture of saponins from Radix Astragali and Radix Notoginseng on adiponectin mRNA and its downstream signaling proteins AMPK, pAMPK, pACC, GLUT4 in adipocytes and their effects on glucose or fatty acid regulation in adipocytes, rats, and humans. Our in vitro study revealed that 3T3- L1adipocytes treated with ANS showed a significant increase in the mRNA levels of adiponectin as well as markedly upregulated the protein expressions of pAMPK, pACC, and GLUT 4 than cells received only DMSO (control). Various saponins (astragalosides of Radix Astragali and ginsenoside of Radix Notoginseng) are reported to increase the adiponectin secretion in various cells like hepatic, muscle, adipocytes and thus upregulate AMPK related signaling proteins and subsequently regulate fat and glucose metabolism [17-25].
Moreover, ANS decreased blood glucose and serum insulin levels in normal rats likely due to upregulated adiponectin and its downstream signaling proteins in rats. Similarly, many researchers also demonstrated that rats treated with saponins of Radix Astragali and Radix Notoginseng can lower excessive blood glucose and improve insulin resistance [26,27]. In the case of the human trial, the subjects treated with ANS showed decreased body weight, BMI, body fat, TG, and LDL-c levels along with improved adiponectin levels. A similar kind of results was reported by few researchers in humans after treatment with Radix Astragali and Radix Notoginseng rich in saponins [28,29]. The above results suggested that synergistic activity of saponins present in the ANS would involve in increased production of adiponectin and subsequently alter fat and glucose metabolism in healthy obese subjects on a non- calorie restricted diet. The strength of the current study is the inclusion of all types of models (cell line, animal, and human) to check the impact of ANS on fat and glucose metabolism. Moreover, the results are consistent with all models and thus confer the importance of ANS (saponins) against obesity and DM. The limitation of the present study is that the human trial was conducted on healthy obese individuals without dietary restriction and only major parameters were included in the animal study. In the future, we plan to conduct clinical trials with ANS on either healthy obese subject on a calorie-restricted diet or diabetic subjects on either non-calorie restricted or calorie-restricted diets.
Conclusion
The major findings of the present study were that ANS improved glucose regulation and fatty acid oxidation through upregulated adiponectin mRNA and AMPK, pAMPK, pACC, and GLUT4 transport proteins. In addition, ANS treatment resulted in a significant reduction in the levels of glucose and insulin in rat model and body weight, body fat, BMI, TG, and LDL-c in healthy obese human subjects. These findings suggest ANS can be a complementary modality for individuals with various metabolic syndromes.
Conflict of Interest
The author declares that there is no conflict of interest regarding this manuscript.
Authors Contributions
Shih-Chien Huang (SCH), Shih-Chuan Liu (SCL), You-Cheng Shen (YCS) are involved in concepting and designing this study. Ching-Pin Lin (CPL), Chien-Chun Li (CCL), Yi-Ching Li (YCL), Shu-Fen Huang (SFH), and You-Cheng Shen (YCS) conducted animal and clinical trial. Yi Chu Tang (YCT), Kamesh Venkatakrishnan (KV), You-Cheng Shen (YCS) conducted statistical analysis. Shih-Chien Huang (SCH), Shih-Chuan Liu (SCL), Kamesh Venkatakrishnan (KV), You-Cheng Shen (YCS) drafted this manuscript.
References
- Stanley SH, Laugharne JD. Obesity, cardiovascular disease and type 2 diabetes in people with a mental illness: A need for primary health care. Aust J Prim Health. 2012;18(3):258-264.
- Ouchi N, Parker JL, Lugus JJ, et al. Adipokines in inflammation and metabolic disease. Nat Rev Immunol. 2011;11(2):85-97.
- Rivera?Piza A, Choi L, Seo J, Lee HG, et al. Effects of high?fiber rice Dodamssal (Oryza sativa L.) on glucose and lipid metabolism in mice fed a high?fat diet. J Food Biochem. 2020;44(6):13231.
- Miczke A, Suliburska J, Pupek-Musialik D, et al. Effect of L-arginine supplementation on insulin resistance and serum adiponectin concentration in rats with fat diet. Int J Clin Exp Med. 2015;8(7):10358.
- Achari AE, Jain SK. Adiponectin, a therapeutic target for obesity, diabetes, and endothelial dysfunction. Int J Mol Sci. 2017;18(6):1321.
- Kawano J, Arora R. The role of adiponectin in obesity, diabetes, and cardiovascular disease. J. cardiometabolic syndr. 2009;4(1):44-49.
- Lyu S, Zhang S, Wang Z, et al. Reiview of metabolic syndrome in TCM clinical and experimental studies. J Tradit Chin Med. 2017;39(3):277-280.
- Fu J, Wang Z, Huang L, et al. Review of the botanical characteristics, phytochemistry, and pharmacology of Astragalus membranaceus (Huangqi). Phytother Res. 2014;28(9):1275-1283.
- Chang WL, Huang SF, Oh CH et al. The rejuvenating effects of Astragalus membranaceus and Centella asiatica saponins on human skin. J Biochem Biotech. 2021;4(4):1-6.
- Wang Z, Li XL, Hong KF, et al. Total flavonoids of Astragalus Ameliorated Bile Acid Metabolism Dysfunction in Diabetes Mellitus. Evidence-Based Complementary and Alternative Medicine. 2021;2021(1):1-9.
- Sun S, Wang CZ, Tong R, et al. Effects of steaming the root of Panax notoginseng on chemical composition and anticancer activities. Food Chem. 2010;118(2):307-314.
- Wang QW, Yu XF, Xu HL, et al. Ginsenoside Re improves isoproterenol-induced myocardial fibrosis and heart failure in rats. Evidence-Based Complementary and Alternative Medicine. 2019;201(1):1-9.
- Zhai R, Jian G, Chen T, et al. Astragalus membranaceus and panax notoginseng, the novel renoprotective compound, synergistically protect against podocyte injury in streptozotocin-induced diabetic rats. J. Diabetes Res. 2019;2019(1):1-14.
- Liu J, Nile SH, Xu G, et al. Systematic exploration of Astragalus membranaceus and Panax ginseng as immune regulators: Insights from the comparative biological and computational analysis. Phytomedicine. 2019;86(1):153077.
- Wang T, Zhou X, Zou W, et al. Synergistic effects of Ginseng CA Mey and Astragalus membranaceus (Fisch.) Bunge on activating mice splenic lymphocytes detected by microcalorimetry and the underlying mechanisms predicted by in silico network analysis. J Therm Anal Calorim. 2018;132(3):1933-1942.
- Siraj FM, Kim YJ, Natarajan S, et al. Ginseng and obesity: Observations from assorted perspectives. Food Sci Biotechnol. 2014;23(4):1007-1016.
- Gu W, Kim KA, Kim DH. Ginsenoside Rh1 ameliorates high fat diet-induced obesity in mice by inhibiting adipocyte differentiation. Biol Pharm Bull. 2013;36(1):102-107.
- Li N, Fan Y, Jia XM, et al. Effect of Astragalus active ingredients on AdipoR1 and AMPK mRNA expression in diabetic rats. J Tradit Chin Med. 2011;26(5):1176-1181.
- Wei Xj, Chen Xh, Weng Xg, et al. Effects of Astragalus Polysaccharides on the Insulin Resistance in Rats. Chinese Journal of Experimental Traditional Medical Formulae. 2011;15.
- Yeo CR, Yang C, Wong TY, et al. A quantified ginseng (Panax ginseng CA Meyer) extract influences lipid acquisition and increases adiponectin expression in 3T3-L1 cells. Molecules. 2011;16(1):477-492.
- Murbach TS, Glávits R, Endres JR, et al. Toxicological evaluation of a mixture of Astragalus membranaceus and Panax notoginseng root extracts (InnoSlim®). J Toxicol. 2019;2019(1):1-14.
- Shao-Ling WA, Ying LI, Ying WE, et al. Curcumin, a potential inhibitor of up-regulation of TNF-alpha and IL-6 induced by palmitate in 3T3-L1 adipocytes through NF-kappaB and JNK pathway. Biomed Environ Sci. 2009;22(1):32-39.
- Ruan H, Dong LQ. Adiponectin signaling and function in insulin target tissues. J Mol Cell Biol. 2016;8(2):101-109.
- Elekofehinti OO, Ejelonu OC, Kamdem JP, et al. Saponins as adipokines modulator: a possible therapeutic intervention for type 2 diabetes. World J Diabetes. 2017;8(7):337.
- Xu A, Wang H, Hoo RL, et al. Selective elevation of adiponectin production by the natural compounds derived from a medicinal herb alleviates insulin resistance and glucose intolerance in obese mice. Endocrinology. 2009;150(2):625-633.
- Mohanan P, Subramaniyam S, Mathiyalagan R, et al. Molecular signaling of ginsenosides Rb1, Rg1, and Rg3 and their mode of actions. J Ginseng Res. 2018;42(2):123-132.
- Jiang B, Yang Y, Jin H, et al. Astragaloside IV attenuates lipolysis and improves insulin resistance induced by TNFα in 3T3?L1 adipocytes. Phytotherapy Research. 2008;22(11):1434-1439.
- Hernández-García D, Granado-Serrano AB, Martín-Gari M, et al. Efficacy of Panax ginseng supplementation on blood lipid profile. A meta-analysis and systematic review of clinical randomized trials. J Ethnopharmacol. 2019;243:112090.
- Miraghajani M, Hadi A, Hajishafiee M, et al. The effects of ginseng supplementation on anthropometric indices and body composition: A systematic review and meta-analysis. J Herb Med. 2020;23:100379.
 Con;
Con; ANS.
ANS.