Research Article - Journal of Neuroinformatics and Neuroimaging (2018) Volume 3, Issue 1
Proposal of classification methods for automated analysis combining data-driven and knowledge-driven approaches in fNIRS study
Obata A1*, Fukui D2, Egi M2, Sutoko S1, Atsumori H1, Funane T1, Nishimura A1 and Kiguchi M1
1Hitachi Ltd., Research and Development Group, Center for Exploratory Research, Akanuma, Hatoyama, Hiki-gun, Saitama, Japan
2Hitachi Ltd., Research and Development Group, Center for Technology Innovation, Yoshida, Totsuka, Yokohama, Kanagawa, Japan
- *Corresponding Author:
- Obata A
Hitachi Ltd., Research and Development Group
Center for Exploratory Research
Japan
Tel:81492966111
E-mail: akiko.obata.rg@hitachi.com
Accepted date: December 03, 2018
Citation: Obata A, Fukui D, Egi M, et al. Proposal of classification methods for automated analysis combining data-driven and knowledge-driven approaches in fNIRS study. Neuroinform Neuroimaging. 2018;3(1):6-11.
Abstract
We propose classification methods combining data-driven and knowledge-driven approaches for automated multivariate analyses in fNIRS study. In the data-driven approach, we did training of brain activity features during a task including those suffering from daily depressive mood using regularized regression, and we obtained several prediction models with high accuracy. In the knowledge-driven approach, we confirmed previously related research findings and classified the availability of each brain activity feature (available or new) in the prediction models. Finally, models were validated, and the results showed that the accuracy using the available features and one new feature was higher than the accuracies using the available features only. A new parameter regarding depressed mood was found using the proposed approach.
Keywords
Data-driven approach, Knowledge-driven approach, Models classification, Optical topography, Depression mood, Working memory.
Introduction
With the emergence of the Internet of Things (IoT), various sensing devices are being exponentially utilized, and advanced data analysis such as artificial intelligence, deep learning, and model simulations are being developed. These data-driven research approaches allow inferences to be told by the “data itself” because prior beliefs are absent, “opening the possibilities of breakthrough insights where nobody had looked before” [1,2]. Karpatne et al. reported on “theory-guided data science (TGDS),” which attempts to take the next stage of knowledge discovery to realize the vision of the “fourth paradigm” fully [3]. They conceptualized the paradigm of “theory-guided data science,” where scientific models are in the process of knowledge discovery. In contrast, the conventional approach of knowledge-driven and theory-based model are limited by our current scientific understanding because data science models show limited performance when data are under-representative [3].
A new imaging technique has been developed for measurements in daily situations. Optical topography (OT) is a non-invasive procedure requiring less subject restraint than functional magnetic resonance imaging (fMRI), positron emission tomography (PET), and magnetoencephalography (MEG) [4]. OT can measure the product of cerebral hemodynamic changes (concentration changes of oxygenated and deoxygenated hemoglobin; ΔC⋅LHbO and ΔC⋅LHHb) and optical path length (L) using the near-infrared spectrum (650-900 nm). According to neurovascular coupling, hemodynamic changes may relate to local neural activity [5-7]. Several studies have been reported in which the OT system measured brain functions under various conditions [7-9]. In advanced OT systems, wearable optical topography that is more compact, flexible, and cost-effective has been developed for use in a wide range of situations [10- 13]. Therefore, simultaneous measurement data including OT data and other human or environmental sensing data have been expanded. Although progress has been achieved in the conventional approach by first generating hypotheses of theories and then collecting data to support or refute these hypotheses, the relationship between OT data and other sensing data is difficult to hypothesize because input data using sensing techniques gradually increase.
As described before, automatic analysis technology based on data-driven analysis provides us with a “statistically dominant analysis model.” We can easily process various sensing data and obtain multivariate analysis models. Despite the usefulness, selecting the best models to suit the hypotheses is difficult because of a heightened risk of data over-fitting, and these models consist of both well-known and new features; therefore, combining both data- and knowledge-driven approaches is necessary. The purpose of this study was to design classification methods for automated analysis combining data-driven and knowledge-driven approaches. These approaches were applied for OT data to obtain new findings.
Materials and Methods
Dataset
Two datasets were collected independently. Dataset 1 was used as training data (N=120, age: 25-52, number of males: 60, number of females: 60), and dataset 2 was defined as test data (N=40, age: 20-59, number of males: 30, number of females: 10). Data from volunteers were obtained according to the standards of the internal review board in the Research and Development Group, Hitachi, Ltd., following receipt of written informed consent.
Experimental protocol
The participants’ mood states were checked using a questionnaire (i.e., Profile of Mood States/POMS) [14], and their depression mood scores were calculated by compensating for their age and sex. The subjects’ brain activity in the prefrontal cortex during spatial and verbal working memory tasks was measured using optical topography (47 channels, ETG-7100, Hitachi Ltd., Japan, Figure 1). The tasks consisted of two delayed matching tasks, one spatial, the other verbal. In the spatial working memory task, participants were asked to encode the position of four red squares among displayed eight squares within 1.5 sec (target stimulus) and to maintain the spatial information for 7 sec. A probe stimulus showing a red square among eight squares was displayed for 2 sec after the maintenance period. Participants needed to respond using a button if the position of the red square in the probe stimulus was identical to two of eight squares in the target stimulus. In the verbal working memory task, as shown in Figure 1b, four Japanese characters in Hiragana were used as the target stimulus, and one Japanese character in Katakana was used as the probe stimulus. Both the targets in Hiragana and the probe in Katakana had the same phonic; however, the shape of both types of characters was different. Thus, participants had to memorize and answer in the verbal working memory task phonologically. Each task was repeated eight times. We used a spatial registration method to speculate on the locations of 47 channels with optical topography in the Montreal Neurological Institute (MNI) space [15,16].

Figure 1: Experimental protocol.
Data analysis
The signal of concentration changes of oxygenated hemoglobin (oxy-Hb) during the verbal working memory task was used for analysis. Analyses were computed using MATLAB (The MathWorks, Inc., USA) and a plug-in-based analysis platform. The Platform for Optical Topography Analysis Tools (POTATo) was developed by Hitachi Central Laboratory, and a tutorial is available [17]. The signal processing procedure including filtering and denoising was performed according to previous working memory studies by Aoki et al. [18] and Sato et al. [19]. As follows their procedure, in detail, the time-continuous data of the oxy-Hb signals for each channel were separated into task blocks, which were defined as 25.5-s periods starting from 1.0 s before Target onset and ending 16.0 s after Probe onset, each containing a WM task trial. We removed blocks contaminated by a motion artifact, which was defined as a raw oxy-Hb signal change larger than 0.4 mM⋅mm over two successive samples (200-ms duration). The remaining data were baseline-corrected by linear regression based on the least squares method by using the data for the first 1.0 s the last 4.0 s of each block.
Finally, the oxy-Hb signal was formatted as 25.5-sec block data with the arithmetic mean. The classification method combining data - and knowledge-driven approaches was performed in three steps.
Dataset 1 was used as training data in step 1, and dataset 2 was used as test data in step 3. Dataset 1 was divided into two groups for training based on the score of 50 POMS_D. Depressionhigh group means were over 50 in the POMS depression. We prepared three datasets for training (dataset 1(a); N=120, dataset 1(b); N=60, dataset 1(c); N=60). Both dataset 1(b) and dataset 1(c) included sixty data consisting of fifteen high depression data and forty-five low depression data. The depression scores between dataset 1(b) and dataset 1(c) were not significantly different (Levene’s test: p=0.515, unpaired t-test, t(113)=1.138, p=0.257).
Step 1: Capturing of brain features regarding depressed mood using the data-driven approach
The significant features of brain activity regarding depressed mood were obtained using the data-driven approach. The features of brain activation defined in previous research were captured automatically [20]. Ten brain features were prepared: “the average value,” “the maximum value,” “the peak value,” “latency,” and “the integral value” during the task period. “The brain mood score” was calculated according to previous reports [21]. They found that brain activity during verbal working memory tasks was significantly affected by depressed mood, in contrast, the brain activity during spatial working memory tasks showed differences that were not statistically significant. Using this phenomenon, they created a parameter regarding subjective depressed mood using the difference in the brain activity between two working memory tasks. The formula is as follows.
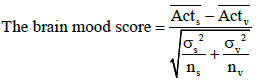
Acts and Actν indicate the average 6-9.5 sec from the block starting point in each spatial (s) and verbal (v) working memory task. σs2 and σν2 represent an unbiased estimator of population variance. ns and nv show task repetition. “The average of 6-9.5 sec from the block starting point” related to POMS depression [18,19], “Z-value of the average 6-9.5 sec from the block starting point.” “The average of 11.4-13.0 sec from the block starting point” related to BDI- II [22]. A correlation between brain activity and BDI- II was found. The “Laterality index” using the average of left and right channels was performed using every two channels in the left BA46 (Ch25–Ch26) and in the right BA46 (Ch22–Ch23) [23]. Next, nine brain function areas were prepared for collecting the brain features in the left Brodmann Area (BA) 46, right BA46, BA10, BA11, left Broca, right Broca, dorsolateral prefrontal cortex (DLPFC), left DLPFC, and right DLPFC. These discriminations were determined according to spatial registration results. Consequently, nine features in each of the 47 channels, in nine brain function areas, and the laterality index were calculated; we obtained over five hundred features. Prediction models of depression-high or -low group were performed using ridge regression analysis with all features. The ridge regression method was adapted to avoid over fitting [24]. This training procedure was repeated three times (dataset 1(a)- (c)) to determine the significance of each feature. The accuracy of the models was evaluated using correctly classified instances. Mean absolute error was shown as the evaluation index of the model accuracy [25].
Step 2: Classification of the availability of brain features using the knowledge-driven approach
The availability of each feature was classified using the knowledge-driven approach. We focused on the frequency of features among the models and selected the high frequency features. In addition, these features were reviewed with previously related findings and classified as available features or new features.
Step 3: Examination of the generalization ability regarding the model using classified features
The generalization ability of the models using these classified features was examined using training data (dataset 1(a)) and test data. The correctly classified instances of the models with nominated features were compared with the results of the training data and test data. The rate of improvement was calculated.
Results
Step 1: Capturing of brain features regarding depressed mood using the data-driven approach
A hundred prediction models regarding depression-high or -low groups were obtained using ridge regression, and we selected the models with correctly classified instances equal to or more than 80%, and with under ten explanatory features. Table 1 shows all features in the selected models. Each model included 4-10 features. Correctly classified instances in the test data were shown to be lower than those in the training data by approximately 20% (Figure 1).
Table 1. Prediction models using data-driven approach.
| Model | Features of brain activity | Brain function area | Channel | Correctly classified instances (%) (Mean absolute error) |
||
|---|---|---|---|---|---|---|
| [Training data] | [Test data] | |||||
| Model 1 | Latency | Left_broca | Ch 17 | 84.16 (0.2758) |
64.1 (0.4089) |
|
| Latency | Right_broca/ba46 | Ch 22 | ||||
| Latency | Ba10/ba46 | Ch 25 | ||||
| The average value | Left_broca | Ch 36 | ||||
| Model 2 | The integral value | Right_broca/ba46 | Ch 22 | 81.66 (0.2751) |
74.35 (0.3928) |
|
| The average value | Right_broca/ba46 | Ch 22 | ||||
| Latency | Ba10/ba46 | Ch 23 | ||||
| Latency | Right_broca | Ch 31 | ||||
| The integral value | Left_broca | Ch 36 | ||||
| The average value | Left_broca | Ch 36 | ||||
| Model 3 | The integral value | Left_dlpfc | Ch 15 | 86.66 (0.2034) |
61.53 (0.3945) |
|
| Maximum value | Right_broca | Ch 22 | ||||
| The average value | Right_broca | Ch 22 | ||||
| Latency | Ba10/ba46 | Ch 23 | ||||
| The average value | Ba10/ba46 | Ch 23 | ||||
| Latency | Right_broca | Ch 31 | ||||
| Latency | Ba10 | Ch 35 | ||||
| The average value | Left_broca | Ch 36 | ||||
| Maximum value | Left_broca | Ch 36 | ||||
| The integral value | Left_broca | Ch 36 | ||||
Two common features among the models are shown in bold. Two common features in two models are shown in italics. The average value indicates “The average during the task period.” The right_broca/BA46 and BA10/BA46 representing both brain function areas were included in the same spatial location. The other brain function area as shown in the table included over 70% of spatial locations.
Step 2: Classification of the availability of brain features using the knowledge-driven approach
As shown in Table 1, each model represented 4-10 features. The high frequency features among the models were selected. Consequently, “The average during the task period” of the left Broca and latency of the right Broca/BA46/BA10 were shown as common features among the three models. The integral value of the left Broca and “The average during the task period” of the right_Broca/BA46 were indicated in two models. Thus, these features were selected and reviewed in previous related findings. In OT studies, the correlation between depressed mood and the average or the integral value was well established in several research findings, in contrast, the latency of the OT signal had fewer findings related to daily depressed mood [26,27]. Finally, the features of the integral value and the average value during the task were classified as available features. One feature, latency, was nominated as a new feature. As shown in Table 2, model 4 was represented by the integral value and the average value. Model 5 was set using the integral value, the average value, and latency.
Table 2. Prediction models using knowledge-driven approach.
| Model | Classification by knowledge | Features of brain activity | Brain function area | Correctly classified instances (%) (mean absolute error) |
||
|---|---|---|---|---|---|---|
| [Training data] | [Test data] | |||||
| Model 4 | Available | The integral value | Left_broca | 80.83 (0.2883) |
69.23 (0.4476) |
|
| The average value | ||||||
| Model 5 | Available | The integral value | Left_broca | 81.66 (0.2738) |
82.05 (0.3712) |
|
| the average value | ||||||
| New | Latency | Right_broca/BA46 | ||||
| Ba10/ba46 | ||||||
Step 3: Examination of the generalization ability regarding the model using classified features
Prediction model 4 and model 5 regarding the depression-high or -low group in the training data and test data were examined using ridge regression (Table 2). In the test data, correctly classified instances in model 4 using the integral and the average value were shown to be 69.23%. A new feature (latency) was added to model 5, and 82.05% of instances were correctly classified. As a result, an approximately 13% improvement was observed (Figure 2). In the training data, over 80% of instances in model 4 and model 5 were correctly classified. Finally, in model 5, no differences in the percentage of correctly classified instances of training data and test data were found. We found latency as a new feature and compared the latency of depression-high and low groups. The latency of the depression-high group was longer than that of the depression-low group (Levene’s test: p<0.005, Welch-test, t(64.568)=2.338, p<0.05).

Figure 2: Comparison of correctly classified instances of each prediction model with training data and test data. Correctly classified instances in model 1–model 3 show the average of the three models in Table 1. Model 4 includes the available features, and model 5 includes the available and new features.
Discussion
We herein propose the classification method of the OT analysis data and its combination of the data- and knowledge-driven approaches.
This new approach has three steps. In the first step of our experiment, the significant brain features related to depressed mood were captured using the data-driven approach (Table 1). Through this step, over five hundred features regarding depressed mood were captured. However, each model has various significant features; we have to choose and explain the results. Thus, the three models were selected using correctly classified instances (over 80%) and a number of explanatory features (max: ten features). As shown in Table 1, the percentage of correctly classified instances of the test data was lower than that of the training data. This suggests that each model of training data has important features or new findings or overfitting of features. Therefore, the knowledge-driven approach is necessary.
In the second step, these features were classified as either available features or new features using the knowledge-driven approach. In Table 1, the average value and the latency are shown among three models. Also, the integral value is shown between two models. The results suggest that these features are related to depressed mood. However, the results do not tell us which features are the most important, which findings are new, or what the most suitable explanation is regarding depressed mood. In this step, previous research findings related to each feature were reviewed, and the availability of each feature was classified. As a result, although the integral value and the average value were defined as the available features because of the previous findings, few articles regarding depressed mood and NIRS studies covered latency. Thus, latency was classified as a new feature. Finally, model 4 (available features) and model 5 (available and new features) were obtained using step 1 and step 2.
In the third step, the generalization ability of model 4 and model 5 including classified features were examined. Over 80% of classified instances of model 4 and model 5 were correct in the training data. The same was true for model 1-3, suggesting that these features included in each model are highly correlated with depressed mood. In the test data, correctly classified instances in model 5 were found to be higher than those in model 4. This suggests that model 5 included latency as one of the important features regarding depressed mood. Model 5 was shown to have higher generalization ability than model 4. If the percentage of correctly classified instances in model 5 was shown to be less than that of model 4, latency was judged to be an ungeneralized feature. The data-driven approach gives us numerous significant features including available, new, and temporary fittings related to the response variables in some cases. Therefore, generalizing other data is difficult. Using the combining data-driven and knowledge-driven approaches, we found that latency was one of the new features related to depressed mood. In some studies, participants with depression had different cognitive and attentional bias. Because their attentional and cognitive processing are stacked when they look at negative information, they have trouble shifting their attention away from the information. Thus, the bias affects their cognitive processes [28,29]. Neuroimaging research found they have inner processing regarding bias related to DLPFC activation [30]. In this experiment, although meaningless verbal characters were used, it was suggested that the participants with high depressed mood have had a specifc bias. Hence, the latency of the highdepression group was longer than that of the low-depression group. Further research is needed, though. Several limitations of our study need to be considered. We used information on related research findings as the knowledge-driven approach, however, other knowledge can be used, such as the consistency of the hypothesis or other statistical parameters which used in previous researches. It might generate a knowledge index to classify the features and help us to judge prediction models.
The data-driven approach provides us with numerous significant models automatically; however, we have to choose and explain the value of the results, such as their importance, suitability, and novelty. Our proposal method, the combined data- and knowledge-driven approach, was useful in classifying the availability of features and evaluation of models. Besides the commonness of features, we need to determine more specified methods in future work.
References
- Shih W, Sen C. Data-Driven vs. Hypothesis-Driven Research: Making Sense of Big Data. Academy of Management Proceedings. 2016;1:14843.
- Paul VH. Data-driven hypotheses. EMBO reports. 2013;14:104.
- Karpatne A, Gowtham A, James H, et al. Theory-Guided Data Science: A New Paradigm for Scientific Discovery from Data. IEEE Transactions on Knowledge and Data Engineering. 2017;29:2318-31.
- Villringer A, Chance B. Non-Invasive Optical Spectroscopy and Imaging of Human Brain Function. Trends Neurosci. 1997; 20:435-42.
- Jobsis FF. Noninvasive, Infrared Monitoring of Cerebral and Myocardial Oxygen Sufficiency and Circulatory Parameters. Sci. 1977;198:1264-67.
- Villringer A, Planck J, Hock C, et al. Near Infrared Spectroscopy (NIRS): A New Tool to Study Hemodynamic Changes during Activation of Brain Function in Human Adults. Neurosci Lett.1993;154:101-4.
- Maki A, Yamashita Y, Ito Y, et al. Spatial and Temporal Analysis of Human Motor Activity Using Noninvasive NIR Topography. Med Phys. 1995;22:1997-2005.
- Yamashita Y. Near-Infrared Topographic Measurement System: Imaging of Absorbers Localized in a Scattering Medium. Rev Sci Instrum. 1996; 67:730-2.
- Koizumi H, Yamashita Y, Maki A, et al. Higher-order brain function analysis by trans-cranial dynamic near-infrared spectroscopy imaging. J Biomed Opt. 1999;4:403-13.
- Atsumori H, Kiguchi M, Katura T, et al. Noninvasive Imaging of Prefrontal Activation during Attention-Demanding Tasks Performed While Walking Using a Wearable Optical Topography System. J Biomed Opt. 2010;15: 046002.
- Atsumori H, Kiguchi M, Obata A, et al. Development of Wearable Optical Topography System for Mapping the Prefrontal Cortex Activation. Rev Sci Instrum. 2009; 80:043704.
- Funane T, Kiguchi M, Atsumori H, et al. Synchronous Activity of Two People’s Prefrontal Cortices during a Cooperative Task Measured by Simultaneous near-Infrared Spectroscopy. J Biomed Opt. 2011;16:077011.
- Obata A, Katura T, Atsumori H, et al. Evaluating the Attention Devoted to Memory Storage Using Simultaneous Measurement of the Brain Activity and Eye Movements. in HCI International 2013 - Posters’ Extended Abstracts. C, Stephanidis, Ed., pp. 447-449. Communications in Computer and Information Science. Springer Berlin Heidelberg, 2013.
- Curran SL, Andrykowski MA, Studts JL. Short Form of the Profile of Mood States (POMS-SF): Psychometric Information. Psychol Assess. 1995;7:80-83.
- Okamoto M, Tsuzuki D, Clowney L, et al. Structural Atlas-Based Spatial Registration for Functional near-Infrared Spectroscopy Enabling Inter-Study Data Integration. Clin Neurophysiol. 2009;120:1320-28.
- Singh AK, Okamoto M, Dan H, et al. Spatial Registration of Multichannel Multi-Subject FNIRS Data to MNI Space without MRI. NeuroImage. 2005; 27: 842-51.
- Sutoko S, Sato H, Maki A, et al. Tutorial on Platform for Optical Topography Analysis Tools. Neurophotonics. 2016; 3:010801.
- Aoki R, Sato H, Katura T, et al. Relationship of negative mood with prefrontal cortex activity during working memory tasks: An optical topography study. Neurosci Res. 2011;70: 189-96.
- Sato H, Aoki R, Katura T, et al. Correlation of Within-Individual Fluctuation of Depressed Mood with Prefrontal Cortex Activity during Verbal Working Memory Task: Optical Topography Study. J Biomed Opt. 2011;16:126007.
- Egi M, Fukui D, Katura T et al. H-2-37. Proceedings of IEICE General Conference 2017.
- Aoki R, Sato H, Katura T, et al. Prefrontal Activity during Non-emotional Working Memory Tasks Reflects Individual Differences in Depressive Mood: an Optical Topography Study. NeuroImage. 2009; 47:S187.
- Beck AT, Steer RA, Ball R, et al. Comparison of Beck Depression Inventories -IA and -II in Psychiatric Outpatients. J Personality Assess. 1996; 67:588-97.
- Watanabe E, Maki M, Kawaguchi F, et al. Non-Invasive Assessment of Language Dominance with near-Infrared Spectroscopic Mapping. Neurosci Lett. 1998; 256:49-52.
- de Vlaming R, Groenen P J F. The Current and Future Use of Ridge Regression for Prediction in Quantitative Genetics. Biomed Res Int. 2015:143712.
- Willmott CJ, Matsuura K. Advantages of the mean absolute error (MAE) over the root mean square error (RMSE) in assessing average model performance. Clim Res. 2005;30:79-82.
- Kawano M, Kanazawa T, Kikuyama H, et al. Correlation between Frontal Lobe Oxy-Hemoglobin and Severity of Depression Assessed Using near-Infrared Spectroscopy. J Affective Disord. 2016; 205:154-8.
- Zhang H, Wentian D, Weimin D, et al. Near-Infrared Spectroscopy for Examination of Prefrontal Activation during Cognitive Tasks in Patients with Major Depressive Disorder: A Meta-Analysis of Observational Studies. Psychiatry Clin Neurosci. 2015;69:22-33.
- Beck AT. The Evolution of the Cognitive Model of Depression and Its Neurobiological Correlates. Am J Psychiatry. 2008;165: 969-77.
- Beevers CG. Cognitive Vulnerability to Depression: A Dual Process Model. Clinical Psychology Review. 2005; 25: 975-1002.
- Disner SG, Beevers CG, Haigh EAP, et al. Neural Mechanisms of the Cognitive Model of Depression. Nature Reviews. Neurosci. 2011;12:467-77.