Research Article - Biomedical Research (2017) Volume 28, Issue 22
Preprocessing and signal processing techniques on genomic data sequences
Muhammaed Talha Naseem1, KR Aravind Britto2, Mustafa Musa Jaber3, M Chandrasekar4, VS Balaji4, G Rajkumar4, K Narasimhan4 and V Elamaran4*
1King Saud University, Saudi Arabia
2Department of Electronics and Communication Engineering, PSNA College of Engineering and Technology, Dindigul, India
3Nabu Research Academy, Kulua Lumper, Malaysia
4Department of Electronics and Communication Engineering, School of Electronics and Electrical Engineering, SASTRA University, Thanjavur, India
- *Corresponding Author:
- V Elamaran
Department of Electronics and Communication Engineering
School of Electronics and Electrical Engineering
SASTRA University, India
Accepted on January 16, 2017
Abstract
The demand for genomic signal processing is growing drastically due to the importance of human genetics and allied sciences. This paper exemplify the genomic signal processing through handling gene data sequence from gene data bank, converting them in to sequences, transforming them in to frequency domain, spectrogram visualization and analysis in detail. The frequency domain conversion from the time domain gene sequence is carried out using Goertzel algorithm instead of conventional fast Fourier transform (FFT). This algorithm requires only few resources as compared to the conventional FFT method. The spectrogram of the patients who are affected with Ebola virus is also plotted for further analysis. This would produce the power spectrum (y-axis) versus the time (x-axis) results. All simulation results are obtained using Matlab and Simulink software tools.
Keywords
Gene data bank, Genomic signal processing, Goertzel algorithm, Matlab, Simulink, Spectrogram.
Introduction
The most real world signals are continuous by nature; however the genomic data exists in the form of discrete. DNA (deoxyribonucleic acid) molecules and proteins are available in the form of sequences [1]. A, C, G and T are the four types of proteins which form a genomic information. The distribution of these protein sequences in gene data would provide the information about the characteristics and important information of the genome like the difference between normal and abnormal persons [2]. In recent years, the genomic signal processing field becomes more popular since these genomic sequences are available in the public domain and can be handled easily for our research work [3]. In general, genes are copied into Ribonucleic acid (RNA) and then the proteins are made from these RNAs. The former one is named as “transcription” and the later one is referred to as “translation”. The proteins are made from these messenger RNA (mRNA) transcripts. These two steps are most fundamental to all of life on earth and become the sole formula in the field of molecular biology as in Figure 1A [4]. Digital signal processing plays a vital role in the field of genomics and proteomics for better analysis of the gene data. The processing of genomic signals i.e., genomic signal processing becomes a most wanted engineering discipline in the current trend. The genomec contains an entire set of DNA with all the genes. DNAs are represented by either chain or sequence of nucleotides which are fundamental body of a genome. Since the length of the DNA is much higher, the genome problems are complex [2,3].

Figure 1a: Transcription and translation in molecular biology.
The Fourier spectra of protein-coding regions of DNA indicate that there is a peak at 2π/3 frequency and hence the name called period-3 property. This period-3 property can be also used to predict a gene in the sequence. The identification of coding regions would be the primary step to predict a gene [4]. The Discrete Fourier Transform (DFT) or fast Fourier transform (FFT) is often used to identify these peaks and in turn to identify an exons in a gene sequence. The digital filters too can be applied to predict gene and identify the protein coding regions. The adaptive signal processing and algorithms like least mean square (LMS), recursive least square (RLS), and fast-RLS are also used for gene prediction as well as to remove the back ground noise [5]. Gene prediction is one kind of popular application in which signal processing techniques are dominant. Notch filters are used to remove 1/f noise, which are common in the genomic data sequence because of the very high correlation between base pairs. To improve the stop-band attenuation, these filters can be implemented in multi-stages i.e., multistage anti-notch filters. Applications of bioinformatics through signal processing are plenty and growing tremendously. For example, observing the portion from a genomic sequence in a crime scenario, which can be compared to all possible suspects with highest number of individual matches within the given sequence [4].
Materials and Methods
The preprocessing steps for the gene data sequence, spectrum of gene data, spectrogram and Goertzel algorithm to analyze the frequency domain are explained in this section in detail.
Genomic signal pre-processing steps
The genomic data sequences of patients who are affected from Ebola virus are collected from the gene data bank for processing. For example, the genome sequence is given as:
GGTGTTAGGGTGGTAACTTGAGAGAGCCCCCTACCGC TTTTGAATAGATTTTAAGTGTTCTCTTGCAGAACTTTG AACTTAAATAAAAGCCCTGTCTGGGGGGAAATGTTTC CCGTTTTTATATATATATTTGCGCGGGCCCCTCGTTCTTT GCAGAACTTTGATTTA………
The American Standard Code for Information Interchange (ASCII) codes of characters A, C, G, and T are obtained from the sequence as 65, 67, 71, and 84 respectively [1]. Then they are converted in to numbers as 0, 1, 2, and 3 for easy processing. The signal processing techniques can be applied to these binary data (2-bits). These steps are shown in Figure 1B and the corresponding Matlab script is shown in Figure 2. The first 100 samples of genomic data sequence from a patient (“EU338380v1.fa”) are plotted in Figure 3.

Figure 1b: Preprocessing steps for genomic signal processing.

Figure 2: Matlab script of handling genomic data sequences.

Figure 3: The first 100 samples of a genomic sequence.
Spectrum of genomic data sequences
The Fourier transforms are applied to four genomic data sequences, namely “EU338380v1.fa”, “FJ6215584v1.fa”, “AF499101v1.fa”, and “KM233055v1.fa” and the results are plotted in Figure 4. These are collected from the patients who are affected with Ebola virus. The corresponding sequences have length 18875, 188836, 18960, and 18878. The suitable length (215=32768) is applied to determine FFT of the sequences [6-9].

Figure 4: Spectrum of genomic data sequences.
The results indicate that the peaks are appeared at k=5463, 5463, 5462, and 5461. The peaks are also appeared at k=27307, 27307, 27308, and 27309 based on the conjugate symmetry property. These findings are shown in Figure 5 for the four sequences.

Figure 5: Spectrum (FFT) peaks.
Spectrogram of genomic data sequences
Spectrogram is the plot of power spectrum (y-axis) versus time (x-axis). The power spectrum varies with respect to frequencies at a particular time. So, the spectrogram becomes a 3-D plot using 2-D [10]. The spectrograms for the four patient genomic data sequence are plotted in Figure 6. The spectrogram is often used for applications like to analyze speech, music, seismology, and sonar signals.

Figure 6: Spectrograms of four genomic data sequences.
Results of Frequency Analysis Using Goertzel algorithm
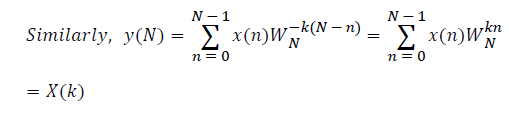
The sampled version of the discrete time Fourier transform (DTFT) becomes DFT of the input sequence. Thus, the N-point DFT of the sampled data sequence is expressed as follows in Equation 1.
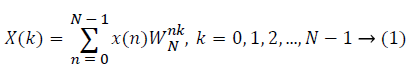
where x(n) is the input data and WN = e–j2π/N is the twiddle factor. This equation requires 2N(N–1)N additions and 2N2 multiplications and hence the conventional DFT is not handy for the larger set of input samples [11-13]. This can also be computed using Goertzel algorithm in Equation 2 and is shown in Figure 7.

Figure 7: DFT computation using Goertzel algorithm.
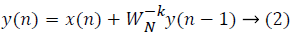
This algorithm is summarized as follows:
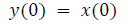
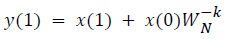
DFT of the sequence: {4, 2, 6, 7}
This algorithm is exemplified with the sampled data sequence {4, 2, 6, 7} and the 4-point DFT of this sequence becomes {19, –2+j5, 1, –2–j5}. The Tables 1 and 2 describe the results of DFT at k=0 and k=1.
| n | x(n) | W4-0y(n-1) | y(n)=x(n)+y(n-1)W4-0 |
|---|---|---|---|
| 0 | 4 | 1 × 0=0 | 4 |
| 1 | 2 | 1 × 4=4 | 6 |
| 2 | 6 | 1 × 6=6 | 12 |
| 3 | 7 | 1 × 12=12 | 19 |
| 4 | 0 | 1 × 19=19 | 19 |
Table 1. DFT at k = 0.
| n | x(n) | W4-1y(n-1)=jy(n-1) | y(n)=x(n)+y(n-1)W0-1 |
|---|---|---|---|
| 0 | 4 | j × 0=0 | 4 |
| 1 | 2 | j × 4=4 | 2+j4 |
| 2 | 6 | j × (2+j4)=4+j2 | 2+j2 |
| 3 | 7 | j × (2+j2)=-2+j2 | 5+j2 |
| 4 | 0 | j × (5+j2)=-2+j5 | -2+j5 |
Table 2. DFT at k = 1.
Goertzel algorithm using simulink
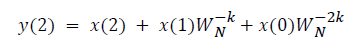
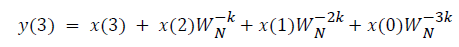
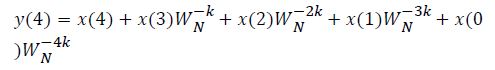
This algorithm is again demonstrated with the sampled data sequence {4, 2, 6, 7, 4, 2, 6, 7}; the 8-point DFT of this sequence becomes {38, 0, –4+j10, 0, 2, 0, –4–j10, 0}. The Figures 8 and 9 show the results of DFT at k=2 and k=4 using Simulink tool as –4+j10 and 2 respectively. Note that W8 –2 = j and W8 –2 = –1 are used for the computation of X(2) and X(4) respectively. Figure 10 shows the result at k = 7 with W8–7 =– 0.7071 + 0.7071j.a

Figure 8: DFT computation at k=2.

Figure 9: DFT computation at k=4.

Figure 10: DFT computation at k=7.
Goertzel algorithm applied to the genomic sequence
This algorithm is applied to the genomic sequence and frequency analysis is done with few resources compared to the direct DFT method which requires more number of additions and multiplications [14]. The DC and Fs/2 components of a genomic data sequence are displayed in Figures 11 and 12 using Matlab and Simulink respectively. The FFT length used here is 32768.

Figure 11: The DC and Fs/2 components of a genomic data sequence.

Figure 12: Fs/2 component of a genomic data sequence.
Conclusions
This paper demonstrates the preprocessing steps involved in genomic signal processing in detail using Matlab tool from the given sequence of Ebola virus affected patients. The frequency contents of a given sequence are analyzed by applying FFT and the spectrum results are plotted. The spectrogram charts are done to analyze the power spectrum versus frequency with respect to time. Finally, Goertzel algorithm is used to provide DFT computations with one delay element and one multiplier. This work can be further extended to gene prediction using digital filters, background noise removal and 1/f noise removal etc. [15-19].
References
- Shmulevich I, Dougherty ER. Genomic Signal Processing. Princeton University Press, USA, 2007.
- Anastassiou D. Genomic Signal Processing. IEEE Signal Processing Magazine 2001.
- Vaidyanathan PP. Genomics and proteomics: a signal processor’s tour. IEEE Circuits Syst Magazine 2004; 4: 6-29.
- Sharma R, Sharma N, Kaushish D. Genes Detection using Window Technique. Int J Appl Eng Res 2012; 7: 1-3.
- Rivard SR, Mailoux JG, Beguenane R, Bui HT. Design of high-performance parallelized gene predictors in Matlab. BMC Res Notes 2012; 5: 1-10.
- Proakis JG, Monalakis DG. Digital Signal Processing: Principles, Algorithms, and Applications. Pearson Education 2006.
- Ifeachor EC, Jervis BW. Digital Signal Processing: A Practical Approach. 2nd Ed, Prentice Hall, India, 2002.
- Kaushik CSH, Gautam T, Elamaran V. A Tutorial Review on Discrete Fourier Transform with Data Compression Application. Proceedings of the IEEE Int Confer Green Comput Commun Elect Eng (ICGCCEE-2014), 2014.
- Semmlow JL. Biosignal and Medical Image Processing. CRC Press, 2014.
- Owen M. Practical Signal Processing. Cambridge University press, 2007.
- Prandoni P, Vetterli M. Signal Processing for Communications. EPFL Press 2008.
- Vaidyanathan PP, Yoon BJ. The role of signal processing concepts in genomics and proteomics. J Franklin Institute 2004; 341: 111-135.
- Mitra SK. Digital Signal Processing - A Computer Based Approach. 3rd Ed, Mc-Graw Hill, 2007.
- Cristi R. Modern Digital Processing. Brooks/Cole publishers, 2004.
- Naveena R, Rabecka VD, Rajkumar G, Elamaran V. Understanding Digital Filters from Theory to Practice using Matlab and Simulink. Int J Pharmacy Technol 2015; 7: 9923-9934.
- Vaidyanathan PP, Yoon BJ. Digital filters for gene prediction applications. Proceedings in IEEE Asilomar Conference on Signals, Systems, and Computers, 2002.
- Elamaran V, Rajkumar G. FPGA implementation of point processes using Xilinx System Generator. J Theor Appl Informa Technol 2012; 41: 201-206.
- Elamaran V, Praveen A, Reddy MS, Aditya LV, Suman K. FPGA Implementation of Spatial Image Filters using Xilinx System Generator. Procedia Eng 2012; 38: 2244-2249.
- Elamaran V, Abhiram K, Reddy NBP. FPGA Implementation of Audio Enhancement using Xilinx System Generator. J Appl Sci 2014; 14: 1972-1977.