Research Article - Research and Reports on Genetics (2018) Volume 2, Issue 2
Potential of genetic association between age groups as selection criteria for genetic improvement of body weight gain in local chicken.
Gwaza DS*, Dim NI, Momoh OM
Department of Animal Breeding and Physiology, University of Agriculture, Makurdi, Nigeria
- *Corresponding Author:
- Gwaza DS
Department of Animal Breeding and Physiology
University of Agriculture
Nigeria
Tel: +23408036808979
E-mail: gwazadeeve@yahoo.com
Accepted Date: April 23, 2018
Citation: Gwaza DS, Dim NI, Momoh OM. Potential of genetic association between age groups as selection criteria for genetic improvement of body weight gain in local chicken. J Res Rep Genet. 2018;2(2):15-21
Abstract
The study was conducted at Akpehe farm, Makurdi. Nigeria. Seven hundred day old chicks produced from mattings of local chicken ecotypes were raised to age at first egg. The objectives of the study were to provide information on genetic and phenotypic association of body weight at various ages. Body weight at hatch and at week one were highly correlated due to influence of common maternal effects. There was strong genetic correlation between body weight at week four and eight, eight and twelve, twelve and sixteen and week eight and twenty. The common maternal effects at hatch and lower age had evened out, giving room for the additive genetic variation that were either suggestive at lower ages or were in cells that do not enhance their full expression, or found themselves in cells that demanded their full expressions due to mitotic cell multiplications. Selection can be applied to eight week body weight to exploit it association with body weight at weeks twelve, sixteen, twenty and that at maturity.
Keywords
Age-group, Body-weight, Genetic-association, Local-chicken, Selection-criteria.
Introduction
Correlation can be phenotypic, genotypic or environmental. Phenotypic correlations among traits can be defined as the gross correlation that compares both the genetic and environmental portions of the covariance. It is the observed correlations between two traits that include genetic and environmental factors. Phenotypic correlations among traits are important because they directly affect size of selection differentials and this is severe when the correlations are negatively or positively high. Genetic correlation is the genetic association of one trait with others. It is the correlation between the additive breeding values of two traits. Genetic correlation among traits is demonstrated when the same gene or closely linked genes affect the said traits. Thus, genetic correlation may be caused by pleitropy or genes whose effects are suggestive at some points and fully expressed their potentials at other points.
Analysis of variance and Covariance procedures are used to estimate genetic and phenotypic correlations among traits. Variance and covariance components are derived; the mean squares and mean cross products are equated with their expectations and then solved for each variance and covariance fraction [1]. Genetic correlation (rg) and phenotypic correlation (rp) can then be estimated. Genetic correlation ranges between -1 and +1. It could be described as positive or negative, high or low. A positive genetic correlation between two traits implies that selection for improvement in one trait result in the improvement of the other even though direct selection for its improvement has not been practiced. When negative genetic correlation is the case, selection for improvement of one trait, results in a decline in the other trait to which it is genetically correlated. Low genetic correlation is an indication that probably very few of the same genes affect the two traits. Kinney [2] reported several correlation estimates among production traits such as correlation of egg number and egg weight, age at sexual maturity, egg weight and body weight. He reported negative phenotypic correlations of egg number and egg weight of close to zero for white Leghorn and Fayoumi population (-0.15 + 0.20 and -0.31 + 006).
Positive genetic correlation between hatch weight and body weight gain at weeks 1,4,8,12 and 16 in local chickens were reported by Gwaza et al. [3]. Strong positive genetic correlation between weeks 4 and week 1, week 4 and 8, weeks 8 and 12, weeks 12 and 16 were also reported by Gwaza et al. [3]. The phenotypic correlation was also positive and strong. Body weight gain at week 12 and 16 had high phenotypic correlation (0.91) following that at weeks 8 and 4 (0.94), Gwaza et al. [3].
Materials and Methods
About 600 day old chicks were used to evaluate growth traits such as Hatch weight Average weekly weight, gain to six weeks Individual weekly weight gain from 6 weeks to age at first egg. Weekly growth rate (T) was estimated by the relationship below
T 100 [(W2–W1)/(Time)]
Where
W1=Average initial weight
T=Growth rate/week
W2=Average final weight.
Measurement of growth performance
Daily body weights gain was taken from day 1 to 4 weeks; at weeks 6, 8, 12, 16, and 20. At day 1 to 5 weeks of age, a sensitive 500 g digital balance was used for weighing the chicks. At 6 to 8 weeks, the 4 kg capacity kitchen scale was used, while the 10 kg capacity kitchen scale was used at 12 to 25 weeks.
Average daily weight gain/growth rate
This was estimated from the relationship below
DWG=W2–W1/28, 30, 31, 7
Or
WWG=W2–W1/7
Where DWG=Daily weight Gain
W2=Final weight in the month/week
W1=Initial weight in the month /week.
WWG=Daily weight Gain/week
7, 28, 30, 31=Number of days in the week and months.
Data collection and analysis
Body weights: Data collected on body weight at hatch (0 week), 1 week, 2 weeks, 3 weeks , 4 weeks, 8 weeks, 12, 16 weeks and twenty weeks of age were analyzed using analysis of variance in a completely randomized design. Figure 1. The generalized linear model procedure of statistical analysis system (SAS) [4] was used following the models below.

Figure 1: Slope of the regression line for prediction of body weight at week 1 from hatch weight in the Fulani ecotype.
Body weight gain from day old–1 week, weeks 4, 8, 12, 16 to 20 of age:
Yijk=μ+Ei+eij
Where
Yij=Body weight of the ith individual in the jth ecotype
μ=Population mean.
Ei=effect of the ith ecotype (1,2).
Eij=residual random error.
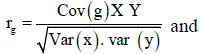
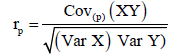
Genetic and phenotypic correlation: Analysis of variance and Covariance procedures were used to estimate genetic and phenotypic correlations among traits. Variance and covariance components were derived; the mean squares and mean cross products were equated with their expectations and then solved for each variance and covariance fraction. Genetic correlation (rg) and phenotypic correlation (rp) were then estimated from the formula below.
 respectively.
Where: Cov (XY) is the estimate of genetic (G) or phenotypic (p) covariance between characters x and y, var (X) and var (Y) are the estimate genetic (G) or phenotypic (P) variance of character X and Y respectively.
Prediction of body weight: Body weight at weeks 1,4, 8, 12, 16 and 20 were predicted from hatch weight, weight at week 1,4 and that at week 8 through a regression analysis.
The regression equation.
Results
Prediction of body weight at week 1 from hatch weight
The regression equations that predicted body weight at week 1 were Y=1.0543x+7.1218 for the Fulani ecotype with high coefficient of determination (R2) of 0.7326 (Figure 2). The regression equation that predicted body weight at week 1 for the Tiv ecotype was Y=0.9045x +32.835 with the coefficient of determination (R2 0.3732) (Figure 3).

Figure 2: Slope of the regression line for prediction of body weight at week 1 from hatch weight in the Tiv ecotype.

Figure 3: Slope of the regression line for prediction of body weight at week 4 from hatch weight in the Fulani ecotype.
Prediction of body weight at week 4 from hatch weight
Body weight at week 4 was predicted from hatch weight of the Fulani ecotype by the regression equation Y=1.2807x +7.1218 with a coefficient of determination (R2) of 0.1651 (Figure 4). While that for the Tiv ecotype was Y=1.4627x +128.57 with the coefficient of determination (R2) of 0.1424 (Figure 5).

Figure 4: Slope of the regression line for prediction ofbody weight at week 4 from hatch weight in the Tiv ecotype.

Figure 5: Slope of the regression line for prediction of body weight at week 8 from body weight at week 4 in the Fulani ecotype.
Prediction of body weight at week 12 from 8 weeks body weight
The regression equation that predicted body weight at week 12 for the Fulani ecotype from 8 weeks body weight was Y=1.9393x +114.69 with the coefficient of determination (R2) of 0.7577 (Figure 6). While that for the Tiv ecotype was Y=1.2108x +404.87 with the coefficient of determination (R2 of 0.865) (Figure 7).

Figure 6: Slope of the regression line for prediction of body weight at week 8 from body weight at week 4 in the Tiv ecotype.

Figure 7: Slope of the regression line for prediction of body weight at week 12 from body weight at week 8 in the Fulani ecotype.
Prediction of body weight at week 16 from 8 weeks body weight
The prediction of 16 weeks body weight from 8 weeks body weight was done by the regression equation Y=1.8247x +182.54 with the coefficient of determination (R2) of 0.5096 (Figure 8) for the Fulani ecotype. The regression equation that predicted 16 weeks body weight from 8 weeks body weight of the Tiv ecotype was Y=0.7339x + 577.09 with a coefficient of determination (R2 ) of 0.2006 (Figure 9).

Figure 8: Slope of the regression line for prediction of body weight at week 12 from body weight at week 8 in the Tiv ecotype.

Figure 9: Slope of the regression line for prediction of body weight at week 16 from body Weight at week 8 in the Fulani ecotype.
Prediction of body weight at week 20 from 8 weeks body weight
The regression equation that predicted body weight at week 20 for the Fulani ecotype from 8 weeks body weight was Y=2.3936x +187.43 with the R2 value of 0.5911 (Figures 10 and 11). The twenty weeks body weight of the Tiv ecotype had a correlation that was not significant with 8 weeks body weight.

Figure 10: Slope of the regression line for prediction of body weight at week 16 from body Weight at week 8 in the Tiv ecotype.

Figure 11: Slope of the regression line for prediction of body weight at week 20 from body Weight at week 8 in the Fulani ecotype.
Discussion
Prediction of body weight at various ages of the local chickens
The high coefficient of determination (R2) 0.7326 indicated the accuracy of the prediction. This was because the advantages of hatch weight were carried on up to week 1. Molenaar et al. [5] also made similar observation. Prediction of body weight at week 4 from hatch weight had a low coefficient of determination in the two ecotypes. This indicated the uncertainty of the prediction. The inherent factors which determine egg size, that in turn, affected hatch weight and body weight at early ages began to give room to the genetic potential of the birds in this trait. Ohagenyi et al. [6] reported similar observation .The variations in the coefficient of determination between the ecotypes indicated that there were genetic differences between the ecotypes.
The high coefficient of determination of the regression equation predicting 12 weeks body weight from 8 weeks implied that, there was more additive genetic influence on this trait at these ages than environmental influence, or some gene pairs were suggestive at week eight, but were able to express their potentials fully at sixteen weeks when the cells into which their full expressions were created by mitotic cell division. Ndofor-Foleng et al. [7] also reported similar observation. The high coefficient of determination of the regression predicting 16 weeks body weight from 8 weeks body weight of the ecotypes indicated the accuracy of the prediction for the Fulani ecotype. This indicated the influence of similar gene pairs on body weight at these ages. In the Tiv ecotype however, the low coefficient of determination indicated low relationship. This may be because different gene pairs and path ways influenced body weight at the different ages. Sewalem et al. and Adedeji et al. [8,9] also reported the influence of different genes at two ages while other genes affected body weight gain at all the ages.
Prediction of 20 weeks body weight from 8 weeks body weight of the ecotypes indicated the accuracy of the prediction for the Fulani ecotype. This indicated the influence of similar gene pairs on body weight at this ages. Again the report of Sewalem et al. [8] agreed with this observation. Among the Tiv ecotype, there was insignificant correlation between these ages. This may indicate that, different gene pairs were involved at the different ages. Or similar gene pairs express themselves differently at different ages in different cells. Sewalem et al. [8] reported similar observation.
The coefficients of determination for prediction of body weight at 12, 16 and 20 weeks of age from body weight at 8 weeks of age translated to a high genetic correlation between these ages. Sewalem et al. and Adedeji et al. [8,9] have reported similar observation. The observed effect may be due to pleitropic and linkage effect of genes. Selection for body weight in the Nigerian local chicken could be based on body weight at 8 weeks to reduce cost. The significant univariate and multivariate test on differences in daily body weight gain between the ecotypes indicated that daily body weight gain at weeks 2,3,5,6,7,8 and 9 can be used to characterize between the ecotypes. Daguma [10] also reported that weekly body weight gain can be used to characterize local chickens of Ethiopia. The significance of squared Mahalanobis distance (D2) on daily body weight gain indicated significant genetic distance between the ecotypes. It also indicated that these populations have been isolated. Daguma [10] had reported similar observation.
Genetic and Phenotypic correlations of growth traits
The genetic correlation between hatch weight and most other traits were low. Dana et al. (2010) also reported low genetic correlation between hatch weight and other body weight gain traits. Genetic correlation ranged from 0.50 Body weight at week 1 with Body weight at week 16, to 0.91 (Body weight at week 12 with Body weight at week 16) and phenotypic correlations from 0.29 (Body weight at week 1 with Body weight at week 16) to 0.84 (Body weight at week 4 with Body weight at week 8) observed in this study was lower than the Adedeji et al. [9].. Again this could be due to breed, environment and management differences. Body weights up to 16 weeks of age can be used to characterize the growth rate of local chicken. Selection for rapid early growth at market age (40-50 days) has been the common approach in broiler chicken breeding programmes [11]. This result showed that body weight at 16 weeks of age has a positive correlation with growth rate up to 12 weeks of age. The correlations were very strong with certain growth traits (rG=0.82 with Body weight at week 8, and 0.91 with Body weight at week 12). Since the local chickens could be reared both for meat and egg production, selection at four, eight, twelve and sixteen weeks of age could be able to improve growth rate at maturity [12].
Conclusion and Recommendation
Conclusion
There were high genetic and phenotypic association between body weight gain at four weeks and that at eight weeks. Body weight at eight weeks also had strong genetic and phenotypic association with body weight at week sixteen. Body weight at week twelve also had strong genetic and phenotypic association with body weight at week sixteen.
Recommendation
Selection for genetic improvement of body weight at week sixteen can be achieved by selecting superior birds on body weight at weeks four, eight and twelve. To minimize cost of rearing and maintenance of inferior birds, selection for body weight gain at maturity will be achieve by selecting superior birds on body weight at eight or twelve weeks for genetic improvement.
References
- Dana NEH, Vander W, Johan AM, et al. Genetic and phenotypic Parameter estimates for body Weight in Horro chicken of Ethiopia. Trop Anim Health Prod. 2010.
- Kinney TB. A summary of reported estimates of heritability and genetic and phenotypic correlations for traits of chickens. Agric. U.S.D.A, Agriculture and Book Page. 1969;363.
- Gwaza DS, Dim NI, Momoh OM. Genetic study of the Tiv and the Fulani local chicken ecotypes in the derived guinea savanna region of Nigeria. Ph.D thesis submitted to the Department of Animal Breeding and Physiology, University of Agriculure, Makurdi, Nigeria. 2013.
- SAS. Statistical Analysis system. Users guide, statistical analysis Institute, In: Cary North Carolina.1998.
- Molenaar R, Reijrink IAM, Meijerhof R, et al. Relationship between hatchling length and weght on later productive performance in broilers. World’s Poult Sci J. 2008;64(4):599-603.
- Ohagenyi IJ, Nwosu CC, Ndofor-Foleng HM. Genetic parameters of some biometrical growth traits of Purebred Heavy ecotype of the Nigeria Local Chicken. Int J Sci Nature. 2011;2(2)348-351.
- Ndofor-Foleng HM, Uberu NP, Nwosu CC. Estimation of heritability of body weight of local chicken ecotypes reared in Nsukka in the derived Savannah zone of Nigeria. In: Proceedings of 11th Annual Science of Nigeria September 18-21, I.A.R & T, Ibadan.2006;225-7.
- Sewalem A, Morricen DM, Law A, et al. Mapping of quantitative trait loci for body weight at three, six, and nine weeks of age in broiler-layer cross. Poult Sci. 2002;81(12):1775-81.
- Adedeji TA, Adebambo OA, Ozoje MO, et al. Heritabilities and genetic and phenotypic correlations of early growth traits in crossbred chickens. In: proceedings of the 29th Annual Conference of the Genetics society of Nigeria held at University of Agriculture, Abeokuta. 2004;113-6.
- Daguma R. Phenotypic characterization of some indigenous chicken ecotypes of Ethiopia. Livest Res Rural Dev. 2009;18(9).
- Emmerson DA. Effect of long term selection for increased egg production on the genetics of growth and egg production traits. Poult Sci. 2003;81:316-20.
- Momoh OM. Genetic and Phenotypic evaluation of the Nigerian Heavy ecotype chicken and its crossbreds with light ecotype. Ph.D Thesis, University of Agriculture, Makurdi, Nigeria. 2005;41-104.