Research Article - Journal of Dermatology Research and Skin Care (2017) Volume 1, Issue 1
PASI area and erythema scoring using YIQ color space
Machekposhtia SA1, Madjid Soltani1,2*, Kaamran Raahemifarc3, Ehsan Zare Bidakid4, Maryam Sadeghie5
1Department of Mechanical Engineering, K.N.T. University of Technology, Tehran, Iran
2Department of Radiology and Radiological Science, Division of Nuclear Medicine, Johns Hopkins University, School of Medicine, MD, USA
3Department of Electrical and Computer, Ryerson University, Toronto, Ontario, Canada
4Department of optometry and vision science, university of waterloo, waterloo, CA
5Digital Health Hub, Simon Fraser University, Surrey, BC, Canada
- Corresponding Author:
- Madjid Soltani
Department of Radiology and Radiological Science
Division of Nuclear Medicine
Johns Hopkins University School of Medicine
USA
Tel: +1 410-955-5000
E-mail: msoltani@uwaterloo.ca
Accepted Date: November 01, 2017
Citation: Machekposhtia SA, Soltani M, Raahemifarc K, et al. PASI area and erythema scoring using YIQ color space. Dermatol Res Skin Care. 2017;1(1):8-14
Abstract
Psoriasis is an autoimmune inflammatory skin disease, afflicting skin with red plaques that are usually covered with silvery, white scales. Many treatments exist to control psoriasis; however, unfortunately there is no definite cure. PASI (Psoriasis Area and Severity Index) measures psoriasis severity by evaluating the area, erythema, scaliness, and thickness of the plaques, and is the gold standard method used to assess treatment performance. PASI parameters are calculated by dermatologists manually, a time-consuming process that can lead to inconsistent and diverse results. This paper presents a computer-based automatic method to measure the area and erythema parameters of PASI. In the proposed method YCbCr and YIQ color spaces are used, and clustering is done using the K-means algorithm. Seventeen patients have been assessed in this study, and the results of ten patients with different erythema scores are presented in this paper. Results of this study showed that the proposed method is highly accurate. Other advantages of the proposed method include: differentiating moles and scars from psoriasis patches, omitting light reflections, and reducing the calculation time by using color spaces which have linear transformation from the RGB color space.
Keywords
Erythema, K-means algorithm, PASI, YCbCr colour space, YIQ colour space.
Introduction
Psoriasis is an autoimmune inflammatory skin disease which is believed to be caused by a multiple gene hereditary pattern involving various factors such as immunity, inflammation, cell proliferation, apoptosis, and neural media. Its characteristic features are hyper-proliferation of keratinocytes leading to redness, thickening, and scaling of epidermis followed by itching. Other than these symptoms, the patients usually suffer from psychological side effects due to the unpleasant appearance of lesions [1]. Figure 1 shows two samples of psoriasis lesions.

Figure 1: Two samples of psoriasis lesions.
There is no definite age range for psoriasis, and both genders are equally vulnerable [1,2]. Some studies have defined psoriasis as an autoimmune disease which proceeds into the immune system [3], whereas others consider it a genetic problem [4]. Skin cells usually regenerate every month. In patients with psoriasis however, skin cells regenerate every 3 or 4 days, and the newly generated cells form psoriasis lesions [5].
According to the National Health and Nutrition Examination, this contagious disease has spread over 3.15% in United States, which translates to roughly 5 million adults [6]. Approximately 2% to 5% of the world's population suffers from psoriasis [7]. There are five different types of psoriasis: plaque, guttate, inverse, pustular, and erythrodermic. Since there is no definite cure for psoriasis, treatment mainly involves controlling the disease by containing its symptoms. Therefore, monitoring the symptoms during the course of treatment is very important. Physicians, could prescribe various medications with different dosages and frequencies, and compare the results. PASI (Psoriasis Area and Severity Index) is the gold standard method for assessing the extension of psoriasis lesions [8]. PASI considers the following four main factors of the disease: lesion area, erythema (redness), scaliness, and skin thickness. Equation (1) shows the PASI formula:
PASI=0.1(Rh+Th+Sh) Ah+0.2(Ru+Tu+Su) Au+0.3(Rt+Tt+St)At+0.4(Rl+Tl+Sl) Al (1)
Where, A is area (0-6), R is redness (0-4), T is thickness (0-4), and S is scaliness (0-4). All factors must be computed on the head (h), trunk (t), upper (u), and lower (l) extremities. The total score ranges between 0 and 72 [9,10].
The first parameter of PASI is the lesion area, which is determined based on the total area of the skin covered by the lesions. Table 1 shows the PASI area score based on the percentage of the skin covered by the lesions.
| Lesion area percentage | PASI area score (A) |
|---|---|
| 0% | 0 |
| <10% | 1 |
| 10% to 30% | 2 |
| 30 t0 50% | 3 |
| 50% to 70% | 4 |
| 70% to 90% | 5 |
| 90% to 100% | 6 |
Table 1. PASI area score [9].
Another factor of the PASI is erythema. Erythema score is calculated by comparing the amount of red color on the lesions with that of the healthy skin. Table 2 shows erythema scores given to the lesions with different levels of redness.
| Lesion color | Erythema Score(R) |
|---|---|
| No lesion | 0 |
| Slightly pink | 1 |
| Pink | 2 |
| Red | 3 |
| Dark red/ purple | 4 |
Table 2. PASI erythema score [10].
Since all parameters should be determined visually, calculation of PASI factors is a tedious and time-consuming task for dermatologists. In addition, the manually calculated PASI parameters are not precise or reliable since they have been assessed visually and might have been influenced by differing opinions. Therefore, an automatic method that allows precise calculation of PASI factors is needed.
Related work
Ihtatho et al. [11] separated the lesions from healthy skin using the K-means algorithm in CIELAB. CIELAB is a nonlinear transformation of RGB color space that was defined as a new function for discriminating healed lesions. Because of its nonlinearity, and its definition of a new function for healed lesions, requires a long time to transform and calculate. Fadzil et al. [10] used CIELAB color space and divided their participants into 3 groups (fair skin, brown skin, and dark skin) using L^* component. They could not detect silvery-white scales in psoriasis, and therefore their results were erroneous. In a subsequent study Fadzil and Ihtatho [12] modeled psoriasis in HSV color space, and plotted 3 diagrams for obtaining erythema, in which there were some overlaps in scores 1 and 3.
Zare et al. [9] segmented the lesions from skin in YCbCr color space by applying the optimal threshold method. YCbCr color space could not distinguish between moles and healed lesions. Marguier et al. [13] used an extensive color pad to calibrate the coloration and omit environmental luminance. Raina et al. [14] used a card with 4 × 6 colors, and after obtaining the calibrated image, employed previously proposed methods [10,15,16] to calculate the degree of redness. Both previous methods are similar in their assessment of each color in luminance using color pads, and in their calibration of the images by omitting luminance. There were also some shades seen in images which made their calibration faulty. Mashaly et al. [17] employed four different segmentation techniques, i.e., rough set, K-means, watershed, and TD segmentation, for the following six diseases: psoriasis, seborrheic dermatitis, atopic dermatitis, lichen planus, pityriasis rosacea, and pityriasis rubra pilaris. Rough set segmentation was the best technique for classification and segmentation. It was simple and did not need any preliminary information about images. However, this method had some deficiencies; it could not detect light reflection, there were small holes in lesions and it was very accurate. Nugroho et al. [18] transformed 3D images into 2D grayscale texture images, and obtained the angular second moment and correlation. The method was appropriate for scores 2 and 3.
The main purpose of the present study is to automatically calculate the area and erythema parameters of PASI. In this paper, the Cr component of YCbCr color space and K-means algorithm are used in order to distinguish the background from foreground. Then, the segmented part of the images (Region of Interest or ROI), healthy skin, and lesions are processed. In addition, the Q component of YIQ color space is used to differentiate the lesions from the surrounding healthy skin using the K-means algorithm. The proposed method can calculate both erythema and area parameters using a single algorithm. It is highly accurate and can distinguish between treated and untreated lesions. Furthermore, this method is the least sensitive to ambient light.
Materials and Methods
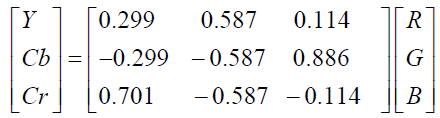
The color spaces in which color and luminance have been separated could be very useful for different parts of the image segmentation algorithm. Since YCbCr color space has separate luminance (Y), and chrominance (Cb and Cr) components, it is a good candidate for the present study.
YCbCr is a linear transformation of RGB color space and is used in television transmission systems and visual information compression standards.
YCbCr values can be obtained from RGB using Equation (2).
 (2)
(2)
A grayscale image could be obtained from each component of YCbCr color space. The grayscale images gained from YCbCr are shown in Figures 2a-2d.

Figure 2: YCbCr color space gray scales images (a) original image, (b) Y component, (c) Cb component, (d) Cr component.
As shown in Figure 2, red color has a brighter gray level in the Cr gray-scale image. The figure also shows the effect of luminance on the Y, and Cr components. Darker colors absorb most of the luminance and therefore become dimmer, while lighter colors reflect most of the luminance and become brighter. In comparison with green and blue, the red color is more prevalent in the skin. Since Cr component contains information related to Red in RGB color space without presence of luminance (Cr=R-Y), it is used in the present algorithm.
The first step in such studies is background segmentation. The images must be segmented into two parts, background and ROI. Automatic segmentation of the images can be done by clustering algorithms.
K-means is considered an uncomplicated clustering algorithm which can be used to solve the clustering problem. We performed the following steps using the K-means algorithm to divide the data into 2 clusters:
Step 1. Primary centers of C1,CM2 for the two clusters were randomly selected from the data.
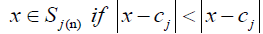
Step 2. The means of the centers were used to show to which of the 2 categories every datum belonged and were set as heads of the two categories. This criterion is defined as:
 (3)
(3)
for i =1,2 &i ≠ j
Where Sj(n) is the set of data which were clustered in the step n under j, and the || - || symbol shows the distance
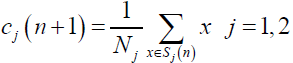
Step 3. The gathered data means were calculated for each cluster, and were used as the new cluster centers for the next level.
 (4)
(4)
Where Nj is the number of members of category j.
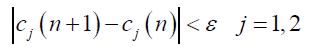
In step 4, steps 2 and 3 were repeated as many times as needed to ensure the category centers did not differ much from their previous positions, that is:
 (5)
(5)
Where ε depends on the accuracy of calculations.
Although the K-means algorithm is one of the best options to be used in this case, it is not the optimal one, considering the global objective function minimum. It must be mentioned that this algorithm is sensitive to the selected cluster centers. This method can be used several times in order to minimize this problem [9,19,20].
2-clustered K-means is implemented in the present study; the first cluster contains background, and the second one contains skin features. The segmentation of these two categories can be seen in Figures 3a and 3b.

Figure 3: (a) original image, (b) background, and foreground.
After background segmentation, the background part of the images can be omitted in the following step, and the lesions and healthy skin should be distinguished. Having healed parts and silvery-white scales in the lesions may affect the precision of Cr component of YCbCr. Therefore, another color space, namely YIQ, is used to separate the lesions from healthy skin. YIQ color space has been used by the National Television Standard Committee (NTSC) as a television broadcast standard since its approval for broadcast television in 1953. This color space has been designed with knowledge of the human visual system [21,22].
YIQ is a linear transformation of RGB color space with lowprocessing and consequently, high speed of segmentation. It has three components: Y, I, and Q representing luminance, hue, and saturation, respectively. The conversion function of YIQ from RGB is given in Equation (6).
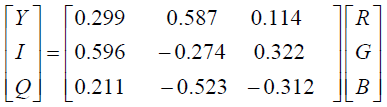 (6)
(6)
Compared to Cr in YCbCr, the effect of red color in YIQ color space attenuates, the impression of blue is increased and green remains unchanged. It is obvious that there is more blue color in the lesion areas. Therefore, the blue color should have a higher coefficient, and hence it is applied in this color space.
Summation of the Y component equals to one so it shows luminance, and summation of I and Q equal to zero so they show color information. The third component of YIQ is used for segmenting the lesion from the healthy skin by the 2-clustered K-means algorithm. After applying the K-means algorithm, “imfill’’and “medfilt’’ functions are used. The former is used in form of (imfill (matrix name, 'holes')) from the MATLAB library ('holes' specifies the circular structure used for filling in small holes in images). As mentioned before, most of these lesions are covered by silvery-white scales and thus, before performing these two functions, scales should be considered part of the skin. Figures 4a-4c shows some samples of lesion segmentation using the proposed method.

Figure 4: (a) Database images, (b) before filtering, (c) after filtering.
Lesion area and erythema are both calculated solely with the third component of YIQ using a single process. The erythema score of lesion is evaluated by the difference between the color of the lesion and its surrounding skin. The value of the Q component of the YIQ color space increases in the afflicted area of skin. Therefore, the erythema score can be assessed by calculating the difference between the Q component of the lesion and the healthy skin. Members of each cluster are useful for erythema calculation since the K-means clustering performance will depend on this value for area segmentation. The erythema calculation formula can be obtained from Equation (7).
Score of lesion = [100 × (Q_1-Q_0)] (7)
Where Q_0 is the average of skin cluster, and Q_1 is the average of the lesion cluster, and [ ] is a floor function.
The difference between Q_1 and Q_0 shows the intensity of the lesion. The greater the difference, the greater will be the intensity of the lesions. It is understood that this difference is directly related to the lesion score. Limitation for differences between Q_1, and Q_0 is given in Table 3.
 |
100 ×  |
Score |
|---|---|---|
| 0-0.01 | 0-1 | 0 |
| 0.01-0.02 | 1-2 | 1 |
| 0.02-0.03 | 2-3 | 2 |
| 0.03-0.04 | 3-4 | 3 |
| > 0.04 | > 4 | 4 |
 stands for the difference between the average of Q components of the healthy skin and lesions.
Table 3. Range of differences between Q_1 and Q_0 for obtaining score of lesion.
Figure 5 illustrates all the steps taken to obtain the erythema and lesion area scores using the proposed algorithm.

Figure 5: The steps taken to obtain the erythema and lesion area scores using the proposed algorithm.
This study was approved by Local Research Ethics Committee of Tehran University of Medical Sciences. All patients were fully informed of the nature of the study, and the consent was verbally.
Results and Discussion
Images used in this study have been taken from seventeen patients at the Imam Khomeini Hospital, Tehran, Iran. Images have been taken in different light conditions. All images were captured from the afflicted areas of body including head, trunk, arms, and legs.
The database images were captured by a low cost and easyto- use camera in JPEG format. All images were converted to bitmap format for further processing. The first step was background segmentation. The third component of the YCbCr color space, namely Cr, was the best candidate for background classification. The K-means algorithm was used for automatic clustering. Therefore, background data were gathered into one cluster, and foreground data in another. The background color plays an important role in the results of segmentation, and it is the best to avoid having colors similar to the skin color in the background. In addition, yellow, which is a combination of green and red, and cyan, which is a combination of green and blue never appear as background colors.
In the next step, the third component of the YIQ color space, the Q component, was selected to segment the lesion area from healthy skin. In lesion area hemoglobin is more than other parts of skin (because of delivering more oxygen to heal lesion). The color of the lesion area is a mixture of red and blue, where these color coefficients in this component are positive and approximately equal. As a result, the best choice was to cluster the healthy skin and lesions, and calculate their area and their chrominance differences, i.e., the erythema score.
As shown in Table 4, the I component is not appropriate for separating the lesion from the healthy skin and calculating the erythema score. This component cannot magnify the lesion’s attributes, or its differences from the healthy skin. Therefore, it cannot distinguish the lesion from the surrounding healthy skin, and is inappropriate for scoring. In this study, the Q component of the YIQ color space is used for area and erythema calculations.
| Patient number | Real score |  |
 |
 |
|---|---|---|---|---|
| 1 | 3 | 9.15 | 13.10 | 3.95 |
| 2 | 4 | 16.10 | 21.26 | 5.16 |
| 3 | 3 | 11.40 | 20.60 | 9.20 |
| 4 | 3 | 11.63 | 13.20 | 1.60 |
| 5 | 4 | 16.00 | 17.20 | 1.20 |
| 6 | 2 | 13.90 | 17.30 | 3.40 |
| 7 | 2 | 15.40 | 19.00 | 3.60 |
| 8 | 1 | 10.12 | 20.13 | 10.01 |
| 9 | 3 | 7.75 | 19.89 | 12.14 |
| 10 | 4 | 12.01 | 13.02 | 1.01 |
 is the average of skin pixels in I component of YIQ,
  is the average of lesion pixels in I component, and
  is the difference of skin and lesion pixels in I component (
 ).
).Table 4. Real score, average of I component in lesion and skin.
Table 5 shows the actual erythema scores (as determined by a physician via visual examination), and the scores obtained through the proposed method for the ten of seventeen patients. The erythema scores of nine patients were the same regardless of the method of calculation. Only for one patient (patient #4) the scores were different when obtained by visual examination (physician score) and automatically (method score). This difference may be due to human error since in the conventional method physicians need to assess the amount of color in the lesion area visually. Lesions with scores of more than one are more irritable, and intolerable, so data with score of more than one are more accessible.
| Patient number | Physician score |  |
 |
 |
method score |
|---|---|---|---|---|---|
| 100 | 3 | 0.92 | 4.12 | 3.20 | 3 |
| score | 4 | 1.13 | 5.75 | 4.62 | 4 |
| 1 | 3 | 0.41 | 3.85 | 3.44 | 3 |
| 2 | 3 | 1.4 | 4.21 | 2.74 | 2 |
| 3 | 4 | 1.04 | 5.16 | 4.12 | 4 |
| 4 | 2 | 3.96 | 6.12 | 2.16 | 2 |
| 5 | 2 | 2.83 | 4.88 | 3.71 | 2 |
| 6 | 1 | 5.59 | 7.48 | 1.9 | 1 |
| 7 | 3 | 2.18 | 5.85 | 2.18 | 3 |
| 8 | 4 | 1.98 | 6.08 | 4.10 | 4 |
Table 5. The actual scores (determined by a physician via visual examination), the scores obtained through the proposed method, and the average of Q component in lesion areas and healthy skin for the ten patients.
In many cases, moles and scars left behind by the healed lesions are similar in color to psoriasis lesions. An additional advantage of the proposed method is its ability to classify such moles and scars as healthy skin. Figure 6 shows an example of this algorithm’s ability in disregarding moles.

Figure 6: Categorizing moles as healthy skin.
Light conditions play a significant role in image processing applications that use color features. In this study, only the color information of the images is used in segmentation algorithm. Hence, the effect of illumination in the results is minimal. This method can therefore be applied to images taken in different light conditions. As shown in Figure 7 light effects are detected without misclassification.

Figure 7: Detecting light effects.
Detecting the silvery-white scales that are surrounded by healthy skin presents a challenge. In this case, the proposed method has a low rate of miss classification as can be seen in Figure 8. The area score remains unaffected despite a few misclassified areas.

Figure 8: An example showing some undetected scales.
Reference images are used in this study for performance evaluation. They were manually segmented using software with 100% accuracy. Figures 9a and 9b illustrates some samples of the database images and their references.

Figure 9: (a) Reference image, (b) lesion.
Plaque pixels are colored pure red using MS Paint software (Figure 9). The K-means algorithm is applied on the new image. Since in the new image all pixels are pure red or pure white, they are easily distinguishable by the K-means algorithm.
The accuracy of this work can be calculated using Equation (8).
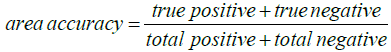 (8)
(8)
Where, ‘true positive’ is the total number of pixels in the plaques detected correctly by this algorithm, and ‘true negative’ is the total number of pixels detected correctly outside of the plaque areas. ‘Total positive+total negative’ is the total number of pixels in the foreground of the reference image [9]. Table 6 shows the percentage of lesion area, area score, area accuracy, erythema scores determined automatically and also by the physician for the ten participants.
| Patient number | lesion area | Area score | Area accuracy | Proposed method Erythema | Physician Erythema |
|---|---|---|---|---|---|
| 1 | 22.92 | 2 | 93.61 | 3 | 3 |
| 2 | 48.49 | 3 | 94.67 | 4 | 4 |
| 3 | 32.20 | 3 | 91.74 | 3 | 3 |
| 4 | 33.36 | 3 | 89.88 | 2 | 3 |
| 5 | 47.23 | 3 | 92.21 | 4 | 4 |
| 6 | 69.98 | 4 | 91.19 | 2 | 2 |
| 7 | 78.77 | 5 | 89.74 | 2 | 2 |
| 8 | 49.61 | 3 | 88.09 | 1 | 1 |
| 9 | 53.34 | 4 | 90.05 | 3 | 3 |
| 10 | 18.29 | 2 | 93.02 | 4 | 4 |
Table 6. The percentage of lesion area, area score, area accuracy, erythema scores determined automatically and also by the physician for the ten participants.
Conclusion
The present study proposes a method for automatically measuring the area and erythema parameters in PASI. In this work, YCbCr color space was used only for segmenting the background from foreground. YCbCr color space decreases the limitation of the background color. The third component of YIQ was used to assess both erythema and area. Both of these segmentations were done by 2-clustered K-means. Both YCbCr and YIQ color spaces are linear transformations of RGB color space. Hence, they can perform the task with a very low level of processing.
The proposed fully automatic method has five advantages: (1) it is highly accurate; (2) it can distinguish between moles and psoriasis lesions; (3) because of filtering process, this method detects small, and silvery-white scales which surrounded by lesion; (4) images can be taken in an uncontrolled illumination environment; and (5) both color spaces used in this study have linear transformations from RGB, and therefore, decrease the required calculation time. This algorithm will be used, and calculated in smart phones, so computational complexity is considered as a hindrance. The above advantages reinforce the effectiveness of the proposed method for PASI calculation.
Acknowledgment
We thank Chehreh Hessami, for her help and support to write this manuscript. In addition, our special thanks go to the Department of Dermatology at the Imam Khomeini Hospital for their support during this study.
References
- Bhosle MJ, Kulkarni A, Feldman SR, et al. Quality of life in patients with psoriasis. Health Qual Life Outcomes. 2006:4(1):35.
- Alfonso-Trujillo I, Díaz García MA, Sagaró-Delgado B. Pathogenesis of psoriasis in the light of current knowledge. Cuban J Med. 2001:40:122-34.
- Taylor WJ. Epidemiology of psoriatic arthritis. Curr Opin Rheumatol.2002:14(2):98-103.
- Morrow T. Evaluating new therapies for psoriasis. Managed care (Langhorne, Pa.). 2004:13(10):34-40.
- Lowes MA, Bowcock AM, Krueger JG. Pathogenesis and therapy of psoriasis. Nature. 2007:445(7130):866-73.
- Kurd SK, Gelfand JM. The prevalence of previously diagnosed and undiagnosed psoriasis in US adults: Results from NHANES 2003-2004. J Am Acad Dermatol. 2009:60(2):218-24.
- Chandran V. Genetics of psoriasis and psoriatic arthritis. Indian J Dermatol. 2010:55(2):151.
- Reich K, Mrowietz U. Treatment goals in psoriasis. JDDG: Dtsch Dermatol Ges. 2007:5(7):566-74.
- Bidaki EZ, Zargari F, Mansouri P. Lesion area assessment in psoriasis patients. J Med Eng Technol. 2011:35(3-4):154-60.
- Ahmad Fadzil MH, Ihtatho D, Mohd Affandi A. Objective assessment of psoriasis erythema for PASI scoring. J Med Eng Technol. 2009:33(7):516-24.
- Ihtatho D, Fadzil MA, Affandi AM. Area assessment of psoriasis lesion for PASI scoring. In: Engineering in Medicine and Biology Society, 2007. EMBS 2007. 29th Annual International Conference of the IEEE. 2007:3446-9.
- Fadzil MA, Ihtatho D. Modeling psoriasis lesion colour for PASI erythema scoring. In: Information Technology, 2008. ITSim 2008. International Symposium on 2008;2:1-6.
- Marguier J, Bhatti N, Baker H, et al. Assessing human skin color from uncalibrated images. Int J IM SY. 2007:17(3):143-51.
- Raina A, Hennessy R, Rains M. Objective measurement of erythema in psoriasis using digital color photography with color calibration. Skin Res Technol. 2016:22(3):375-80.
- Lu J, Kazmierczak E, Manton JH. Automatic Scoring of Erythema and Scaling Severity in Psoriasis Diagnosis. In: Australasian Conference on Artificial Intelligence. 2012:73-84.
- Iyatomi H, Oka H, Hagiwara M, et al. Computerized quantification of psoriasis lesions with colour calibration: Preliminary results. Clin Exp Dermatol. 2009:34(7):830-3.
- Mashaly HM, Masood NA, Mohamed AS. Classification of Papulo?Squamous skin diseases using image analysis. Skin Res Technol. 2012:18(1):36-44.
- Nugroho H, Fadzil MA, Venkatachalam PA. Surface analysis of psoriasis for PASI scaliness assessment. In: Intelligent and Advanced Systems, 2007. ICIAS. 2007:798-802.
- MacQueen J. Some methods for classification and analysis of multivariate observations. In: Proceedings of the fifth Berkeley symposium on mathematical statistics and probability. 1967:1(14):281-97.
- Tou JT, Gonzalez RC. Pattern recognition principles. IEEE Information Theory Society. 1976;22(5):632-33.
- Kwak J, Bae WK, Lee D. Bright and efficient full-color colloidal quantum dot light-emitting diodes using an inverted device structure. Nano Lett. 2012:12(5):2362-6.
- Blinn JF. NTSC: Nice technology, super color. IEEE Computer Graphics and Applications.1993:13(2):17-23.