Research Article - Biomedical Research (2019) Volume 30, Issue 5
Parameters estimation of Fitzhugh-Nagumo model.
Iffat Ara*
Pabna University of Science and Technology, Pabna, Bangladesh
Accepted date: June 13, 2019
DOI: 10.35841/biomedicalresearch.30-19-267
Visit for more related articles at Biomedical ResearchAbstract
One of the simplest single cell models is what is now called the FitzHugh–Nagumo (FHN) model. The model was originally developed as simplification of the Hodgkin–Huxley model by FitzHugh. It exists many variations of the original FHN model. The aim of this paper is to find the parameter thresholds used in FHN model for regular excitation. The thresholds of different parameters are presented. We observe that regular activation occurred when the excitation current is above a threshold level. Sensitivity of different FitzHugh-Nagumo parameters on cardiac excitation is observed. This study represents the first stage toward the development of an accurate computer model of heart activation.
Keywords
Mathematical model, Single cell model, Hodgkin–Huxley model, FitzHugh–Nagumo model
Introduction
More typically, ordinary differential equations (ODEs) are used to model the behaviour of electricity in a myocardial cell. ODE models can be placed into two groups. First-generation models include behaviour described by a phenomenological model as well as some of the underlying physiology [1]. The ionic channels most responsible for generating an action potential are included in a first-generation model, but many of the finer details are simplified. Examples of first-generation models are the FitzHugh–Nagumo and Luo–Rudy Phase I models.
The FitzHugh–Nagumo model (FHN), named after Richard FitzHugh who suggested the system in 1961 and J. Nagumo who created the equivalent circuit the following year to describes a prototype of an excitable system [2].
Second-generation models include all of the detail of a firstgeneration model and as many of the finer details as possible. Examples of second-generation models are the models of Courtemanche, Winslow, and Puglisi–Bers [3].
Materials and Methods
Mathematical model
In neurons, action potential transfers inside the single cell and participate in neuron-to-neuron communication. Since neural and cardiac cells have many similarities, much of the mathematics of cardiac cell modeling is drawn from the pioneering work of Hodgkin and Huxley.
Single cell models
The behaviour of electrical activity can be modelled with something as simple as a cubic polynomial [1,3]. Phenomenological models reproduce only the macroscopic details regarding electrical activity and do not include any of the underlying physiological details that cause the creation and behaviour of electrical activity in the heart. Polynomial equation does not model the re-polarization phase [1]. The advantage to using phenomenological models is that they can simulate an action potential with the lowest possible computational cost [4].
Hodgkin–Huxley model
The Hodgkin – Huxley model (HH), or conductance-based model, is a mathematical model that describes how action potentials in neurons are initiated and propagated. It is a set of nonlinear differential equations that approximates the electrical characteristics of excitable cells such as neurons and cardiac myocytes.
Alan Lloyd Hodgkin and Andrew Huxley described the model in 1952 to explain the ionic mechanisms underlying the initiation and propagation of action potentials in the squid giant axon [5].
This model usually represents the biophysical characteristic of the cell membrane. The lipid layer is represented by the capacitance Cm. Voltage-gated and leak ion channels are represented by nonlinear (gn) and linear (gL) conductance’s, respectively. The voltage source En whose voltage is determined by the ratio of the intra- and extracellular concentrations of the ionic species of interest [5].
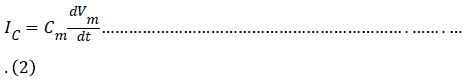
The capacitive current Ic is defined by the rate of change of charge q at the trans membrane surface is
The charge q(t) is related to the instantaneous membrane voltage Vm(t) and membrane capacitance Cm by the relationship q = Cm.Vm. Thus the capacitive current can be rewritten as
In the Hodgkin-Huxley model of the squid axon, the ionic current Iion is subdivided into three distinct components, a sodium current INa, a potassium current IK, and a small leakage current IL that is primarily carried by chloride ions. So the differential equation is given by
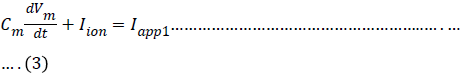
Where Iappl is an externally applied current, such as might be introduced through an intracellular electrode.
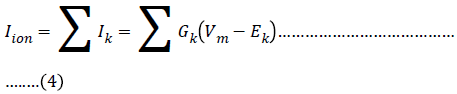
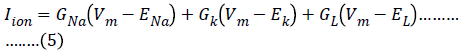
The individual ionic currents INa, IK and IL represent the macroscopic currents flowing through a large population of individual ion channels. In HH-style models, the macroscopic current is assumed to be related to the membrane voltage through an Ohm’s law relationship of the form V=IR [5]. In many cases Ohm’s law described by I=GV. Where G is the conductance and given by G=1/R. So the total ionic current Iion is the algebraic sum of the individual contributions from all participating channel types found in the cell membrane is given by (46)
This expands to the following expression for the Hodgkin- Huxley model of the squid axon:
In general, the conductances are not constant values, but they can depend on other factors like membrane voltage or the intracellular calcium concentration. In order to explain their experimental data, Hodgkin and Huxley postulated that GNa and GK were voltage-dependent quantities, whereas the leakage current GL was taken to be constant. Although Hodgkin and Huxley did not describe about the properties of individual membrane channels when they developed their model, it will be convenient for us to describe the voltagedependent aspects of their model in those terms [5].
The FitzHugh–Nagumo model
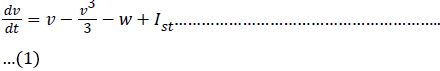
One of the simplest single cell models is what is now called the FitzHugh–Nagumo (FHN) model. The model was originally developed as simplification of the Hodgkin–Huxley model by FitzHugh in 1961. The behaviour of a neuron after stimulation by an external input current is expressed by equation (6) and (7) [6] and expressed in the equivalent circuit by Nagumo in 1962 [7].
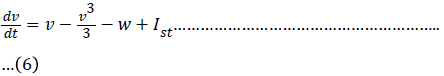
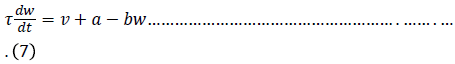
If the external stimulus I ext {\displaystyle I_{\text{ext}}} current Ist exceeds a certain threshold value, the system will exhibit a regular excitation. Where v is membrane voltage v {\displaystyle v}and w is a linear recovery variable and a, b, τ are model parameters. An example of values for these parameters is given in Table 1. These parameters may be modified to model different cell types (Figure 1) [6].
| Parameter | Value |
|---|---|
| Ist | 0.32 |
| a | 0.7 |
| b | 0.8 |
| τ | 12.5 |
Table 1. Parameters value of simple FitzHugh-Nagumo model [6].

Figure 1: Circuit diagram of the tunnel diode FitzHugh–Nagumo model.
The motivation for the FHN model was to isolate conceptually the essential mathematical properties of excitation and propagation from the electrochemical properties of sodium and potassium ion flow [6].
Results and Discussion
Solution of equation (6) and (7) are obtained using the parameters of Table 1. It has been observe that every parameter has a threshold value. Below or above this threshold regular excitation is occurred. Threshold label of Ist identified in this present studied is 0.324. Threshold value of a, b, τ are 0.69, 0.79 and 14.4 respectively. The results are shown graphically on Figures 2 to 5.

Figure 2: Graph of membrane voltage for a=0.7, b=0.8, τ=12.5 and I = 0.3, 0.32 and 0.325.

Figure 3: Graph of membrane voltage for i=0.32, b=0.8, τ=12.5 and a = 0.72, 0.7 and 0.69.

Figure 4: Graph of membrane voltage for i=0.32, a=0.7, τ=12.5 and b = 0.82, 0.8 and 0.79.

Figure 5: Graph of membrane voltage for i=0.32, a=0.7, b=0.8 and τ = 13.2, 14.0 and 14.4.
Conclusion
In this article, simulation of FitzHugh-Nagumo model is made. The parameters of FitzHugh-Nagumo model for regular excitation are studied. Simulation results are carried using MATLAB. The FHN model is simple to implement and computationally inexpensive but it is limited in terms of the physiological accuracy. Many attempts have been made to modify the FHN model to make it more physiologically accurate while retaining the simplicity of the original model.
References
- Sundnes J, Lines GT, Cai X, Nielsen BF, Mardal KA, Tveito A (2006) Computing the Electrical Activity in the Heart. Springer-Verlag Berlin Heidelberg.
- William Erik Sherwood (2015) Fitzhugh–Nagumo Model. Encyclopedia of Computational Neuroscience, Springer, New York, United States.
- Dean RC. Numerical methods for simulation of electrical activity in the myocardial tissue. PhD thesis. University of Saskatchewan,Canada 2009.
- AJ Pullan, ML Buist, LK. Cheng (2005) Mathematically modelling the electrical activity of the heart: From cell to body surface and back again. World Scientific, New Jersey.
- Hodgkin AL, Huxley AF. A quantitative description of membrane current and its application to conduction and excitation in nerve. J Physiol 1952; 117: 500-544.
- R. FitzHugh, Impulses and Physiological States in Theoretical Models of Nerve Membrane. Biophys J 1961; 1: 445-466.
- J Nagumo, S Arimoto, S Yoshizawa. An active pulse transmission line simulating nerve axon, Proceedings of the IRE 1962; 50 :2061–2070.