Research Article - Ophthalmology Case Reports (2018) Volume 2, Issue 1
Pantoscopic tilt induced higher order aberrations characterization using Shack Hartmann wave front sensor and comparison with Martin's Rule
Venkataramana Kalikivayi1,4*, Kannan K2, Ganesan3
1Department of Mathematics, SASTRA University, India
2Department of Optometry, Kozhipara Post, Kerala, India
3Department of Physics, Indian Institute of Technology, India
4Department of Optometry, St.Thomas Mount, Chennai
- *Corresponding Author:
- Venkataramana Kalikivayi
Department of Mathematics
SASTRA University, India
Tel: +9380764631
E-mail: kalikivayi@yahoo.com
Accepted date: March 06, 2018
Citation: Kalikivayi V, Kannan K, Ganesan AR. Pantoscopic tilt induced higher order aberrations characterization using Shack Hartmann wave front sensor and comparison with Martin’s Rule. Ophthalmol Case Rep. 2018; 2(1):3-7.
DOI: 10.35841/ophthalmology.2.1.3-7
Visit for more related articles at Ophthalmology Case ReportsAbstract
Purpose: The aim of this work is to characterize the higher order aberrations due to Pantoscopic Tilt using Shack Hartmann Wave front Sensor and comparing it with Martin’s Rule. Methods: A Shack Hartmann wavefront sensor consisting of a hexagonal array of 127 micro lenses and a CCD Camera is used in this work to measure the tilt induced optical aberrations. The optical set up was aligned for perfect centration. A rotation stage was set for one of the lenses to induce pantoscopic tilt. The tilt was given from 10 to 130 in steps of 10. At each step, the various optical aberrations, consisting of first 15 Zernike terms were measured and analyzed. The resultant spherical equivalent is calculated using both methods viz., from SHWFS and Martin’s rule. Results: Pantoscopic tilt showed significant increase in 2nd and 4th order aberrations. Change in spherical equivalent of 0.50 D, 1.00 D and 2.00 D were observed for tilts of 40, 70 and 100 respectively. Whereas with Martin’s rule, the total change in the resultant spherical equivalent for 100 is 0.11 D only. The pantoscopic tilt increases 2nd and 4th order aberrations significantly and there was no statistical significant correlation for 3rd order aberrations. Conclusion: Our study insists the pantoscopic tilt induced aberrations should be taken into account while designing spectacle lenses and their frames for proper seating on the nose bridge and ears
Keywords
Pantoscopic tilt, aberrations, Shack hartmann wavefront Sensor, zernike polynomials, martin’s rule
Introduction
Spectacles play an important role in “Vision Correction”. Apart from the spectacle prescription, there are other factors like Inter-Pupillary Distance (IPD), vertex distance, pantoscopic tilt etc. which play a major role in good and comfortable vision. Although earlier works discuss extensively about IPD and vertex distance, the influence of pantoscopic tilt is seldom discussed. Pantoscopic tilt is defined as a lens tilt about the horizontal axis, with respect to primary gaze of a subject. In a simple way, it can be explained as “The rotation of lens bottom towards the cheeks”. Typically these tilts range from 0-12 degrees, and tilt up to 3-7 degrees are considered normal. It usually depends on how a spectacle sits on the face, which further depends on the heights of the ears nose and bridge. Tilt changes the effective power of a lens or spectacle [1-3], which results in a sphero cylindrical combination. Earlier studies discussed the mathematical calculations of the resultant power by using matrix methods [3,4]. The Shack Hartmann Wave front Sensor [5-8] (SHWFS) is extensively used in astronomy and human eyes. As human ocular aberrations are mostly measured using SHWFS, it needs to be centered or aligned well to accurately measure ocular aberrations. If the optical measurement system has any misalignment, this would add to the ocular aberrations being measured. This would result in misinterpretation of total aberrations as we cannot distinguish whether the aberrations are caused by the optical system or the eye. This would result in wrong aberration data. As is well known, the optical aberrations consist of lower and higher order. 92% of vision correction is achieved by correcting the lower order aberrations, viz. Defocus and astigmatism, whereas 8% due to higher order aberrations remain uncorrected [9,10]. These consist of aberrations like Coma, Trefoil, Spherical aberrations etc. When a spectacle lens was inserted and tilted during the calibration of SHWFS, it was observed that there was manifold increase in the higher order aberrations. This triggered us to look for the resultant power of a spectacle lens when a tilt is introduced and found to be very less compared to the calculated values using Martin’s rule. Hence in this work, we have analyzed the pantoscopic tilt induced higher order optical aberrations, consisting of various Zernike terms up to the 4th order, along with comparison of spherical equivalent using Shack Hartmann Wave front Sensor and Martin’s Rule.
Materials and Methods
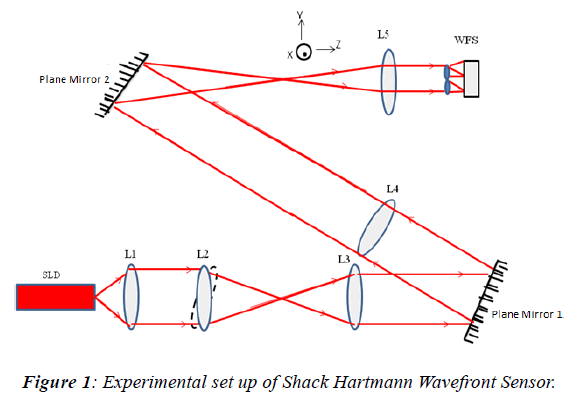
The schematic of the experimental set up is shown in Light from a fiber coupled Super Luminescent Laser Diode (SLD) of wavelength 633 nm was used as a test beam. The output from the fiber was collimated by lens L1with initial beam size of 24 mm. The exit aperture of the collimating lens L1 was reimaged onto a lens let array of the SHWFS using lenses L2-L5, which also takes care of beam resizing to fill the entire micro lens array with the given input beam diameter. The focal lengths of L1, L2 and L3 are 15 cm with a radius of curvature of 154 mm, central thickness of 3.1 mm and edge thickness of 2 mm. The focal length of L4 is 50 cm with a radius of curvature of 514.7 mm, central thickness of 2.3 mm and edge thickness of 2 mm. The focal length of L5 was 10 cm with a radius of curvature of 102.4 mm, central thickness of 3.6 mm, and edge thickness of 2 mm. All lenses were 25 mm in diameter and made of Schott optical glass with refractive index of 1.79. As it is mandatory to resize the beam in a Shack Hartmann Wave front sensor, the power and spacing of the lenses were carefully calculated and the beam resized to 3.9 mm to match the clear aperture size of micro lens array. It is also important to maintain conjugacy at 3 planes (at L1, Mirror 1 and at wave front sensor), following spacing of lenses in the experiment (Figure 1).
SLD to L1=15 cm,
L2 to L3=30 cm,
L3 to Mirror 1=15 cm,
Mirror 1 to L4=15 cm,
L4 to L5=60 cm and
L5 to WFS=11.4 cm.
Hence the beam emerging from L1, Mirror 1 and L5 are always parallel. The second mirror was a plane mirror and rays from L4 are converging to a point before L5. Hence the lens used for tilt measurement cannot be changed for different magnitude of powers and is dependent on beam resizing optics used in SHWFS. If a lens with different power (L2) is used for introducing the tilt, the rest of the optics has to be reworked to maintain conjugacy and beam resizing. The wave front sensor used in this work consists of hexagonal array of 127 micro lenses and a CCD Camera. The focal length of the micro lens array was18 mm and the array pitch was 300 micrometer. The micro lens array focuses the incoming beam to an array of spots. The position of these spots varies when the input beam has aberrations compared to a perfect plane wave front. By measuring the shift of the centroids of these spots, all the aberrations were calculated [9]. Further, the wave front reconstruction was performed by using “modal reconstruction” method, which means that the required wave front is represented by a series expansion over a system of linearly independent basis functions, and the coefficients of expansion are calculated in terms of this basis [10]. Singular Value Decomposition (SVD) algorithm was used to construct an orthogonal basis [11,12]. The reconstructed wave front was then defined continuously throughout the whole aperture of the sensor which is 3.9 mm in our wave front sensor. Optical aberrations up to 8th orders consisting of 44 Zernike terms were computed. As only the first 15 Zernike terms are visually significant [9-13], we have analyzed the data up to 4th order. The entire set up was initially aligned and tested for perfect centration. It was achieved by using a cage system and a point laser beam sent through a pin hole. The system was tested for minimum values of various optical aberrations. To induce pantascopic tilt about the X-axis, the lens L2 was mounted on a rotation stage. We take Z-axis as the direction of propagation and the XY plane as the plane of wave front, centered on the optic axis as shown in Figure1. The rotation stage of the lens L2 was rotated about X axis in 1 degree steps up to 13 degrees. The size of the collimated beam was 24 mm and to measure the entire wave front, the beam was resized to the size of the micro lens array which was 3.9 mm using lenses L2 to L4. Apart from beam resizing, the lenses L2 to L5 also image the exit aperture of the collimating lens on to the microlens array. When the lens bottom was tilted towards the wave front sensor, it was taken as pantoscopic. At each point the wavefront data consisting of all Zernike values up to the 4th order, Peak-Valley and RMS values were stored. After obtaining the Zernike values, the 2nd order aberration data consisting [Z_2 ^ 0 Z_2^2, Z_2 ^ (-2) were converted to the clinical sphere cylindrical form by using the following equations [14,15]. The Z_2^0defocus corresponds to spherical equivalent M, Z_2 ^ 2 corresponds to with/against the rule astigmatism J180 and Z_2 ^ (-2) corresponds to oblique astigmatism J45 with axis 45 0 or 135 0.
J45 = (-2√6) / r2 Z_2 ^ (-2), M=(-4√3) / r2 Z_2 ^ 0, J180=(-2 √ 6) / r2 Z_2 ^ 2
When ‘r’ is the pupil radius in mm, Zernike values were in microns, the corresponding refractive error will be in diopters. Thibos et al. [16] earlier reported that the following equation can be used to convert J45, M and J180 to conventional spherocylindrical form.
S = M +√ (J_180 ^ 2 + J_45 ^ 2), C = -2 √ (J_180 ^ 2 + J_45 ^ 2), ? = 1/2 arc tan (J45 / J180)
Where ‘S’ is sphere, ‘C’ is cylindrical power and ‘?’ is the axis.
Martin's rule essentially calculates the resultant power of a lens when a tilt is introduced. Tilt of a lens results in shifting the optical axis away from the center of rotation. It means that the line of sight is at an angle to the lens in its primary position of gaze. Hence this tilting of a lens changes the three components in the resultant power.
1. Sphere power.
2. Cylinder is induced, equal in sign to the sphere power
3. The axis is oriented at the axis of rotation.
In this work, for each degree of tilt for the known power of a lens, the resultant power of the lens was calculated mathematically by using the following Martin’s formula as reported earlier by D Meister and JE Sheedy [17].
Dsph=D (1+ (Sin ^ 2 ?) / 2n)
Dcyl=Dsph (Tan ^ 2 ?)
Where
Dsph=induced sphere
?=degrees of tilt
D=Sphere power of the tilted lens.
Dcyl=induced cylinder at the rate of 180
Spherical equivalent was then calculated by using conventional formula M=Dsph + Dcyl/2
Descriptive analyses, Correlation tests and Regression analyses were performed by using Microsoft Excel. Confidence interval was fixed at 95%.
Discussion
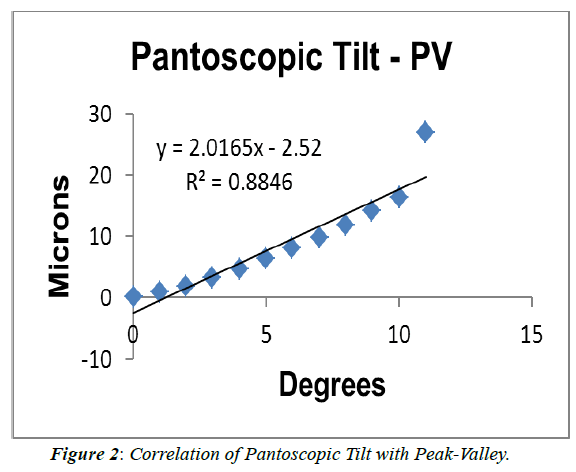
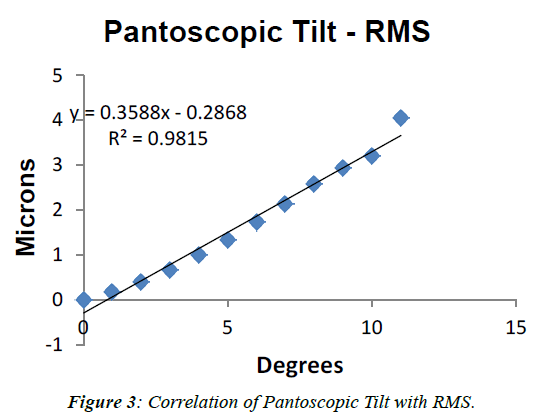
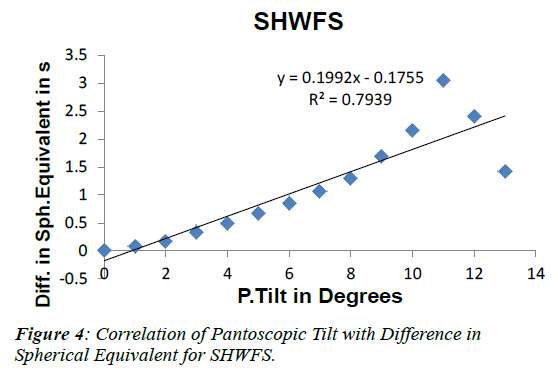
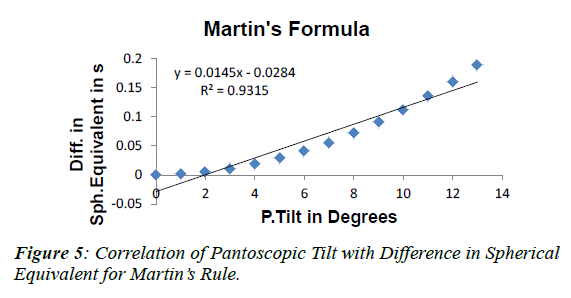
After getting the conventional spherocylindrical form from the lower order aberrations measured by SHWFS, spherical equivalent was calculated for pantoscopic tilt. Later the difference was calculated by subtracting the original power of the lens from the values obtained from SHWFS method and is given in Table 1. For all the 2nd order aberrations, Defocus (p<0.001), Horizontal (p=0.001) and Vertical Astigmatism (p=0.01), pantoscopic tilt was found to have a significant negative correlation. Although 3rd order aberrations (Horizontal and Vertical Coma, Horizontal and Vertical Trefoil) showed positive correlation, there was no statistical significant difference with pantoscopic tilt. In fourth order aberrations, Spherical Aberration (p=0.005), Vertical Secondary Astigmatism (p=0.01) and Horizontal Trefoil (p=0.004) showed significant negative correlation with pantoscopic tilt. Horizontal Secondary Astigmatism and Vertical Trefoil showed negative correlation with pantoscopic tilt but there was no statistical significance. Peak to Valley (PV) (p<0.001) and Root Mean Square (RMS) (p<0.001) showed statistically significant positive correlation with pantoscopic tilt as shown in Figure 2 and Figure 3 respectively. Higher Order RMS (HO RMS) was found to have statistically significant positive correlation with pantoscopic tilt (p=0.03). Difference in the Spherical equivalent derived from SHWFS was found to have statistically significant positive correlation with panto scopic tilt (p<0.00) as shown in Figure 4. Similarly the following (Table 2) gives the difference in spherical equivalent values calculated by subtracting the original power of the lens from the values obtained from Martin’s rule method. Difference in the Spherical equivalent derived from Martin’s Formula was found to have statistically significant positive correlation with pantoscopic tilt (p<00) as shown in Figure 5.
| Pantoscopic tilt In degrees |
Difference in spherical equivalent in diopters |
|---|---|
| 0 | 0 |
| 1 | 0.08 |
| 2 | 0.17 |
| 3 | 0.34 |
| 4 | 0.49 |
| 5 | 0.66 |
| 6 | 0.86 |
| 7 | 1.07 |
| 8 | 1.29 |
| 9 | 1.68 |
| 10 | 2.15 |
| 11 | 3.05 |
| 13 | 2.39 |
| 13 | 1.43 |
Table 1: Difference in Spherical Equivalent in diopters for Pantoscopic Tilt measured from SHWFS method.
| Pantoscopic Tilt in Degrees |
Difference in Spherical Equivalent in Diopters |
|---|---|
| 0 | 0 |
| 1 | 0.00 |
| 2 | 0.01 |
| 3 | 0.01 |
| 4 | 0.03 |
| 5 | 0.04 |
| 6 | 0.06 |
| 7 | 0.08 |
| 8 | 0.10 |
| 9 | 0.13 |
| 10 | 0.16 |
| 11 | 0.19 |
| 12 | 0.23 |
| 13 | 0.27 |
Table 2: Difference in Spherical Equivalent in diopters obtained from Martin’s rule.
Results
Most of the earlier works [1-4] discusses the methods to calculate the resultant power of a tilted lens, whereas we have tried to calculate and quantify the amount of higher order aberrations and its relationship with increase in pantoscopic tilt up to 13 degrees in 1 degree steps. From our study, we found that the pantoscopic tilt increases 2nd and 4th order aberrations significantly. Surprisingly there was no statistical significant correlation for 3rd order aberrations with pantoscopic tilt. This needs further work to understand the absence of significance for 3rd order aberrations. The total RMS showed statistically significant positive correlation with pantoscopic tilt, whereas Higher Order RMS showed significant negative correlation.
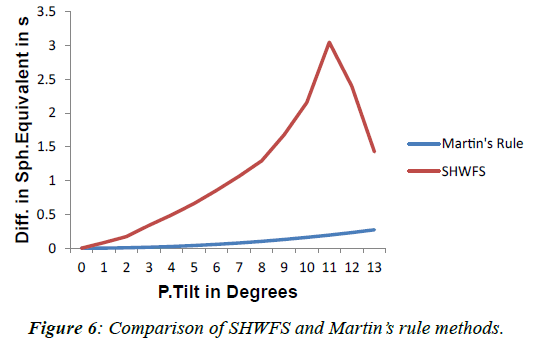
This gives us an understanding that lower order aberrations are positively correlated and higher order aberrations are negatively correlated. Also, for tilts of 40, 70 and 100, there was a change in spherical equivalent up to 0.50 D, 1.00 D and 2.00 D respectively, as spherical equivalent showed significant positive correlation with pantoscopic tilt. When using the Martin’s rule to calculate the pantoscopic tilt and the resultant spherical equivalent, it was found that there was a significant positive correlation. But the magnitude of the change in spherical equivalent was very low and was found to be 0.19 D for 110 degrees of tilt. Whereas SHWFS method showed a large amount of change up to 3.04 D for 110 degrees. But the most significant observation was that when a mathematical formula was used to calculate the tilt induced power, it is gradually increasing and showing a linear relationship.Whereas in the SHWFS method, resultant spherical equivalent increases gradually till 110 degrees and started reducing as shown in Figure 6. This reduction in the tilt values mainly depend on the number of micro-lenses, array pitch, array geometry, intensity of light, and wave front reconstruction methods used in constructing the SHWFS. These values may change for different wave front sensors depending on the above mentioned factors. Hence it is not only important to align the optical components of a SHWFS for the tilt, but also it is important to know the upper limit of the tilt in a given SHWFS. Earlier studies used different focal length lenses in their experiments using SHWFS [18-20]. In this work, it stresses the importance of using these lenses without inducing the tilt. One may think, a tilt of up to 110 induces only a 0.19 diopter as measured by Martin’s formula. But in the SHWFS, the same amount of tilt causes 3 diopters variation. This explains that there was a limitation or tolerance level in the SHWFS while doing the experiments involving the use of ophthalmic lenses. As was seen clearly from this work, a 20 degree tilt induces 0.17 D in SHWFS, whereas it takes up to 100 degrees of pantoscopic tilt in a spectacle lens for the human eye. The adaptability, accommodation, depth of focus etc. makes the human eye to tolerate up to 100 degrees of pantoscopic tilt, whereas SHWFS is highly sensitive to these tilts. A tilt in the spectacles induces a small variation in the resultant power but tilt induced by any of the lenses used in SHWFS results in huge variations. Hence one needs to be very careful in the experiments involving SHWFS. This works gives us the insight on tilt induced optical aberrations in an experimental set up using SHWFS. Hence it would help people who use Shack Hartmann Wave front Sensor in their experimental studies using ophthalmic lenses thereby guiding in proper alignment or misalignment of optical components where tilt is involved. The pantoscopic tilt increases 2nd and 4th order aberrations significantly and there was no statistical significant correlation for 3rd order aberrations. Our study suggests that the change in the resultant power of a tilted lens calculated by Martin’s rule is very less when compared to the measurement of change in resultant power using a SHWFS. This insists that experimental studies involving SHWFS needs not only proper alignment of optical components but also it is important to know the upper limit of the tilt in a given SHWFS. Further, the pantoscopic tilt induced aberrations should be taken into account while designing spectacle lenses.
Acknowledgements
The authors acknowledge the financial support from the Science & Engineering Research Council of India under grant nos.SR/ SO/HS/0073/2010 and SR/SO/HS/0072/2010.
References
- Keating MP. Oblique central refraction in sphere cylindrical lenses tilted around an off-axis meridian, Optometry &Vision Sciences.1993;70:785-91.
- Harris WF. Tilted power of thin lenses, Optometry and Vision Sciences.2002;79;512-15.
- Blendowske R. Oblique central refraction in tilted sphero cylindrical lenses, Optometry and Vision Sciences.2002;79:68-73.
- Long WF. A matrix formalism for decent ration problems, American journal of optometry and physiological optics.1976;53:27-33.
- Edmund Optics. Comparison of Optical Aberrations.2012.
- Thibos L, Applegate RA, Schwiegerling JT, et al. Standards for reporting the optical aberrations of eyes, Journal of Refractive Surgery.2002;18;652-60.
- Virendra NM. Aberration Theory Made Simple, SPIE Optical Engineering Press,Washington.1991.
- Ben CP, Roland S. History and Principles of Shack-Hartmann Wave front Sensing, Journal of Refractive Surgery.2001;11-17.
- Jesson M, Arulmozhivarman P, Ganesan AR. Higher order Aberrations of the Eye in a Young Indian Population, Asian Journal of Ophthalmology.2004;6;10-16.
- Smirnov MS. Measurement of the wave aberrations of the eye, Biophysics.1961;6:776-94.
- Soloviev O, Vdovin G. Hartmann-Shack tests with random masks for modal wave front reconstruction, Optics Express.2005;13:9570-84.
- Baker LC. Tools for scientists and engineers.1989.
- Lawless MA, Hodge C. Wave front's role in corneal refractive surgery, Clinical and experimental ophthalmology.2005;33:199-209.
- Thibos LN, Hong X, Bradley A, et al. Accuracy and precision of objective refraction from wave front aberrations, Journal of Vision.2004;4;1-9.
- Jesson M and Ganesan AR. Analysis of refractive errors in the eyes of young Indians, Journal of Modern Optics.2007;1;1349-59.
- Thibos LN, Wheeler W, Horner D. Power vectors an application of Fourier analysis to the description and statistical analysis of refractive error, Optometry and Vision Science.1997; 74:367-75.
- Meister D, Sheedy JE. Introduction to Ophthalmic Optics. SOLA Optical USA.2000.
- Lin V, Wei HC, Su GD. Shack-Hartmann wave front sensor with high sensitivity by using long focal length micro lens array, In SPIE Optical Engineering and Applications.2011;8:16-50.
- Neal DR, Copland RJ, Neal DA, et al. Measurement of lens focal length using multi curvature analysis of Shack-Hartmann wave front data, In Optical Science and Technology, the SPIE 49th Annual Meeting.2004;1:243-55.
- Villegas EA, Artal P. Comparison of aberrations in different types of progressive power lenses, Ophthalmic and Physiological Optics.2004;24:419-26.
