Research Article - Biomedical Research (2016) Computational Life Sciences and Smarter Technological Advancement
Optimization of feature vectors for art classifier in language independent speaker recognition system for biometric security
A Jose Albin1*, NM Nandhitha21Department of Computer Science, Sathyabama University, Chennai 600119, Tamil Nadu, India
2Department of Electrical and Electronics, Sathyabama University, Chennai 600119, Tamil Nadu, India
Accepted on May 11, 2016
Abstract
Automated speaker recognition from speech signals plays a major role in the field of biometrics to authenticate the speaker. Though considerable research is carried out in this area, sensitivity and specificity of the proposed technique are not satisfactory. In this paper, language independent speaker recognition system using spectral features is proposed to increase the sensitivity of speaker recognition. Flux, short time energy, centroid, pitch, period and number of peaks are extracted from time domain coefficients, autocorrelation coefficients, discrete wavelet coefficients and cepstrum coefficients. Adaptive Resonance Theory (ART) network is used for identifying the speaker from the above features. From the research, it is found that the combination of features provides the best sensitivity for speaker recognition. In addition to the spectral domain features, time domain features also add intelligence to the proposed technique by increasing the accuracy to above 98%.
Keywords
Biometric security, Speaker recognition, Adaptive resonance theory, Spectral features.
Introduction
In certain applications like defence, forensic, biometric security and search engines, large volumes of audio signals are stored, transmitted and processed through networking. These applications aim at identifying the speaker from his/ her audio signals in order to provide access. Of the various biometric systems, speech recognition system is simple to implement as it does not require a specialized sensor for signal acquisition and processing. In such systems, a large volume of speech signals of authorized persons is acquired. Same set of features are determined for the key speech signal and is compared with that of the database signals. If these parameters match, the speaker is permitted. Else, he is denied access. Clustering and classification are the two important identification techniques. Patel and Nandurbarkar developed a speaker recognition system for Guajarati language. Weighted Mel Frequency Cepstral Coefficients (MFCC) features extracted from the speech samples are given to Gaussian Mixture Model (GMM) for classification. The recognition rate is high for weighted MFCC [1]. In recent years soft computing techniques are widely used for ranking the audio signals. Richardson et al. presented a Deep Neural Network (DNN) feature extraction for speaker and language recognition to improvise the system performance. The authors used an indirect mechanism for automatic speaker recognition in which frame level features are extracted from a DNN to accumulate multi modal statistics. The extracted features are trained using i-vector system [2]. Vimala and Radha developed a speaker independent isolated speech recognition system for Tamil language. MFCC features were extracted and given to six different classifiers to study the performance of the system.
Dynamic Time Warping (DTW), Hidden Markov Model (HMM), GMM, Neural Networks (NN), Support Vector Machine (SVM), and Decision Trees (DT) are the classifier used. Compared to all the classifiers, the recognition accuracy achieved is more using HMM [3]. Mishra and Shukla developed separate modules for speaker identification and gender identification using multilingual speech signal. MFCCs and delta-MFCCs, LPC, LPCC, Formants, Zero Crossing Rate (ZCR) were extracted from the multilingual speech signal. Radial Basis Function (RBF) and Resilient Back Propagation Network (RBPN) are used for classification. RBPN showed better results compared to RBF [4]. Daqrouq et al. proposed a speaker identification system for noisy environment. Speakerspecific resonances of the vocal tract were extracted using the average framing linear prediction coding (AFLPC) technique. Probabilistic Neural Network (PNN) and Bayesian Classifier (BC) are used for classification process. The PNN classifier with the fusion of wavelets provides better performance [5]. Medhi and Talukdar proposed Assamese speaker recognition system for text dependent and text independent speaker recognition. Linear Predictive Coding (LPC) and MFCC are the features extracted from the voice signals. These features are used for training followed by testing and recognition using artificial neural network [6]. Some of the other works in the literature used MFCC and SVM [7], artificial neural network and Hidden markov model (HMM) [8] and deep neural network [9].
However the performance of the classifiers can be greatly improved with a proper choice of the features used for describing the audio signals. Also, the above neural networks suffer from elasticity plasticity instability, which means that if the networks are trained with the new set of data, they forget the old data set. Hence the major challenges in developing speaker recognition system are in identifying features which have lesser intra class variance and higher inter class variance and using a classifier that has elasticity plasticity equilibrium. In this work, flux, short time energy, centroid, pitch, period and number of peaks are used for describing the audio signals. These features are derived from both time domain and spectral domain coefficients of the audio signals. An ART classifier is used for retrieving and ranking the audio signals. This paper is organized as follows: Section 2 deals with the data base collection which is the backbone of this research. In section 3, the methodology is discussed. Results and discussions are elaborated in section 4. This paper is concluded with future scope in section 5.
Research database
An extensive research database is created and maintained for implementation of the proposed speaker recognition system. The database consists of speech signals acquired from 7 male and 3 female speakers (age group of 18-22 years). From each speaker, a total of 30 signals are collected (10 in Tamil, 10 in Telugu and 10 audio signals of English). A total of 330 signals in three different languages are acquired by deliberately varying the frequency, pitch and timbre. Figure 1 shows the tree diagram of audio signal acquisition.

Figure 1 : Database collection.
Material and Methods
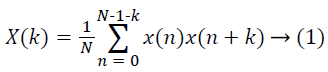
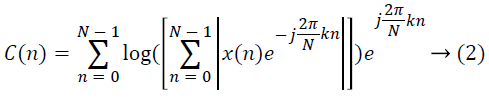
Of the various features used for describing speech signals, flux, short time energy, centroid, pitch, period and number of peaks are considered in this work. Choice of these features is based on the following facts: The rate of vibrations in the vocal fold determines the fundamental frequency which in turn can be obtained from the pitch [10]. Period is an indicator of the size and tension of the speaker’s vocal folds. Centroid is the measure of high frequency component in the audio signal [11]. For a frame of speech signal {x(n), n=0,1,..,N-1}, and k=0,1,..,N-1, autocorrelation coefficients are extracted using equation 1 [12], cepstrum coefficients using equation 2 [13] and wavelet transform coefficients using equation 3 [14].
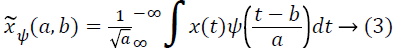
Where Wavelet spectrum of a signal x(t) is 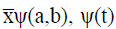 is the
wavelet function, a represents scale and b represents time
translation. Similarly ART classifier is chosen because it can
be trained with both supervised and unsupervised learning
techniques. In an ART network, learning occurs only after
reaching the resonant state. During resonance, if a new pattern
is provided, the network rapidly searches its stored patterns for
a match. If no match is found, the new pattern is stored. In this
way elasticity plasticity stability is obtained [15-17 ]. The flow
diagram for the proposed speaker recognition system is shown
in Figure 2. Performance of the proposed system is measured
in terms of sensitivity.
is the
wavelet function, a represents scale and b represents time
translation. Similarly ART classifier is chosen because it can
be trained with both supervised and unsupervised learning
techniques. In an ART network, learning occurs only after
reaching the resonant state. During resonance, if a new pattern
is provided, the network rapidly searches its stored patterns for
a match. If no match is found, the new pattern is stored. In this
way elasticity plasticity stability is obtained [15-17 ]. The flow
diagram for the proposed speaker recognition system is shown
in Figure 2. Performance of the proposed system is measured
in terms of sensitivity.

Figure 2: Flow diagram for the proposed system.
Results and Discussion
From each signal 1024 samples (sample number 10000 to 11024) were considered for processing. Flux, short time energy and centroid are determined from the time domain coefficients of the preprocessed audio signals. Autocorrelation of the preprocessed audio signal for the first male speaker in three different languages (English, Tamil, Telugu) are shown in Figure 3. Similarly approximation and detailed coefficients of the same speaker in three different languages are shown in Figures 4 and 5 respectively. For the first speaker, the sample speech waveforms in all the three languages (Telugu, Tamil and English) and the corresponding cepstral coefficients are shown in Figures 3-5. Period, Pitch and Number of peaks obtained from Discrete Wavelet Transform coefficients of the speech signals is shown in Table 1. For 5 speakers, samples of three signals in each language is listed in Table 1. Since Discrete meyer wavelet provides higher inter class variance and lesser intra class variance, it is considered for extracting the features [18].

Figure 3: Waveforms obtained for sample 1 (male speaker-Telugu).

Figure 4: Waveforms obtained for sample 1 (male speaker-Tamil).

Figure 5: Waveforms obtained for sample 1 (male speaker-English).
| Speaker | DWT | ||
|---|---|---|---|
| Period | Pitch | No. Of Peaks | |
| 1 | 0.351648 | 0.09375 | 0.329073 |
| 0.362637 | 0.090909 | 0.329073 | |
| 0.054945 | 0.6 | 0.654952 | |
| 2 | 0.483516 | 0.068182 | 0.169329 |
| 0.417582 | 0.078947 | 0.15655 | |
| 0.406593 | 0.081081 | 0.099042 | |
| 3 | 0.43956 | 0.075 | 0.099042 |
| 0.054945 | 0.6 | 0.169329 | |
| 0.615385 | 0.053571 | 0.067093 | |
| 4 | 0.054945 | 0.6 | 0.744409 |
| 0.230769 | 0.142857 | 0.456869 | |
| 0.043956 | 0.75 | 0.840256 | |
| 5 | 0.065934 | 0.5 | 0.559105 |
| 0.516484 | 0.06383 | 0.086262 | |
| 0.78022 | 0.042254 | 0.054313 | |
Table 1. Spectral features using DWT.
For the same sample of 5 speakers, the spectral features obtained using autocorrelation function is shown in Table 2.
| Speaker | Autocorrelation | ||
|---|---|---|---|
| Period | Pitch | No. Of Peaks | |
| 1 | 0.372881 | 0.075758 | 0.326861 |
| 0.378531 | 0.074627 | 0.521036 | |
| 0.056497 | 0.5 | 0.61165 | |
| 2 | 0.502825 | 0.05618 | 0.113269 |
| 0.423729 | 0.066667 | 0.126214 | |
| 0.412429 | 0.068493 | 0.100324 | |
| 3 | 0.446328 | 0.063291 | 0.093851 |
| 0.056497 | 0.5 | 0.165049 | |
| 0.621469 | 0.045455 | 0.055016 | |
| 4 | 0.050847 | 0.555556 | 0.71521 |
| 0.028249 | 1 | 0.902913 | |
| 0.050847 | 0.555556 | 0.747573 | |
| 5 | 0.067797 | 0.416667 | 0.488673 |
| 0.536723 | 0.052632 | 0.080906 | |
| 0.80791 | 0.034965 | 0.048544 | |
Table 2. Spectral features using autocorrelation.
In Table 3, the feature obtained using cepstrum for the sample of 5 speakers in all the three languages in listed.
| Speaker | Cepstrum | ||
|---|---|---|---|
| Period | Pitch | No. Of Peaks | |
| 1 | 0.090909 | 1 | 0.896507 |
| 0.090909 | 1 | 0.780078 | |
| 0.090909 | 1 | 0.847348 | |
| 2 | 0.090909 | 1 | 0.800776 |
| 0.363636 | 0.25 | 0.715395 | |
| 0.363636 | 0.25 | 0.761966 | |
| 3 | 0.090909 | 1 | 0.74903 |
| 0.090909 | 1 | 0.697283 | |
| 0.136364 | 0.666667 | 0.761966 | |
| 4 | 0.090909 | 1 | 0.712807 |
| 0.090909 | 1 | 0.761966 | |
| 0.090909 | 1 | 0.805951 | |
| 5 | 0.090909 | 1 | 0.583441 |
| 0.136364 | 0.666667 | 0.761966 | |
| 0.318182 | 0.285714 | 0.733506 | |
Table 3. Spectral features using autocorrelation.
Period, pitch and number of peaks from DWT, autocorrelation and cepstrum coefficients for English for 11 speakers is shown in Figure 6. Similarly for Telugu, it is shown in Figure 7.

Figure 6: A) Period, B) Pitch, C) Number of peaks from DWT, Autocorelation and Cepstrum Coefficients for English.

Figure 7: A) Period, B) Pitch, C) Number of peaks from DWT, Autocorelation and Cepstrum Coefficients for Telugu.
From the Figures 6 and 7, it is found that pitch, number of peaks and period from cepstrum co-efficients has lesser interclass variance when compared to that obtained from autocorrelation and DWT coefficients. Pitch and period from the DWT coefficients has the highest interclass variance. However, the intraclass variance of pitch and number of peaks from the cepstrum coefficients is lesser than the other techniques. Hence training with a combination of these parameters will provide better results when compared to that of training with individual techniques. The features extracted using the spectral coefficients, whose samples were listed in Tables 1-3 are given to an ART classifier. A total of 330 speech signals is given to an ART classifier for training and 165 signals were considered for testing.
The sensitivity is calculated for finding the efficiency of the transform used for extracting the features. Sensitivity achieved for various speakers using time domain coefficients is shown in Figure 8 shows the sensitivity graphs for various speakers using DWT, autocorrelation and cepstrum features.

Figure 8: Sensitivity for various speakers using, A) Time domain; B) DWT; C) Autocorrelation; D) Cepstrum; E) DWT, cepstrum and autocorrelation coefficients.
The features obtained using DWT, autocorrelation and cepstrum coefficients were combined and given as the input to the ART classifier for training process. So a total of 9 features for each speaker is obtained and given to the ART classifier. Sensitivity calculated from the testing process for all the speakers is shown in Figure 8D.
In Table 4, the consolidated sensitivity percentage for all the speech signals of each speaker using various transforms is listed. From the obtained results it is clear that, the combination of all the features using the transforms DWT, autocorrelation and Cepstrum gives 100 % speaker recognition.
| Speaker | Centroid, Short Time Energy, Flux | DWT With Period, Pitch, No. Of Peaks, | Autocorr With Period, Pitch, No. Of Peaks, | Cepstrum With Period, Pitch, No. Of Peaks, | DWT &Cepstrum&Autocorr |
|---|---|---|---|---|---|
| Male #1 | 73.33 | 93.33 | 93.33 | 73.33 | 100 |
| Male #2 | 100 | 80 | 100 | 80 | 100 |
| Male #3 | 13.3 | 100 | 100 | 80 | 100 |
| Male #4 | 40 | 86.66 | 93.33 | 80 | 100 |
| Male #5 | 40 | 86.66 | 93.33 | 80 | 100 |
| Male #6 | 60 | 86.66 | 93.33 | 93.33 | 100 |
| Male #7 | 66.66 | 73.33 | 86.66 | 66.66 | 100 |
| Female #1 | 93.33 | 80 | 93.33 | 66.66 | 100 |
| Female #2 | 86.66 | 100 | 86.66 | 66.66 | 100 |
| Female #3 | 20 | 80 | 100 | 20 | 100 |
| Female #4 | 40 | 93.33 | 86.66 | 80 | 100 |
Table 4. Sensitivity for various feature extraction techniques.
The comparison chart depicting the sensitivity for all the speakers using various feature extraction techniques is shown in Figure 9. The performance of the proposed ART based classifier is compared with the Gaussian mixture models and universal background models [19] (GMM and UBM proposed by Billeb et al.) in terms of sensitivity and number of false rejections. Seven speakers from the database are considered for this comparison. Speaker recognition performed using autocorrelation features, cepstrum features and DWT features using GMM&UBM system were shown Figure 10. The sensitivity and the number of false rejections obtained using the GMM&UBM system is shown in Table 5 and Table 6. In Tables 7 and 8, the sensitivity and number of false rejections obtained using the proposed ART based classifier system are listed.

Figure 9: Sensitivity comparison for various feature extraction techniques.

Figure 10: Speaker recognition using, A) Autocorrelation; B) Cepstrum; C) DWT features (GMM&UBM).
| Speaker | Sensitivity | ||
|---|---|---|---|
| DWT | Autocorr | Cepstrum | |
| 1 | 13.33 | 16.6 | 10 |
| 2 | 3.33 | 6.66 | 26.66 |
| 3 | 10 | 10 | 6.66 |
| 4 | 5 | 13.3 | 6.66 |
| 5 | 50 | 46.66 | 10 |
| 6 | 16.66 | 3.33 | 30 |
| 7 | 3.33 | 10 | 3.33 |
Table 5. Sensitivity obtained using GMM&UBM.
| Speaker | False Rejections | ||
|---|---|---|---|
| DWT | Autocorr | Cepstrum | |
| 1 | 26 | 25 | 27 |
| 2 | 29 | 28 | 22 |
| 3 | 27 | 27 | 28 |
| 4 | 30 | 26 | 28 |
| 5 | 15 | 16 | 30 |
| 6 | 25 | 29 | 21 |
| 7 | 29 | 27 | 29 |
Table 6. False rejections obtained using GMM&UBM.
| Speaker | Sensitivity | |||
|---|---|---|---|---|
| DWT | Autocorr | Cepstrum | DWT&Autocorr&Cepstrum | |
| 1 | 90 | 96.6 | 86.66 | 100 |
| 2 | 93.33 | 96.6 | 90 | 100 |
| 3 | 90 | 80 | 33.3 | 100 |
| 4 | 70 | 56.66 | 30 | 100 |
| 5 | 60 | 73.33 | 66.66 | 100 |
| 6 | 80 | 90 | 80 | 100 |
| 7 | 73.33 | 80 | 80 | 100 |
Table 7. Sensitivity obtained using proposed system.
| Speaker | False Rejections | |||
|---|---|---|---|---|
| DWT | Autocorr | Cepstrum | DWT&Autocorr&Cepstrum | |
| 1 | 3 | 1 | 4 | 0 |
| 2 | 2 | 1 | 3 | 0 |
| 3 | 3 | 6 | 20 | 0 |
| 4 | 9 | 13 | 21 | 0 |
| 5 | 12 | 8 | 10 | 0 |
| 6 | 6 | 3 | 6 | 0 |
| 7 | 8 | 6 | 6 | 0 |
Table 8. False rejections obtained using proposed system.
The number of false rejections obtained by the existing GMM&UBM model and the proposed ART based classifier system using DWT features, autocorrelation features and cepstrum features were compared and the results are shown in Figure 11.

Figure 11: False rejection comparison for, A) Autocorrelation; B) Cepstrum; C) DWT features.
From the Tables 5-8 and from the Figure 11, it is found that the proposed ART based classifier system outperforms the existing systems.
Conclusion and Future Direction
An efficient Speaker recognition system is developed using an ART network based on the features extracted from the transformed co-efficients of the audio signals. In this paper, various transformations like DWT, autocorrelation and cepstrum are considered. Pitch, number of peaks and period are the features extracted from the transformed coefficients. It is found that sensitivity is high and above 98% for the combination of features. Major contribution of the proposed work is that these features are obtained in such a way that irrespective of the spoken language, the speaker is identified and provided access. However the feasibility of proposed system in robust environment is yet to be explored. In future, the technique is to be modified for speech signals affected by noise in real time environment. Hardware can be implemented for the proposed work for biometric security.
References
- Patel J, Nandurbarkar A. Development and Implementation of Algorithm for Speaker recognition for Gujarati Language.Int Res J EngTechnol2015; 2: 444-448.
- Richardson F, Reynolds D, Dehak N. A Unified Deep Neural Network For Speaker And Language Recognition.INTERSPEECH 2015.
- Vimala C, Radha V. Isolated Speech Recognition System For Tamil Language Using Statistical Pattern Matching And Machine Learning Techniques. J EngSciTechnol2015; 10: 617-632.
- Mishra PKȦ, Shukla A. Speaker and Gender Identification using Multilingual Speech.Int J Comput System 2015; 2: 283-287.
- Daqrouq K, Al-Hmouz R,Balamash AS, Alotaibi N, Noeth E. An Investigation of Wavelet Average Framing LPC for Noisy Speaker Identification Environment. Math Problem Eng2015.
- Medhil B, Talukdar PH. Assamese Speaker Recognition Using Artificial Neural Network.Int J Adv Res ComputCommunEng2015; 4: 321-324.
- Baradiya A, Jain V. Speech and Speaker Recognition Technology using MFCC and SVM. SSRG Int J Electronic CommunEng2015; 2: 23-26.
- New TT, Myint T. Myanmar Language Speech Recognition with Hybrid Artificial Neural Network and Hidden Markov Model. International Conference on Future Computational Technologies, Singapore, 2015, 116-122.
- Richardson F, Reynolds D, Dehak N. Deep Neural Network Approaches To Speaker And Language Recognition. IEEE Signal Process Lett2015; 22: 1671-1675.
- Beigi H. Fundamentals of Speaker Recognition. Springer, Berlin, 2011.
- Albin AJ, Nandhitha NM. Audio Signal Recognition System Based On Vocal Features. Res J Pharmaceutical BiolChemSci2015.
- Chanda A, Jyothi D, Roja M. Text-Independent Speaker Recognition for Low SNR Environments with Encryption.Int J Comp Appl 2011;31: 43-50.
- Devi S, Yarramalle S, Nandyala SP. Speaker Emotion Recognition Based on Speech Features and Classification Techniques.Int J Comput Network Inform Security 2014; 7: 61-77.
- Ziółko M, Samborski R, Gałka J, Ziółko B. Wavelet-Fourier Analysis For Speaker Recognition.Zakopane-Ko´scielisko 2011.
- https://en.wikipedia.org/wiki/Adaptive_resonance_theory
- David VK, Rajasekaran S. Pattern Recognition Using Neural and Functional Networks, Springer, Berlin, 2008.
- Albin J, Nandhitha NM, Roslin SE. ART Network based Text Independent Speaker Recognition System for Dynamically Growing Speech Database: In: Proceedings of the 3rd International Conference on Frontiers of Intelligent Computing: Theory and Applications (FICTA), Springer, Berlin, 2014.
- Albin AJ, Nandhitha NM, Roslin SE. Text Independent Speaker Recognition System using Back Propagation Network with Wavelet Features. IEEE International Conference on Communication and Signal Processing, 2014.
- Billeb S, Rathgeb C, Reininger H, Kasper K, Busch C. Biometric template protection for speaker recognition based on universal background models. Biometrics 2015; 4: 116-126.