- Biomedical Research (2016) Volume 27, Issue 3
Numerical simulation on the dynamic behavior of the basilar membrane in the spiral cochlea.
Wenjuan Yao*, Yiqiang Chen, Jianwei Ma, Chaosun Gan, Dejiang Wang*
Department of Civil Engineering, Shanghai University, Shanghai 200444, China
- Corresponding Authors:
- Wenjuan Yao
Department of Civil Engineering
Shanghai University, China - Dejiang Wang
Department of Civil Engineering
Shanghai University, China
Accepted Date: April 14, 2016
Abstract
In this paper, a three dimensional spiral cochlear finite element model is established based on the experimental data of the actual right human ear to study the curvature effect on the amplitude of the spiral basilar membrane (BM). Harmonic response analysis is then carried out. The simulation results are in good agreement with the published experimental results, which confirm the validity of the FE model, and show that the curvature has a great effect on the amplitude of the BM in a transverse direction at high frequency. Meantime, the spiral geometrical characteristic of the BM plays an important role in the amplification of BM amplitude to sound pressure.
Keywords
Spiral cochlea, Amplitude of BM, Amplification, Travelling waves
Introduction
The sound is conducted to the inner ear through the ear canal and ossicular chain. Because of the vibration of BM in the cochlea, a row of cilium situated on the hair cells causes shearing between the reticular lamina at the top of the organ of Corti and the tectorial membrane (TM), which make the stereocilium of outer hair cells bending. The recent research has found that sound perception function of the inner ear is occurred because of the complex coupling among the BM, hair cells and lymph which make the cilium large deformation [1]. Since the hair cells can produce active feedback to the BM, which will affect the sound perception function of cochlea. The stiffness, arrangement and motility of the hair cells in spiral cochlea are analyzed by many scholars through experiments [2-4]. Meanwhile, the research has showed that when the outer hair cells are bending, the amplification for the sound is made by the interaction between the hair-bundle motility and somatic motility and sound perception function of the inner ear is enhanced [5].
However, it has been found that the BM will be accompanied by a corresponding vibration in the test of spontaneous otoacoustic emission [6,7] and speculated that the amplification of amplitude of the BM may be affected by the same process. So the process of sound perception of the inner ear is very complex and a lot of phenomena have not yet reached a consensus. But the recent research indicates that the certain molecules in the brain can be changed because of the damage to the inner ear, which will cause bad behaviour [8]. According to the different site of injury of the inner ear and different reasons of ear deafness, the corresponding solution is put forward [9-11]. Therefore, the investigation of the inner ear has always caught the scholars’ high attention. With the enrichment of contents and objects of the inner ear experiment, it promotes the research on cochlea in numerical simulation. In terms of macromechanics, passive dynamics behavior of BM is the key and the finite element model of the cochlea has been constantly improved and becomes more accurate.
Thorne et al got early cochlear fluid space from the six species by magnetic resonance, providing a basis for calculating the fluid movement in the inner ear and for the clinical operation [12]. Then Edward et al. [13] and Lei et al. [14] had successively established three-dimensional macro-model of cochlea. In order to get the explanation and discussion of clinical measurements like otoacoustic emissions and auditory brainstem responses, Bohnke et al. [15] developed a threedimensional mechanical model of the cochlea including the fluid-structure couplings. Skrodzka [16,17] built a simple three-dimensional passive and active models of the human basilar membrane and a linear input-output function of passive and active models and very small values of the basilar membrane velocities were obtained and it could predict main characteristics of the modified BMs showing that all modifications might affect calculated curves in most cases. A hybrid analytical-numerical model using Galerkin approximation had been developed by Parthasarathi et al. [18] for predicting global cochlear responses and it showed that basilar membrane velocity close to best place is influenced by fluid and structural discretization.
Furthermore, in order to study the vibration mode of BM, Yoon et al. established a three-dimensional hydrodynamic model to observe the velocity of the BM [19]. Gan et al. for the first time established a complete model of the ear which contained external ear canal, middle ear, and simplified cochlea and made researches on the middle ear and BM. Then in the study of implantable hearing device, although Gan et al. established the spiral model of cochlea, there is no in-depth analysis [20-22]. With the in-depth study of the inner ear, micro-model was gradually established to study the evolution of hair cells and fiber cells, laying the foundation for further study [23,24]. In terms of macro-model of cochlea, the uncoiled model of the cochlea has been mainly used. Many contents of the research for now focused on the calculated pressure from the oval window to the top of the cochlea and the motion of BM along the longitudinal cochlea [25-29] and others had investigated the BM profile over its width and studied effects of BM modes [30,31]. However, the fluid-structure coupling motion of BM in a transverse direction with the finite element method is not taken into account. In view of this, the spiral model of cochlea which is in accordance with the actual human ear will be established in this paper. Fluid-structure coupling between the lymph and the surrounding structures will be taken into account. The effect that the curvature makes on the amplitude of the BM in a transverse direction at high frequency will be studied. Meantime, the amplification on sound intensity is achieved.
Cochlear Model
FE model of the spiral cochlea
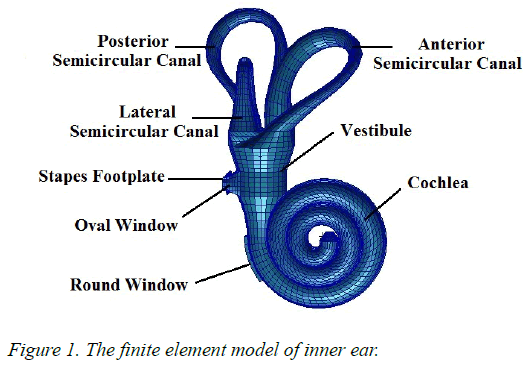
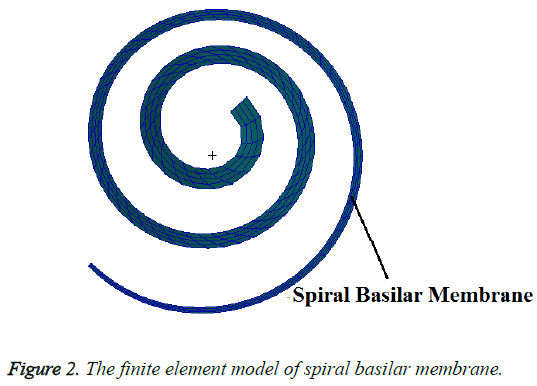
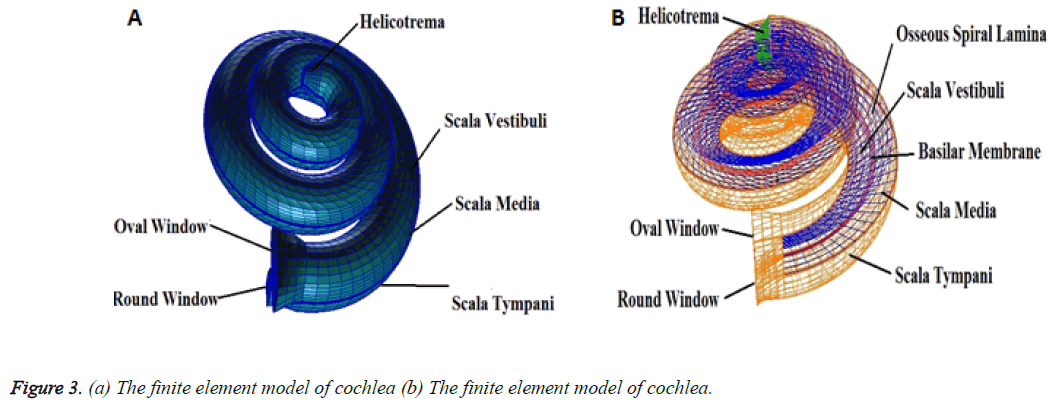
Patran software was used to establish a three-dimensional finite element model of human spiral cochlea which was simplified from the inner ear (Figure 1) and the geometry of this model was based on dimensions published in the literature [12,22,32]The model was divided into grid, and its boundary conditions and the material parameters were defined. The spiral inner ear has 2.5 period. The space inside cochlea was divided into three chambers by the Reissner’s membrane (RM) and the basilar membrane (BM): scala vestibule (SV), scala media (SM), and scala tympani (ST) and filled with viscous perilymphatic fluid (Figure 3). The ratio of cross-section area between SV, SM, and ST was 5:3:8 along the cochlear length. The total curved length of BM was 34.86 mm. The width of BM changed linearly from 0.1 mm at the base to 0.5 mm at the apex and the thickness also changed linearly from 7.5 μm at the base to 2.5 μm at the apex (Figure 2). In the model, the micromechanical structure of the organ of Corti was not included. So it was a passive model. Then a fluid- solid coupling dynamic analysis was carried out by Nastran software.
As was shown in Figure 3, the scala vestibuli, scala media and scala tympani were meshed by 1900, 6400 and 6200 eightnoded hexahedral fluid elements, respectively. The helicotrema was filled with fluid and meshed by 725 eight-noded hexahedral fluid elements. The oval window and round window were meshed by a total of 83 and 62 four-noded quadrangular two-dimensional membrane elements, respectively. The BM and RM were meshed by 400 and 1000 four-noded quadrangular two-dimensional membrane elements respectively and BM had the inner and outer supports or the spiral lamina and spiral ligament structure that were meshed by 600 four-noded quadrangular two-dimensional membrane elements.
Material properties
Material properties used for cochlear structures included density and Young’s modulus of the oval and round windows, the inner and outer supports of the BM along the cochlear partition, the RM and the BM were listed in Table 1. In this study, the Young’s modulus of the BM was gradually decreased from the base to the apex. The Young’s modulus at the base was assumed as 50 MPa, linearly decreased to 3 MPa at the apex along the BM length. The properties of lymph were listed in Table 2.
| Modulus (MPa) | Density (t/mm3) | Thickness (mm) | |
|---|---|---|---|
| Osseous spiral lamina | 141 | 2.2E-009 | 0.1 |
| Oval window | 40 | 1.2E-009 | 0.1 |
| Round window | 0.2 | 1.2E-009 | 0.01 |
| Reissner’s membrane | 15 | 1.2E-009 | 0.005 |
Table 1. Material properties used for cochlear structures.
| Velocity (m.s-1) | Damping | Density (t/mm3) | |
|---|---|---|---|
| Lymph | 1400 | 0.0007 | E-009 |
Table 2. The properties of lymph in cochlea.
Boundary conditions
Uniform pressure of 80 dB SPL (0.2 Pa) was applied on the opening surface of the oval window (from 100Hz to 10000Hz). The outer edges of round window and oval window were defined as the fixed constraint. The BM and RM were fluidstructure coupling interfaces.
Results and Discussion
Verification of the FE model
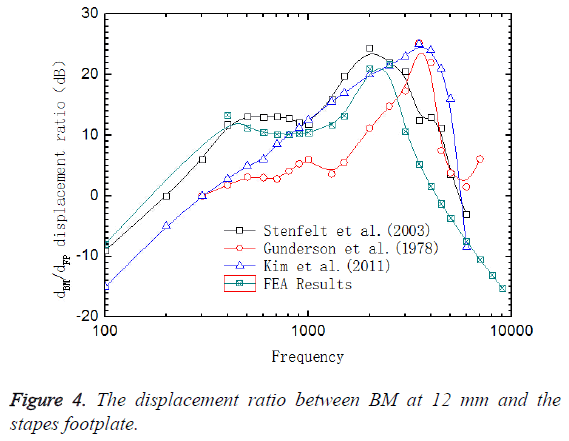
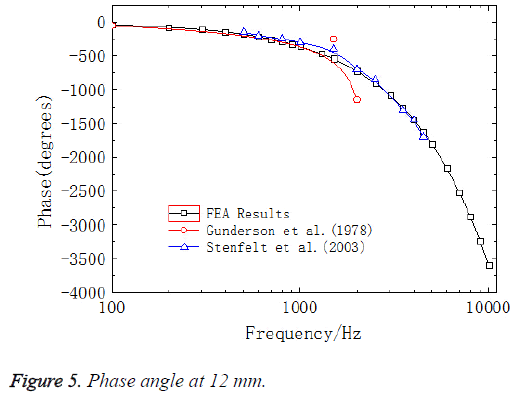
The sound pressure of 80 dB (0.2 Pa) was applied on the surface of the oval window, which was equivalent to 90 dB on the surface of the external ear canal, to have a frequency response analysis to obtain the frequency response curves of the ratio of displacements at 12 mm on BM and at the center of stapes footplate (center of the oval window), (Figure 4). The experimental data of Gundersen et al. [33] and Stenfelt et al. [34] and the results that Kim [35] obtained from FE model were also shown in Figure 4. Figure 5 showed the comparison between the phase curves in this model and the experimental data of Gundersen et al. and Stenfelt et al.
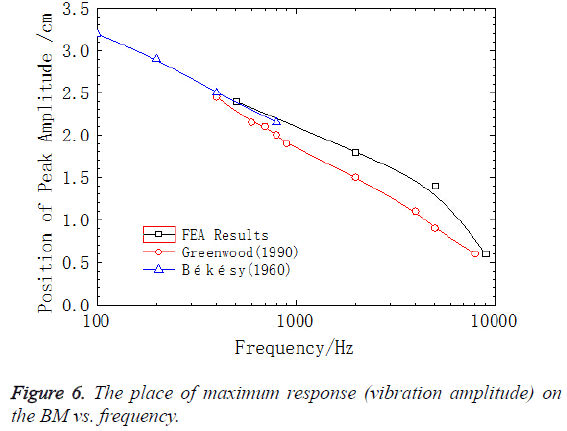
As shown in Figure 4, the characteristic frequency in the experiment of Gundersen et al. was 3500 Hz, which was consistent with the results from Kim’s FE model. However, the characteristic frequency in this paper is 2500 Hz, which was close to the experimental data of Stenfelt et al. So the results from this model agrees well with the experimental data. Figure 6 displayed the location of peak amplitude of the BM across the frequency along the longitudinal dimension from the base to apex. The solid black line represented the results from the model in this paper and the solid red line and the solid blue line represented the results from the model of Greenwood et al. [36] and the experimental data measured by von Békésy [37], respectively. As could be seen in Figure 6 reasonable agreement existed between our results and von Békésy’s measurements. In addition, the location of the peak amplitude of BM varied with different frequencies along the longitudinal dimension from the base to apex, which proved the frequency sensitivity of the BM along its length.
Motion of spiral BM
The simplified cochlear model that was modelled as an uncoiled, dual chambered fluid filled duct was always used before to study the motion of the cochlea. However, in the simplified model, the BM was straight and the motion of BM in a transverse direction was the same. The motion of the BM in a transverse direction could not be analysed. Therefore, in order to study the curvature effect on BM, the spiral BM was established in this paper.
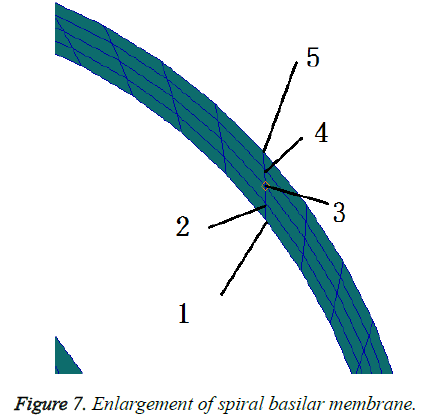
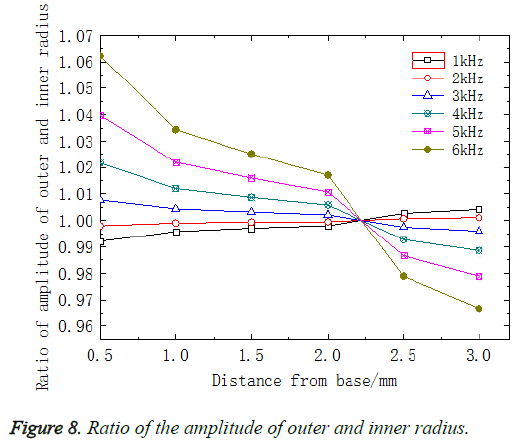
To achieve the motion of BM as the curvature changed, at any cross-section of the BM, the displacement amplitude of the inner radius which is the shortest was set to 1 and the displacement amplitude of the outer radius which is the longest was set to 5, as shown in Figure 7. The variation of the ratio of the amplitude of outer and inner radius which could reveal the maximum variation because of the curvature along the longitudinal dimension of BM was shown in Figure 8. Figure 8 displayed the distribution of the ratio of the amplitude of outer and inner radius along the longitudinal dimension of BM with six different frequencies from 1 kHz to 6 kHz. It could be clearly observed in Fig 8 that the curves intersected at 22 mm which could be analysed in detail. At frequency of 1 kHz and 2 kHz, the ratio of the amplitude of the outer and inner radius along the longitudinal dimension of BM increased gradually. However, at frequency from 3 kHz and 8 kHz, the ratio decreased. This was because that high-frequency resonated at the base of the BM and low-frequency resonated at the apex of the BM, which caused the ratio increasing of the amplitude of the outer and inner radius.
Since there was an intersection at 22 mm in Figure 8 which meant that it was maybe a special position in comparison with others and the results at 12 mm of BM were in good agreement with the experiment data, the cross-section at 22 mm and 12 mm from the base of the BM were suitable to be chosen for analysing the amplitude of the BM in a transverse direction and at the same time taking the curvature effect into account.
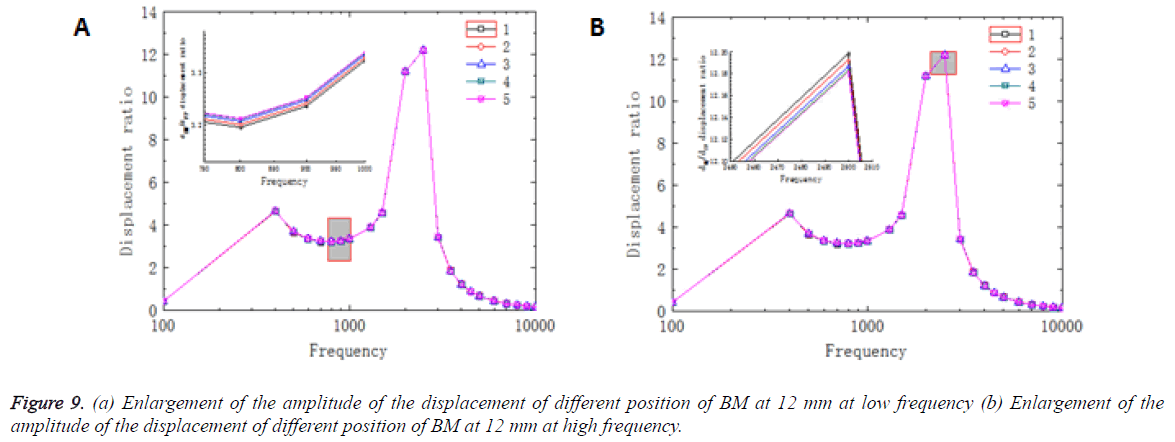
Figure 9 showed that the ratio of displacement between each position at 12 mm and the center of stapes footplate varied in response to different frequencies. As shown in Figure 9a, the displacement ratio of different position had a same trend in the frequency range of 100-10000Hz and they reached the maximum value at frequency of 2500Hz. In enlarge-figure of Figure 9a, the amplitude of the BM displacement increased as curvature decreased. Moreover, in Figure 9b, although the magnitude relation of different points at the peak portion was too small, it could show that the amplitude of the displacement of different position of BM in a transverse direction varied in response to different frequencies and increased as curvature decreased.
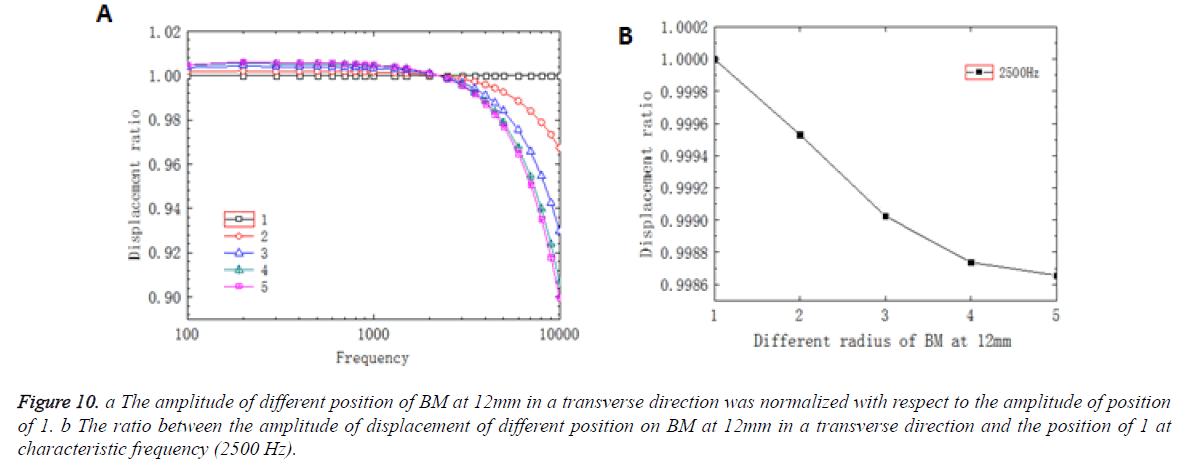
Figure 10a showed that the curves of different position had a similar trend, but the deviation increased gradually, which meant that the amplitude increased as the curvature decreased. The deviation was relatively little at frequency below 2500 Hz and the curve changed suddenly around 2500 Hz which agreed well with characteristic frequency in this position. So the location of characteristic frequency was the turning point for the BM displacement in a transverse direction. After the turning point, the deviation increased rapidly at high frequency, which indicated that the amplitude decreased as the curvature decreased. In summary, the curvature had an effect on the amplitude of BM, which had not been shown in the uncoiled model before.
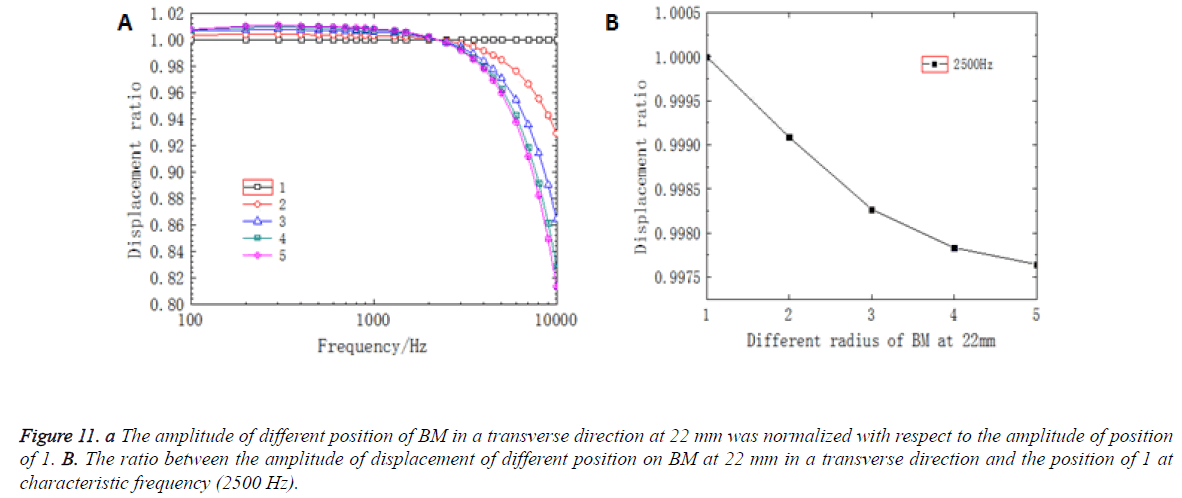
Figure 10b showed the ratio between the displacement amplitude of different position on BM at 12 mm in a transverse direction and the position of 1 at characteristic frequency (2500 Hz). In Figure 10b, the amplitude of BM decreased as the curvature decreased and the trend of decreasing gradually flattened out. The trend of the amplitude of BM at 22 mm in a transverse direction in response to different frequencies was shown in Figure 11a. Compared with the curves at 12 mm, the displacement curves at 22 mm had a same trend and the intersection was occurred at around 2500 Hz. In Figure 11b, the amplitude of BM decreased nonlinearly as the curvature decreased. However, comparing the position of 12 mm, the deviation of the amplitude in response to different frequencies and the value of decreasing at different position in the same frequency that was at 22 mm were relatively large.
Figure 10: a The amplitude of different position of BM at 12mm in a transverse direction was normalized with respect to the amplitude of position of 1. b The ratio between the amplitude of displacement of different position on BM at 12mm in a transverse direction and the position of 1 at characteristic frequency (2500 Hz).
Figure 11: A The amplitude of different position of BM in a transverse direction at 22 mm was normalized with respect to the amplitude of position of 1. B. The ratio between the amplitude of displacement of different position on BM at 22 mm in a transverse direction and the position of 1 at characteristic frequency (2500 Hz).
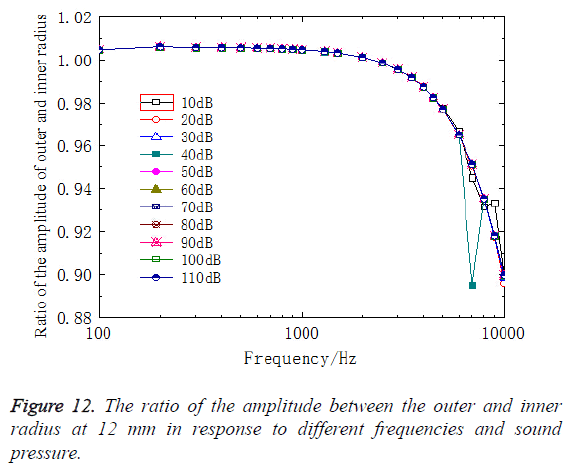
Figure 12 showed the relationship between the ratio of the amplitude between the outer and inner radius at 12 mm and sound pressure. Each of these curves in Figure 12 is a representative of the relationship between the ratio of the amplitude between the outer and inner radius and sound pressure from 10 dB to 110 dB. As can be seen in Figure 12, the variation of the amplitude between the outer and inner radius was nearly flat across the frequency below 2500 Hz. However, the situation was opposite above 2500 Hz and the variation changed rapidly as frequencies increased. It indicated that high-frequency had a great effect on the BM displacement of different curvature. Moreover, most of results from different sound pressure had a same trend, except 40 dB which the curve had an obvious deviation at high frequency. It showed that the non-linearity of the BM was not obvious which might be the reason that the material properties of the basilar membrane are elastic.
Amplification of the sound pressure by BM
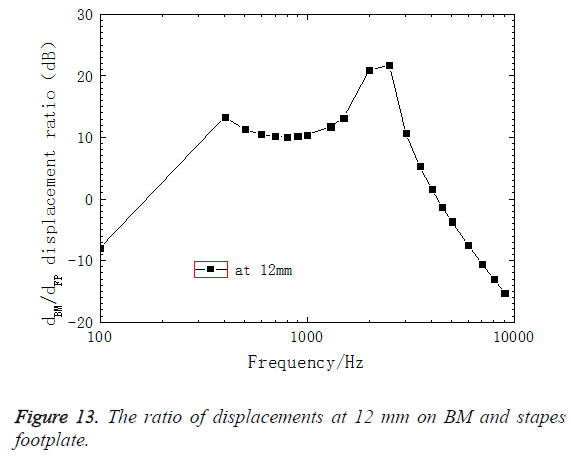
As shown in Figure 13, the FE model-derived BM sound pressure gain at 12 mm was depicted. Figure 13 showed that sound pressure increased linearly as frequencies increased from 100 Hz to 400 Hz and reached a small peak at 400 Hz which increased about 13 dB. After a downward, the sound pressure increased, with a maximum of 21 dB at 2500 Hz. Then, it decreased quickly. It indicated that BM had a great effect on amplification on the sound pressure and maximal value appeared at characteristic frequency of its corresponding position. Moreover, compared with the uncoiled model, the present model showed that there was a difference when the amplitude of each cross-section of BM varied as curvature changed. Figure 8 showed the ratio of the amplitude between the outer and inner radius at different cross-section. It could be seen that the maximal ratio was 1.06 and the minimal ratio was 0.96. Those results indicated that the difference between the outer and inner radius varied in response to different frequencies, which expanded the range of sense. Therefore, it proved that the spiral structure itself amplified the sound pressure.
Conclusion
In this paper, the previous uncoiled model [20,21] is improved by establishing a three-dimensional model of spiral cochlea which is in accordance with the actual human ear. The results from the model in this paper are in good agreement with experimental data, which confirms the validity of the FE model. Some conclusions are drawn as follow:
Under the sound pressure, the variation of the ratio of the amplitude of outer and inner radius along the longitudinal dimension of BM could be used to describe the trend of amplitude of BM. The curves intersected at 22 mm. Before the intersection, the ratio increased as frequencies increased and after the intersection, the situation was opposite. Moreover, the location of the peak amplitude of the BM varied in response to different frequencies. It proved the frequency sensitivity of the BM along its length. In the region of the low frequency, the amplitude of the BM displacement in a transverse direction varied little with curvature changing. But at high frequency, the situation was opposite.
The curve changed suddenly around 2500 Hz. It meant that the curvature had an effect on the amplitude of BM at high frequency, which was not shown in the previous uncoiled model. In addition, at characteristic frequency (2500 Hz), the amplitude of BM decreased as curvature decreased and the trend of decreasing gradually flattened out. Therefore, the use of the three-dimensional spiral cochlear model could describe the actual changes at high frequency better, reflecting the characteristics of BM motion. Meanwhile, the amplification of BM to sound pressure are reflected by the spiral structure of the BM itself and the range of sense in frequency is expanded. And the BM had a great effect on amplification on the sound pressure and maximal value appeared at characteristic frequency of its corresponding position. In conclusion, the study in this paper provided an accurate numerical computing platform for simulation analysis of the human cochlea.
Acknowledgements
We thank the support of the National Natural Science Foundation of China (11072143, 11272200).
References
- Colantonio JR, Vermot V,Wu D, Langenbacher AD, Fraser S,Chen JN,Hill KL.The dynein regulatory complex is required for ciliary motility and otolith biogenesis in the inner ear. Nature 2009;457:205-209.
- Oliver D, He DZ, Klocker N, Ludwig J,Schulte U,Waldegger S. Intracellular anions as the voltage sensor of Prestin, the outer hair cell motor protein. Science2001; 292: 2340-2343.
- Togashi H,Kominami K, Waseda M,Komura H, Miyoshi J,Takeichi M. Nectins establish a checkerboard-like cellular pattern in the auditory epithelium.Science2011; 333: 1144-1147.
- Verpy E, Weil D, Leibovici M, Leibovici M,Goodyear R,Hamard G,Houdon C. Stereocilin-deficient mice reveal the origin of cochlear waveform distortions. Nature 2008; 456:255-259.
- Maoiléidigh DO, Hudspeth AJ. Effects of cochlear loading on the motility of active outer hair cells. PNAS. 2013; 110: 5474-5479.
- Evans EF, Wilson JP, Borerwe TA. Animal models of tinnitus. In: Tinnitus. London: Pitman 1981; 108-138.
- Powers NL, Salvi RJ, Wang J,Spongr V,Qiu CX. Elevation of auditory thresholds by spontaneous cochlear oscillations. Nature1995;375:585-587.
- Antoine MW,Hübner CA,Arezzo JC. A causative link between inner ear defects and long-Term striatal dysfunction. Science. 2013;341:1120-1123.
- Sage C, Huang M, Karimi K,Gutierrez G,Vollrath MA, Zhang DS. Proliferation of functional hair cells in vivo in the absence of the retinoblastoma protein. Science 2005; 307: 1114-1118.
- Ryugo DK, Kretzmer EA, Niparko JK.Restoration of auditory nerve synapses in cats by cochlear implants. Science. 2005;310: 1490-1492.
- Chen W, Jongkamonwiwat M, Abbas L. Restoration of auditory evoked responses by human ES-cell-derived oticprogenitors. Nature 2012;490: 278-282.
- Thorne M, Salt AN, Demott JE, Henson MM,Henson OW,Gewalt SL.Cochlear Fluid Space Dimensions for Six Species Derived From Reconstructions of Three-Dimensional Magnetic Resonance Images.The Laryngoscope. 1999;109: 1661-1668.
- Givelberg E, Bunn J. A comprehensive three dimensional model of the cochlea. Journal of Computational Physics 2003;191: 377-391.
- Cheng L, White RD, Grosh W. Three dimensional viscous finite element formulations for acoustic fluid-structure interaction. Comput Methods Appl Mech Engrg 2008;197: 4160-4172.
- Bohnke F, Arnold W. 3-D-Finite element model of the human cochlea including fluid-structure couplings. J Oto-Rhino-Laryngol Rel Special 1999; 61:305-310.
- Parthasarathi AA, Grosh K, Nuttall AL. Three-dimensional numerical modelling for global cochlear dynamics. J Acoust Soc Am 2000; 107: 474-485.
- Skrodzka EB. A mechanical passive and active models of the human basilar membrane. Applied Acoustics 2005; 66: 1321-1338.
- Skrodzka EB. Modelling of some mechanical malfunctions of the human basilar membrane, Applied Acoustics 2005; 66: 1007-1017.
- Yoon YJ, Steele CR, Puria S. Feed-forward and feed-backward amplification model from cochlear cytoarchitecture: an interspecies comparison. Biophysical Journal2011;100:1-10.
- Gan RZ, Reeves BP, Wang XL. Modeling of sound transmission from ear canal to cochlea.Annals of Biomedical Engineering 2007;35:2180-2195.
- Wang ZL, Wang XL,Hu YJ,Cheng HM.FEM simulation of sound transmission based on integrated model of middle ear and cochlea. Chinese J. of Biomedical Engineering 2011;30:60-65.
- Xiangming Z,Gan RZ. A comprehensive model of human ear for analysis of implantable hearing devices. IEEE Transactions on Biomedical Engineering. 2011;58:3024-3027.
- Koehler KR, Mikosz AM, Molosh AI, Patel D,Hashino E.Generation of inner ear sensory epithelia from pluripotent stem cells in 3D culture. Nature. 2013; 500: 217-221.
- Tanimoto M, Ota Y, Inoue M, Oda Y. Origin of inner ear hair cells: morphological and functional differentiation from ciliary cells into hair cells in zebrafish inner ear. The Journal of Neuroscience 2011; 31: 3784 -3794.
- Bohnke F,Arnold W. 3D-finite element model of the human cochlea including fluid -structure couplings. ORL1999;61:305-310.
- Lim KM, Steele CR. A three-dimensional nonlinear active cochlear model analyzed by the WKB-numeric method.Hear Res2002;170:190-205.
- Andoh M,Wada H. Prediction of the characteristics of two types of pressure waves in the cochlea: Theoretical considerations. J Acoust Soc Am. 2004;116:417-425.
- Watts L. The mode-coupling Liouville-Green approximation for a two-dimensional cochlear model. J Acoust Soc Am. 2000;108:2266-2271.
- Steel CR,Lim KM. Cochlear model with three dimensional fluid,inner sulcus and food-forward mechanism. Audiol Neuro-Otol1999;4:197-203.
- Homer M, Champneys A, Hunt G, Cooper N. Mathematical modeling of the radial profile of basilar membrane vibrations in the inner ear. J AcoustSocAm2004;116:1025-1034.
- Ni G, and Elliott SJ. Effect of basilar membrane radial velocity profile on fluid coupling in the cochlea. The Journal of the Acoustical Society of America. 2013;133:EL181-EL187.
- Hall JJW, Mueller HG. Audiologist's Desk Reference Volume II: Audiolologic Management, Rehabilitation and Terminology. Singular.
- Gundersen T, Skarstein O, Sikkeland T. A study of the vibration of the basilar membrane in human temporal bone preparations by the use of the mossbauer effect. Acta Otolaryn-gol 1978;86: 225-232.
- Stenfelt S, Puria S, Hato N,Goode RL. Basilar membrane and osseous spiral lamina motion in human cadavers with air and bone conduction stimuli. Hearing Research. 2003;181: 131-143.
- Kim N, Homma K, Puria S. Inertial Bone Conduction: Symmetric and Anti-Symmetric Components. Association for Research in Otolaryngology. 2011;12: 261-279.
- Greenwood DD. A cochlear frequency-position functions for several species-29 years later. J Acoust Soc Am 1990; 87:2592-2605.
- von Békésy G. Experiments in Hearing. New York: McGraw-Hill Book Company, Inc.
