Research Article - Biomedical Research (2017) Volume 28, Issue 10
Multi-slice spiral computed tomography perfusion imaging technology differentiates benign and malignant solitary pulmonary nodules
Gang Wang1,#, Xiaoming Zhou1,#, Ruirui Zhao2, Wenjian Xu1, Chuanyu Zhang1, Gang Jiang1, Xiaoyan Tang1 and Hualong Yu1,*
1Department of Radiology, Affiliated Hospital of Qingdao University, Qingdao 266101, PR China
2Department of Operation Room, Affiliated Hospital of Qingdao University, Qingdao 266101, PR China
#These authors contributed equally to this work
- *Corresponding Author:
- Hualong Yu
Department of Radiology
Affiliated Hospital of Qingdao University, PR China
Accepted date: March 04, 2017
Abstract
Aims: The present study is to investigate the value of multi-slice spiral computed tomography (MSCT) in the differentiation of benign and malignant solitary pulmonary nodule (SPN).
Methods: A total of 21 patients with benign SPN and 21 patients with malignant SPN were included in the present study. MSTC perfusion imaging characteristics and parameters were analyzed. For imaging analysis, shapes, locations, borders, density and enhancement of lesions were investigated. After choosing the region of interest on the images, perfusion parameters, time-density curve and hemodynamic parameters such as blood flow, blood volume, mean transit time, and permeability of surface were evaluated.
Results: Patients with malignant SPN had greater blood flow, blood volume, mean transit time, and permeability of surface than those with benign SPN. CT manifestations of malignant SPN were distinct from those of benign SPN. Patients with malignant SPN had even enhancement but those with benign SPN had thin wall ring enhancement or no enhancement. Malignant SPN had distinct perfusion parameters and time-density curve compared with benign SPN. Peak height and mass/aorta peak ratio were efficient in differentiating benign and malignant SPN.
Conclusions: The present study demonstrates that MSCT perfusion imaging technology provides the imaging information of SPN. More importantly, hemodynamics and time-density curves of SPN are effective in the differentiation of benign and malignant SPN. MSCT is helpful in the early treatment of SPN, promoting the survival rate and improving the prognosis of SPN patients.
Keywords
Multi-slice spiral computed tomography, Perfusion imaging, Solitary pulmonary nodule, Hemodynamics.
Introduction
Solitary pulmonary nodule (SPN) is a mass smaller than 3 centimeters in diameter and it is commonly observed in thoracic diseases [1]. SPN is presented as a solitary, nearly round dense shadow that is completely surrounded by the lungs in chest radiological examination, and the shadow has a welldefined or unclear border [2]. However, atelectasis, pulmonary hilar enlargement, pleural effusion or mediastinal lymph node enlargement is not observed in SPN. According to a previous study [3], patients with SPN account for 0.09-0.20% in all subjects who undergo pulmonary imaging examination. Most SPN cases are benign, and malignant SPN cases only account for 5-40%. Of note, most malignant SPN patients have bronchiogenic cancer. The 5-year survival rate of patients with advanced lung cancer is lower than 5%, but that of patients with early stage lung cancer is higher than 90%. Therefore, early and accurate diagnosis of the malignancy of SPN has a great clinical significance for therapeutic regimen and prognosis of lung cancer [4,5].
In recent years, the differentiation of benign and malignant lung SPN has become a hot research topic. As the development of imaging examination technology, multi-slice spiral computed tomography (MSCT) perfusion imaging has been widely used in clinical practice [6]. MSCT has a high resolution and can be used for the accurate evaluation of tumor vascular function. In the present study, we investigate the hemodynamics of pulmonary lesions by MSCT, and try to use relevant imaging manifestations and parameter indexes to differentiate benign tumors from malignant tumors.
Materials and Methods
Patients
A total of 42 patients who received MSCT examinations at our hospital between August 2013 and August 2015 were included in the present study. All patients were confirmed to have pulmonary nodules by MSCT. According to percutaneous lung biopsy and bronchoscopic biopsy, 21 patients were confirmed to have malignant nodules, while the other 21 patients were confirmed to have benign nodules. Among the 21 patients with malignant nodules, 14 were male and 7 were female, with an average age of 61.32 ± 10.51 years and an age range of 26-76 years. Among the 21 patients with benign nodules, 11 were male and 10 were female, with an average age of 57.74 ± 9.67 years and an age range of 31-72 years. Clinical information such as gender, age, clinical symptoms, calcification and enhancement was compared between the two groups (Table 1). All procedures were approved by the Ethics Committee of Qingdao University. Written informed consents were obtained from all patients or their families.
| Benign SPN | Malignant SPN | P value | |
|---|---|---|---|
| Gender | |||
| Male/female | 7/14 | 12/9 | ns |
| Age (years) | |||
| 36-76 | 61.32 ± 10.51 | 57.74 ± 9.67 | >0.05 |
| Symptoms | |||
| Cough | 33.3% | 52.3% | >0.05 |
| Pectoralgia | 23.8% | 28.5% | >0.05 |
| Expectoration | 33.3% | 42.8% | >0.05 |
| Hemoptysis | 4.7% | 38.0% | <0.05* |
| Chest tightness | 14.2% | 23.8% | >0.05 |
| No symptom | 66.6% | 19.0% | >0.05 |
| Calcification | |||
| Yes/No | 7/14 | 2/19 | >0.05 |
| Enhancement | |||
| Yes/No | 11/10 | 18/3 | <0.05* |
Table 1: Clinical information of patients.
MSCT
The patients were in supine position and inspiratory scanning was performed on a 64-slice spiral CT instrument (GE Healthcare, Little Chalfont, UK). The scanning range was from apex to bottom of the lungs, and from chest wall to armpit. The scanning parameters were: tube voltage, 120 kV; tube current, 50 mA; slice thickness, 0.3-1 mm; high resolution algorithm reconstruction. Pulmonary window and mediastinal window were observed (lung window, +700 to -700 Hu; mediastinal window, 50-300 Hu). After plain scanning of enhanced patients, nonionic iodine contrast agent iohexol (350 mg I/ml; dose, 1.0-1.5 ml/kg) was injected at a flow rate of 3-4 ml/s. At 35 s and 65 s after injection of nonionic iodine contrast agent, scanning was performed.
Post-processing of images
CT perfusion 4.0 software of AW4.4 workstation (GE Healthcare, Little Chalfont, UK) was used for post-processing of images. First, perfusion CT value range was set, using large blood vessels (descending aorta, thoracic aorta or aortic arch) in the same level with pulmonary nodules as afferent artery. Region of interest (ROI) was selected on the largest cross section of the pulmonary nodule, and perfusion parameters in perfusion status were calculated, including peak height (PH), time to peak (TP), and mass peak and aorta peak ratio (M/A).
Image analysis
After choosing ROI on the images, perfusion parameters, timedensity curve (TDC) and hemodynamic parameters such as blood flow (BF), blood volume (BV), mean transit time (MTT), and permeability of surface (PS) were obtained. The images were examined independently by two experienced chest imaging diagnostic physicians, and locations, sizes, shapes, smoothness, lobulation, density, enhancement pattern and levels were recorded. CT manifestations were compared with the results from pathological examinations.
Statistical analysis
The results were analyzed using SPSS 17.0 statistical software (IBM, Armonk, NY, USA). Quantitative measurement data were nearly normally distributed and expressed as means ± standard deviations. Differences were compared using t-test. Receiver operating characteristic (ROC) curves were used to analyze the area under curve (AUC), sensitivity and specificity. The patient's clinical symptoms and imaging results were first evaluated. Using SPSS software, PH, M/A and TP values were compared with previous clinical data and ROC was plotted. P<0.05 was considered statistically significant.
Results
Patients with malignant SPN have greater blood flow, blood volume, mean transit time, and permeability of surface than those with benign SPN
To compare the hemodynamic parameters between benign and malignant SPN, perfusion parameters were analyzed using statistical methods. The data showed that BF, BV, MTT, and PS values in malignant SPN group (85.25 ± 6.35, 16.25 ± 5.36, 21.56 ± 10.69, and 28.26 ± 4.26, respectively) were significantly higher than those in benign SPN patients (48.36 ± 1.36, 3.63 ± 0.93, 12.63 ± 1.96, and 15.36 ± 3.63, respectively) (P<0.05) or normal subjects (46.63 ± 3.76, 3.23 ± 0.77, 10.94 ± 1.56, and 14.46 ± 3.23, respectively) (P<0.05) (Table 2). The result suggests that patients with malignant SPN have greater blood flow, blood volume, mean transit time, and permeability of surface than those with benign SPN.
| Blood flow (ml/min/100 g) | Blood volume (ml/100 g) | Mean transit time (s) | Permeability of surface (ml/min/100 g) | |
|---|---|---|---|---|
| Malignant SPN | 85.25 ± 6.35 | 16.25 ± 5.36 | 21.56 ± 10.69 | 28.26 ± 4.26 |
| Benign SPN | 48.36 ± 1.36 | 3.63 ± 0.93 | 12.63 ± 1.96 | 15.36 ± 3.63 |
| Normal subjects | 46.63 ± 3.76 | 3.23 ± 0.77 | 10.94 ± 1.56 | 14.46 ± 3.23 |
| P value | 0.004 | 0.016 | 0.037 | 0.040 |
Table 2: Hemodynamic parameters.
CT manifestations of malignant SPN are distinct from those of benign SPN
To compare CT manifestations between the two groups, MSCT was performed. The data showed that lobulation sign, edge smoothness, burr spike, pleural retraction sign, air crescent sign, welt vessel sign, and tail sign in malignant SPN were significantly higher than those in benign SPN (P<0.05). Of note, the calcified area was not significantly different between the two groups (P>0.05). The results indicate that CT manifestations of malignant SPN are distinct from those of benign SPN.
Patients with malignant SPN usually have even enhancement but those with benign SPN usually have thin wall ring enhancement or no enhancement
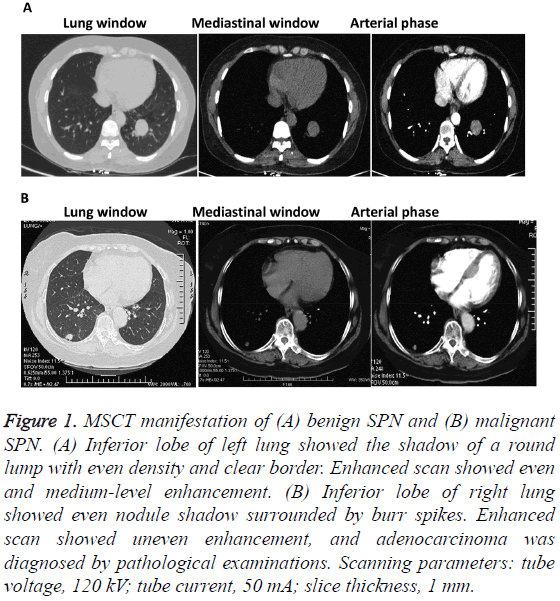
To investigate enhancement degrees between the two groups, MSCT images were analyzed. Among the 21 malignant SPN patients, 11 cases showed even enhancement, 4 cases showed irregular enhancement around the nodules, and 6 cases had uneven enhancement. By contrast, 14 benign SPN patients had ring enhancement and the other 7 cases showed no obvious enhancement (Figure 1). The result suggests that patients with malignant SPN usually have even enhancement but those with benign SPN usually have thin wall ring enhancement or no enhancement.
Figure 1: MSCT manifestation of (A) benign SPN and (B) malignant SPN. (A) Inferior lobe of left lung showed the shadow of a round lump with even density and clear border. Enhanced scan showed even and medium-level enhancement. (B) Inferior lobe of right lung showed even nodule shadow surrounded by burr spikes. Enhanced scan showed uneven enhancement, and adenocarcinoma was diagnosed by pathological examinations. Scanning parameters: tube voltage, 120 kV; tube current, 50 mA; slice thickness, 1 mm.
Malignant SPN has distinct perfusion parameters and TDC compared with benign SPN
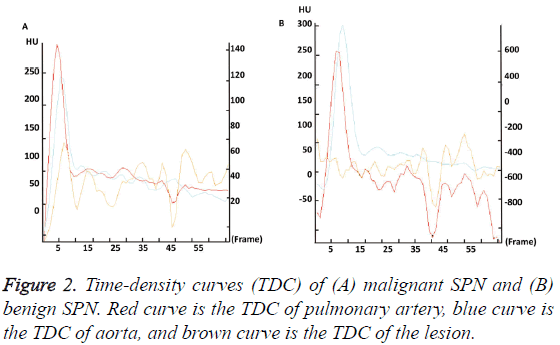
To further investigate the CT characteristic parameters between the two groups, perfusion parameters and TDC were analyzed. The data showed that TP, M/A, and PH in malignant SPN group were significantly higher than those in benign SPN group (P<0.05). The TDC of malignant SPN group showed a plateau after reaching the peak value, but the TDC of benign SPN group had little change and showed no obvious upward branch (Figure 2). These results indicate that malignant SPN has distinct perfusion parameters and TDC compared with benign SPN.
Peak height and mass/aorta peak ratio can be used to differentiate benign and malignant SPN
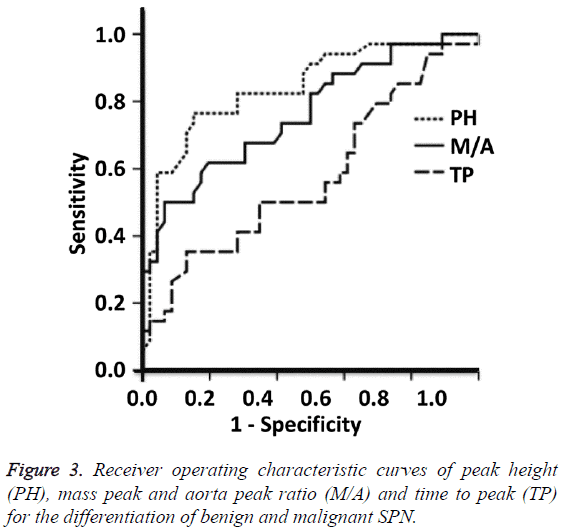
To test the diagnostic value of perfusion parameters, ROC curves were plotted. The AUCs of the ROC curves of PH, M/A and TP were 0.841, 0.763 and 0.609, respectively. PH and M/A showed statistically significant differences between benign and malignant SPN groups (P=0.005), but TP showed no significant difference between the two groups (P=0.087). The Youden indexes for PH and M/A were 32.25 and 0.11, respectively. When using PH>32.25 and M/A>0.11 for the diagnosis of malignant SPN, the sensitivity were 87.5% and 81.3%, and the specificity were 85.3% and 79.3%, respectively (Figure 3). These results suggest that peak height and mass/ aorta peak ratio can be used to differentiate benign and malignant SPN.
Discussion
The diagnosis and differential diagnosis of SPN have always been difficult in imaging diagnosis. Because of the clinical symptoms and imaging manifestations of SPN are not specific, the diagnosis of SPN is difficult and misdiagnosis usually occurs. Perfusion imaging technology helps with the etiologic diagnosis of SPN on the basis of morphological changes, CT enhancement changes, multiplanar reformation, and threedimensional reconstruction. Early diagnosis of SPN improves the survival rate and the prognosis of patients [7]. Perfusion parameters that are used in the qualitative diagnosis of benign and malignant SPN are mainly BF, BV, PS, and MTT [8-12]. In the present study, SPN mostly occurs in the right lung, and its incidence in upper lobe is higher than that in middle or low lobe. Generally, larger nodules correspond to higher degrees of malignancy, and more than 60% of nodules larger than 2 cm in diameter are malignant [13]. Similarly, smaller nodules usually have less chance of malignancy [14]. Smooth shapes and clear borders usually indicate benign lesions. About 20% malignant nodules have smooth borders. In general, deep lobulation and short and dense burr usually indicate malignant nodules. The result of the present study also confirms that benign and malignant nodules have different morphology.
Scanning of SPN includes conventional enhanced scanning and perfusion enhanced scanning. Changes in the density of SPN at different time points are used to evaluate the property of SPN [15]. Because benign and malignant nodules have different degrees of blood supply, the degree of contrast agent diffusion into the interstitial tissue is not the same. The results of the present study show that benign and malignant nodules are distinct in BF, BV, MTT, PS, TP, M/A and PH values. In the meantime, the AUC of TP, M/A and PH curves shows that PH and M/A have higher diagnostic values than TP. This result is correlated with tissue type and blood supply of the lesions. The highest and lowest pathological types of malignant SPN are adenocarcinoma and small cell lung cancer, respectively, which have abundant microvessels. Damages of microvessels in malignant SPN cause vessel expansion, tortuosity and uneven distribution, leading to relatively high PH and M/A values and parabolic TDC shape in CT perfusion imaging. By contrast, benign SPN has intact vessels, and shows no blood supply or a little blood supply in CT perfusion imaging. Therefore, benign SPN has smaller CT enhancement value, lower PH and M/A values and stable, flat TDC [7] in contrast to malignant SPN. In conclusion, perfusion parameters and TDC in MSCT perfusion imaging have clinical value in differentiating benign SPN from malignant SPN. MSCT has important significance in the early treatment and prognosis of malignant SPN.
Acknowledgement
This work was supported by the Department of Radiology, Affiliated Hospital of Qingdao University.
References
- [No authors listed] Symposium on the differential diagnosis of solitary pulmonary lesions with 3 or less centimeters in diameter (author's transl). Zhonghua Wai Ke Za Zhi 1980; 18: 581-585.
- Zhou Y, Li Y, Fan L, Liu S. A solitary pulmonary ground-glass nodule in adult systemic langerhans' cell histiocytosis. Int J Clin Exp Pathol 2015; 8: 13561-13564.
- Zhu B, Zhou KF, Qin GC, Jian HE, Dan-Yan LI. The application of multi-slice helical CT perfusion imaging in differential diagnosis of pulmonary nodules. J Med Imaging 2012.
- Sun P, Xiao X. Advances in imaging of solitary pulmonary nodules. Foreign Med Sci Clin Radiol Fascicle 2006; 29: 317-320.
- Li W, Ren H, Zhang C, Niu Z, Su L, Zhu J. Diagnosis and surgical treatment of solitary pulmonary nodules in 112 cases. Chongqing Med 2011; 89: 119-129.
- Zhang X, Zhou H, Wang G. 64-slice spiral CT perfusion technique and its application value for solitary pulmonary nodules. J Practical Radiol 2008; 24: 749-752.
- Xia CH, Ya-Li JI, Gao B. CT perfusion imaging in differential diagnosis of solitary pulmonary nodules. Radiologic Practice 2011; 37: 966-968.
- Zhou H, Liu JK, Chen SX, Xiong Z, Lin GQ, Zhou ML, Chen W, Lu H. Correlation of blood flow assessed by CT perfusion imaging and microvascular ultrastructure in non-small cell lung cancer: a preliminary study. Zhonghua Zhong Liu Za Zhi 2013; 35: 193-197.
- Larici AR, Calandriello L, Amato M, Silvestri R, del Ciello A, Molinari F, de Waure C, Vita ML, Carnassale G, Bonomo L. First-pass perfusion of non-small-cell lung cancer (NSCLC) with 64-detector-row CT: a study of technique repeatability and intra- and interobserver variability. Radiol Med 2014; 119: 4-12.
- Ng CS, Chandler AG, Wei W, Anderson EF, Herron DH, Charnsangavej C, Kurzrock R. Reproducibility of perfusion parameters obtained from perfusion CT in lung tumors. AJR Am J Roentgenol 2011; 197: 113-121.
- Ovali GY, Sakar A, Göktan C, Celik P, Yorgancio?lu A, Nese N, Pabuscu Y. Thorax perfusion CT in non-small cell lung cancer. Comput Med Imaging Graph 2007; 31: 686-691.
- Shu SJ, Huang H, Liu BL, Wang F, Zhao YM. First pass phase of perfusion imaging with 64-slice VCT in diagnosis of pulmonary nodules. J Med Imaging 2011.
- Takashima S, Sone S, Li F, Maruyama Y, Hasegawa M, Matsushita T, Takayama F, Kadoya M. Small solitary pulmonary nodules (<or =1 cm) detected at population-based CT screening for lung cancer: Reliable high-resolution CT features of benign lesions. AJR Am J Roentgenol 2003; 180: 955-964.
- Qiang JW, Zhou KR, Lu G, Wang Q, Ye XG, Xu ST, Tan LJ. The relationship between solitary pulmonary nodules and bronchi: multi-slice CT-pathological correlation. Clin Radiol 2004; 59: 1121-1127.
- Wang H, Li S, Lu G. Clinical research progress of multi-slice spiral CT in the evaluation of solitary pulmonary nodules. Radiol Practice 2010; 25: 105-108.


