Research Article - Biomedical Research (2017) Volume 28, Issue 4
Monte Carlo study of a flattening filter-free 6 MV photon beam using the BEAMnrc code
Ankit Kajaria1*, Neeraj Sharma1, Shiru Sharma1, Satyajit Pradhan2, Abhijit Mandal2 and Lalit Aggarwal M21School of Biomedical Engineering, Indian Institute of Technology (BHU) Varanasi, UP, India
2Department of Radiotherapy and Radiation Medicine, Institute of Medical Science (BHU), Varanasi, UP, India
- *Corresponding Author:
- Ankit Kajaria
School of Biomedical Engineering
Indian Institute of Technology
Varanasi, India
Accepted on August 18, 2016
Abstract
Flattening Filter Free (FFF) photon beams have different dosimetric properties from those of flattened beams. The aim of this study is to evaluate the basic dosimetric properties of a flattening filter free 6 MV photon beam. A Monte Carlo simulation model was developed for a 6 MV photon beam based on Varian Clinic 600 unique performance linac operated with/without a flattening filter and dosimetric features including central axis absorbed dose, beam profiles and photon and electron spectra were calculated for flattened and unflattened cases separately. Absolute depth dose calculations showed an increase in dose rate with a factor of more than 2.4 for the unflattened 6 MV photon beam which is dependent on the depth. Percentage Depth Doses (PDDs) values were found to be lower for unflattened beam for all field sizes. The total Scatter Correction Factor (SCP) were found to have less variation with field sizes for unflattened beam indicating that removing of the filter from the beam line can reduce significant amount of head scatter. However surface doses were found to be higher for the unflattened beam due to more contamination electrons and low energy photons in the beam. Our study showed that increase in the dose rate and lower out-of-field dose could be considered as practical advantages for unflattened 6 MV photon beams.
Keywords
Unflattened photon beam, Flattening filter, Monte Carlo.
Introduction
Conventional clinical accelerators are equipped with a Flattening Filter (FF) which is primarily designed to produce a flat beam profile at a given depth by compensating for the nonuniformity of photon fluence across the field. But flattening filter decreases the X-ray output considerably and produces quality changes within the primary beam by scattering and absorption of primary photons. The requirement to have a flattened beam profile for treatment delivery is no longer necessary when certain type of treatments such as intensitymodulated radiation therapy or intensity-modulated arc therapy is used. In Intensity Modulated Radiation Therapy (IMRT), the patient dose distribution can instead be shaped by the Multileaf Collimator (MLC) to create the desired clinical effect. In principle, the flattening filter can then be removed, and the leaf sequences can be adjusted accordingly to produce fluence distributions similar to those of a beam with a flattening filter. Removal of flattening filter with its associated attenuation from x-ray beam path increases dose rate [1]. The other possible effect is substantial reduction in head scatter, as the flattening filter is the major source of scattered photons. Flattening Filter Free (FFF) beams in radiotherapy thus have the advantage of shorter treatment delivery time and lower out-of field dose compared with conventional flattened beams. This is especially important where large doses per fraction are prescribed, e.g., stereotactic ablative body radiotherapy [2,3] or where patient motion might affect the efficacy of the delivery or both [4]. Monte Carlo (MC) method has become a powerful tool in radiotherapy dose calculations and many studies have been conducted using this method for analysing linac head components and influencing factors on beam characteristics [5-7] .Thus, the effect of flattening filter on photon energy spectra, absolute absorbed dose per initial electron and beam profiles could be studied by this method [8]. In an Monte Carlo (MC) study on Flattening filter free beams, dose rates increase by a factor of 2.31 (6 MV) and 5.45 (18 MV) and out-of-field dose reductions were reported [9]. In a similar study, a significant improvement in out-of-field dose was reported for small field sizes [10]. Above studies outline the potential benefits of removing the flattening filter. It is therefore important to investigate these properties for a typical modern accelerator such as the Varian Clinic 600 unique performance. This study reports on depth-dose dependencies, dose rates, lateral profiles, out-of-field doses, total scatter factors, and photon and electron fluence in a conventional accelerator and a flattening filter-free system.
Material and Methods
The 6 MV Varian linac simulation model
Calculating spectra with more accuracy requires knowledge of the characteristics of the electron beam incident on the target as well as better tools for modelling the linac. We used the BEAMnrc code system [11,12] to derive best estimates for the mean energy and Full Width at Half Maximum (FWHM) of the electron beam incident on the target. Monte Carlo simulations for monoenergetic beams ranging from 5.5 to 6.2 MeV with Full Width at Half Maximum (FWHM) varied from 0.15 to 0.25 cm were performed to find the best match with Percentage Depth Dose (PDD) and profiles measurements. A monoenergetic source with kinetic energy of the beam 5.7 MeV and Full Width at Half Maximum (FWHM) for the X and Y directions of 0.2 cm was found to give best agreement with measured data. Geometry and materials used to build the Monte Carlo model of the linear accelerator were based on machine specifications as provided by the manufacturer Varian Medical Systems. The linac was structured in the following order: a target slab of tungsten and copper, primary collimator (tungsten), flattening filter, ion chamber, mirror, jaws (tungsten). All materials used in the Monte Carlo simulation were extracted from the 700 ICRU PEGS4 (International Commission for Radiation Units Pre-processor for Electron Gamma Shower) cross section data available in BEAMnrc, and met the specifications for the linac as provided by the manufacturer.
The structure of the calculation using Monte Carlo techniques
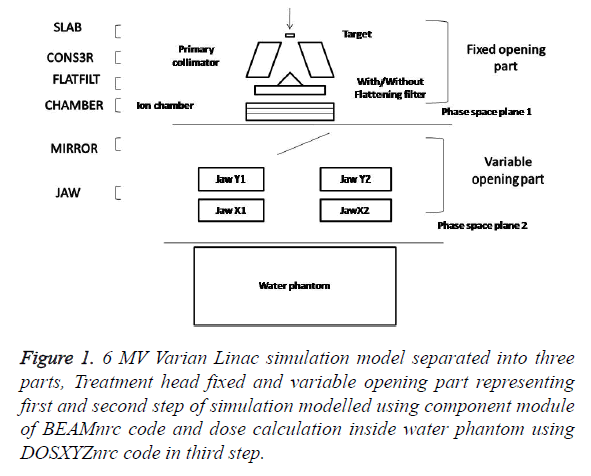
In this section we describe the different stages of simulation for 6 MV photon beam produced by Varian Linac using principal features of the BEAMnrc-DOSXYZnrc code [13,14] which are shown in Figure 1. In the simulation of the full accelerator unit we have split the calculation into three steps in order to save time. In the first step, which takes the most computing time, 1.5 × 10⁸ initial histories are initiated and a monoenergetic electron beam source of kinetic energy of 5.7 MeV with Full Width at Half Maximum (FWHM) for the X and Y directions of 0.2 cm was incident on the target. The primary collimator, flattening filter and ion chamber are included in this step. The output of this step is a phase space file at plain one as show in Figure 1, having information of energy, position, direction, charge and history variable for every particle exiting downstream from the end of ion chamber. Since the source and primary collimator have fixed openings, it is possible to use this phase space data for the simulation of different field sizes. Figure 1 list the component module of BEAMnrc code used for modelling of fixed opening part of treatment head in first step. This large set of particles produced in first step is used repeatedly as the input to the next step of simulation. The second step of the calculation simulates the passage of the particles through the mirror, adjustable collimator and the air slab to a plane at Source to Surface Distance (SSD) 100 cm from target. We simulate different openings of the adjustable collimator to get field sizes from 5 × 5 to 20 × 20 cm2 at a Source to Surface Distance (SSD) equal to 100 cm. Figure 1 also list the component module of BEAMnrc code used for modelling of variable opening part of treatment head in second step of simulation. The output of this step is a phase space file at plain two as show in Figure 1, having information of energy, position, direction, charge and history variable for every particle reaching the plain at Source to Surface Distance (SSD) 100 cm from target. The data analysis program BEAMDP [15] is used to analyse the phase space data files to extract the various types of spectra of all particles reaching the plane at Source to Surface Distance (SSD) 100 cm. In the third step of the simulation, the phase space files for field sizes of 5 × 5 to 20 × 20 cm2 at an Source to Surface Distance (SSD) of 100 cm which are obtain at end of second step are reused by the DOSXYZnrc code as an input for dose calculations in a water phantom as shown in Figure 1. We transport the particles through a water phantom of dimension 30 × 30 × 30 cm3 with voxels size of 0.25 × 0.25 × 0.25 cm3. In the simulation of “unfiltered” 6 MV photon beam all the three step of simulation are same expect in first step where the flattening filter is being removed from the beam line. A comprehensive set of dosimetric data for 6 MV filtered photon beams where acquired using a three-dimensional (3D) phantom, Blue phantom 2 IBA Dosimetry GmbH and OmniPro-Accept 7 data acquisition software. All the measurements were performed with a Scanditronix/Wellhofer compact ionization chamber CC13, in the water phantom.
Results
Monte Carlo simulation model validation
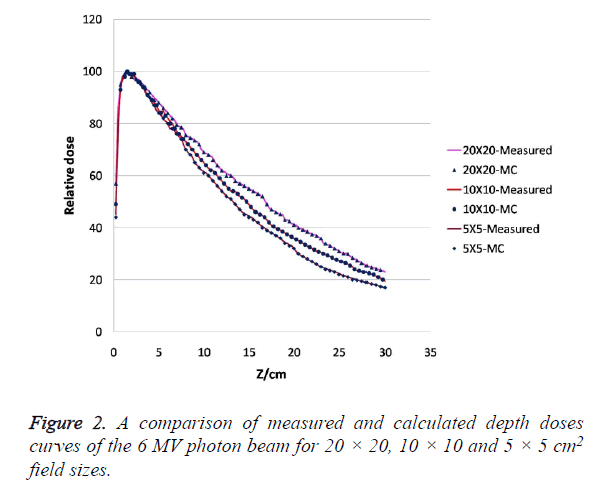
Depth-dose curves for filtered 6 MV photon beam for field size 5 × 5 to 20 × 20 cm2 were calculated in an on axis cylinder of radius 1 cm using Monte Carlo simulation and compare with measured data for the validation of simulation model. The calculated central axis depth-dose curves were normalized to unity at the depth, dmax, of the maximum dose deposition, Dmax. Both results measured and calculated, could then be compared with respect to the relative value of the maximum dose Dmax and the corresponding depth dmax. Figure 2 show the comparison between the calculated depth-dose distributions and measurements for three different field sizes studied in this work. The comparison shows that the calculated and measured data agree within 1% of local relative dose, and 1 mm in depth at all depths and field size which are summarized in Table 1.
| A/cm2 | dmax (simulated) | dmax (measured) | Δ Dmax |
|---|---|---|---|
| 5 × 5 | 1.50 | 1.56 | 0.20 |
| 10 × 10 | 1.50 | 1.52 | 0.17 |
| 15 × 15 | 1.48 | 1.50 | 0.13 |
| 20 × 20 | 1.38 | 1.40 | 0.10 |
Table 1. Comparison of calculated and measured central-axis depthdose profiles at various field sizes. A denotes the field size, dmax (cm) denotes the location of the maximum dose, and Δ Dmax is the relative dose difference between the measurement and the calculations at dmax.
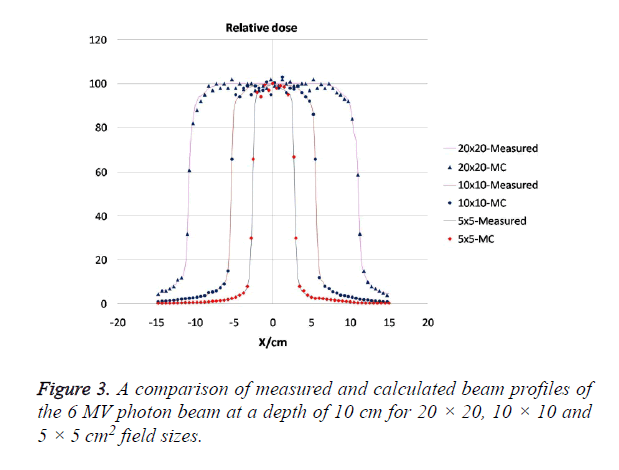
Lateral beam profiles for the filtered 6 MV photon beam were also simulated for 5 × 5 to 20 × 20 field sizes at 1.5, 5 and 10 cm depths. The measured and calculated lateral dose profiles were normalized to unity on the central axis for comparison. Figure 3 shows the comparison of Monte Carlo calculations to measured data for a field size of 20 × 20, 10 × 10 and 5 × 5 cm2 at depth of 10 cm. The lateral field size at the 50% dose level (X50) and penumbra widths, P90-10 and P80-20 (calculated from the 90% level to the 10% level and from 80% to 20%) where calculated using Monte Carlo simulation and the results of the comparisons are summarizes in Table 2. The differences between the measurement and the simulations results in lateral field size at the 50% dose level, X50, was found to be less than 1 mm.
| A/cm2 | Δ X50 | Δ P80-20 | Δ P90-10 |
|---|---|---|---|
| 5 × 5 | 0.10 | 1.50 | 0.8 |
| 10 × 10 | 0.50 | 1.52 | 1.0 |
| 15 × 15 | 0.40 | 1.20 | 2.0 |
| 20 × 20 | 0.50 | 1.00 | 2.2 |
Table 2. Comparison of measured and calculated lateral dose profiles at 10 cm depth. ‘A’ Denotes the field size, Δ X50 (mm) is the lateral difference measured at the 50% dose point in the penumbra, and Δ P90-10 (mm) as well as ΔP80-20 (mm) describes the difference in width of the penumbra measured from the 90% point to 10% dose point and from 80% to 20% dose point respectively.
Simulations without the flattening filter and comparison with flattened beam characteristics
Absolute dose: Absolute absorbed dose per initial electron were calculated for flattened and unflattened beam. For comparison purposes, we considered the depth of 1.5 and 10 cm as a reference depth for dose rate comparison. The ratios of absolute depth doses for flattening filter free to standard flattened beams were calculated and are presented in Table 3. It was observe that absorbed dose per initial electron increased significantly by removing flattening filter, indicating an increased in dose rate for unflattened beam per initial electron. However, the increase in dose rate is decreased with increase in depth.
| A/cm2 | (DFFF/DFF) at d=1.5 | (DFFF/DFF) at d=10 |
|---|---|---|
| 5 × 5 | 2.472 | 2.420 |
| 10 × 10 | 2.474 | 2.400 |
| 15 × 15 | 2.447 | 2.440 |
| 20 × 20 | 2.444 | 2.380 |
Table 3. Ratios of absolute depth doses for flattening filter free to standard flattened beams at two reference depths for different field sizes. ‘A’ denotes the field size; ‘d’ denotes the depth inside water phantom. Absorbed dose calculated without the flattening filter in the beam line is denoted as DFFF (Flattening Filter Free) and with filter in beam line is denoted as DFF.
Percentage depth-dose characteristics
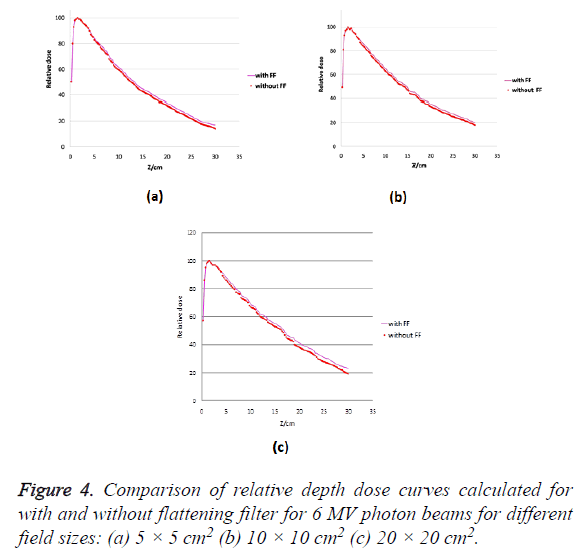
Percentage Depth Dose characteristics (PDD) curves were generated using absolute depth dose values. It can be seen from Figure 4 that percentage depth doses calculated for unflattened beam is slightly lower than standard beam for all field sizes. Difference in the Percentage Depth Doses (PDDs) of flattened and unflattened beams are evident at deeper depths and are increased with depth for 5 × 5, 10 × 10, 15 × 15 and 20 × 20 cm2 field sizes. To verify this difference two parameters are reported in Table 4, namely, the relative dose at a depth of 10 and 20 cm (D10, D20).
| A/cm2 | D10 | D20 | ||
|---|---|---|---|---|
| With FF | Without FF | With FF | Without FF | |
| 5 × 5 | 61.87 | 59.77 | 33.14 | 30.88 |
| 10 × 10 | 66.67 | 63.4 | 37.32 | 34.5 |
| 15 × 15 | 68.32 | 66.49 | 39.2 | 36.69 |
| 20 × 20 | 69.5 | 64.54 | 41.6 | 37.98 |
| FF: Flattening Filter | ||||
Table 4. Comparison of relative depth doses for flattening filter free to standard flattened beams at two reference depths for different field sizes. ‘A’ denotes the field size; D10 and D20 denotes relative depth dose at 10 and 20 cm depth.
Analysis of spectra
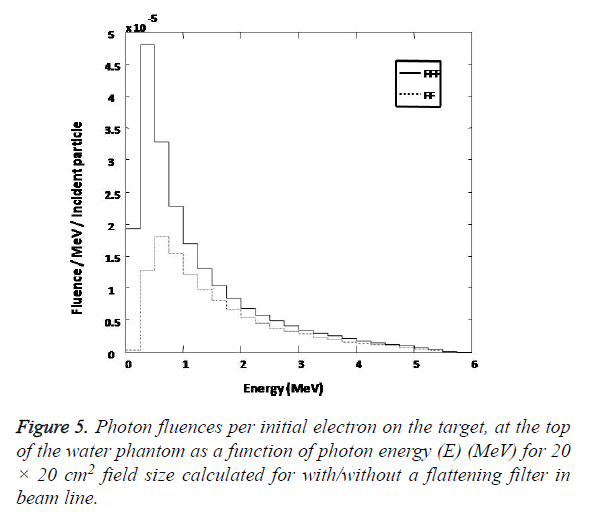
Photon spectra: Figure 5 shows photon spectra as a function of energy (number of photons per MeV per incident electron on the target) calculated for central axis. Photon emerging from target passes through the components of the collimating system on their way to the scoring plain at an Source to Surface Distance (SSD) 100 cm. Scoring plain is an annular region around the central axis with radius 0 < r < 2.25 cm. The range of possible energy of photon is divided into interval (bin) of 0.25 MeV. The number of photon within each energy bin crossing the scoring plain is being recorded for with/without flattening filter case separately. The precision of calculated central-axis photon spectra for all the field size used in the dose calculations is high and uncertainty in each 0.25 MeV wide bin is usually between 1 to 5%, except for the high energy end of the spectra. There is a noticeable increase observe in the photon fluence when the flattening filter is removed from the beam line.
Average energy distribution
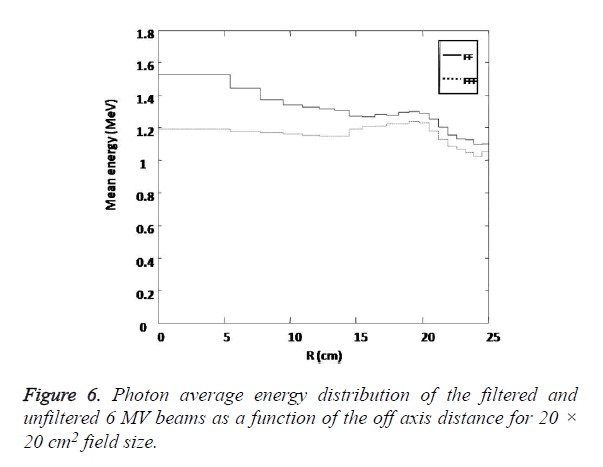
Figure 6 shows the calculated photon average energies distribution at 100 cm Source to Surface Distance (SSD) for 20 × 20 cm2 field size as a function of off axis distance for with/ without flattening filter case. From above distribution we find that the mean photon energy for flattened beam to have a value at central axis 1.52 MeV and decrease to 1.3 MeV at off axis distance of 20 cm which verifies the beam hardening effect produced by the flattening filter [8] for the filtered beam. For the unflattened beam, the mean energy of spectra was not changed significantly with increasing off axis distance and it was respectively decreased from 1.23 MeV on central axis to 1.19 MeV at 20 cm off axis distance for 20 × 20 cm2 field size.
Contaminant electron fluence spectra
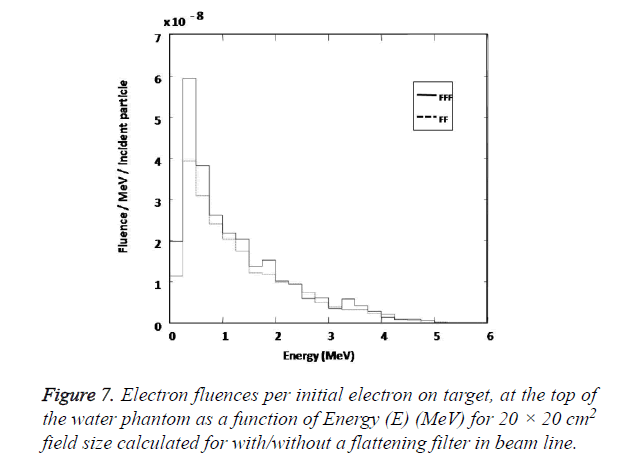
The electron fluence increase indicate a potential risk of delivering an elevated skin dose to the patient and also the risk of placing ion chamber used for the measurement outside the range of its reliable operation. Figure 7 shows the calculated fluence spectra for contaminant electrons calculated for central axis with radius 0<r<2.25 cm and energy bin of 0.25 MeV at 100 cm Source to Surface Distance (SSD) for with/without flattening filter case separately.
In our study it is found that the number of electron reaching the phantom surface increases with removing the flattening filter from the beam line. The averaged value of electron fluence spectra calculated for without flattening filter case is found to be 1.25 times greater than its value for with flattening filter case for field size 20 × 20 cm2.
Surface dose
Surface dose has been calculated for different field sizes for both with/without flattening filter case and is listed in Table 5.
| Field size (cm2) | (Dmax/Dmin) with flattening filter | (Dmax/Dmin) without flattening filter |
|---|---|---|
| 5 × 5 | 47.80 | 53.72 |
| 10 × 10 | 49.40 | 56.20 |
| 15 × 15 | 53.20 | 59.80 |
| 20 × 20 | 55.19 | 63.10 |
Table 5. Percentage Depth Doses (PDDs) for first scoring voxels as an indication of the surface dose for different field sizes.
The Percentage Depth Doses (PDDs) of first scoring voxels with 0.25 cm thickness from the top of water phantom surface is taken as a measure of surface dose. There are differences in doses of build-up region between with flattening filter and without flattening filter cases. Surface dose is affected significantly by contamination electrons reaching the phantom surface and due to higher fluence of contamination electron for unflattened beam it is evident that for without flattening filter case, the surface dose is higher than that of with flattening filter case in all field sizes.
Scatter function
The total scatter factor, Scatter Correction Factor (SCP) is defined as ‘the dose rate at a reference depth for a given field size divided by the dose rate at the same point and depth for the reference field size (10 × 10 cm2). It was measured at Source to Surface Distance (SSD) =100 cm and a depth equal to dmax of a 10 × 10 cm2 field for different field sizes. The data for with/without flattening filter case are presented in Table 6. The Scatter Correction Factor (SCP) of the unflattened beams is found to have less value for lager field sizes than that of the flattened beams which indicate a reduced head scatter in unflattened beams compared to the standard flattened beam.
| Field size (cm2) | SCP with flattening filter | SCP without flattening filter |
|---|---|---|
| 5 × 5 | 0.96 | 0.97 |
| 10 × 10 | 1 | 1 |
| 15 × 15 | 1.031 | 1.012 |
| 20 × 20 | 1.048 | 1.027 |
| SCP: Scatter Correction Factor | ||
Table 6. Total Scatter Correction Factor (SCP) of 6 MV photon beams measured for with/without a flattening filter cases. The Scatter Correction Factor (SCP) was measured at Source to Surface Distance (SSD) =100 cm, and at the depth of maximum dose dmax of a 10 × 10 cm2 field size.
Profile comparison
Beam profiles for different field sizes were calculated at 1.5, 5 and 10 cm depth for both cases with/without flattening filter in a water phantom. As a measure of beam flatness the ratio of maximum to minimum dose within 80% of field width was calculated and is reported in Table 7 for profiles measured at a depth of 10 cm. It is seen that the differences between ratios for the two cases are increasing with increasing field size. It is clear that there is nearly no difference between two cases for small field sizes. This is in the consistence with the results reported by Jeraj et al. [4] that the profiles of unflattened beam for field sizes up to 3 × 3 cm2 are similar to the flattened beam profiles. Thus, removing flattening filter may have some application for radiotherapy techniques, which uses small field size. For larger fields, in flattened beams, the ratio is 1.10 or less, whereas in unflattened beams it increases with increasing field size reaching 1.3 for a 20 × 20 cm2 field.
| Field size (cm2) | (Dmax/Dmin) with flattening filter | (Dmax/Dmin) without flattening filter |
|---|---|---|
| 5 × 5 | 1.07 | 1.04 |
| 10 × 10 | 1.06 | 1.16 |
| 15 × 15 | 1.05 | 1.2 |
| 20 × 20 | 1.1 | 1.3 |
Table 7. The ratio of maximum to minimum dose in lateral profiles within 80% of field size for 6 MV photon beams with/without a flattening filter. The profiles were measured at a depth of 10 cm, at Source to Surface Distance (SSD) =100 cm.
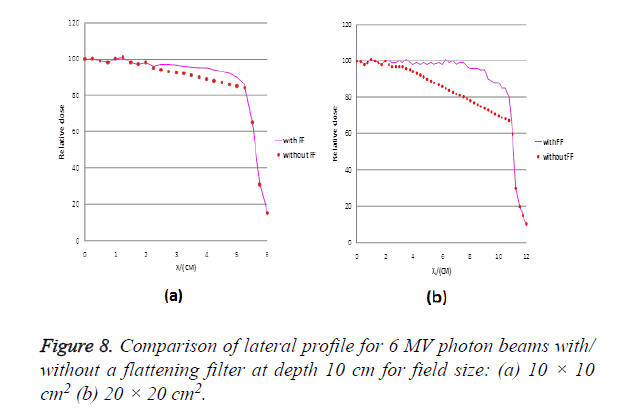
For the comparison of lateral profiles of unflattened and flattened beams, the lateral profiles for 10 × 10 and 20 × 20 cm2 field sizes are compared at a depth of 10 cm as shown in Figure 8. For this comparison, the flat profile is normalized to 1 on the central axis, and the non-fat profile is normalized by dose (Dn) which is calculated using this formula:
Dn= ((Du)/Df)*DCAX
Where Du is the dose at the inflection point of penumbra region of the unflattened beam, Df is the dose at the inflection point of the flattened profile and DCAX is the dose on the central axis of the flattened beam [16]. It is observe in our study that the beam profiles for unflattened case to have relative dose value lower than the flattened beam near the measured field size edge. The amount of reduction for 10 × 10 cm2 field size measured at 4 cm off axis distance is 10% and for 20 × 20 cm2 measured at 9 cm off axis distance is found to be 20%, respectively.
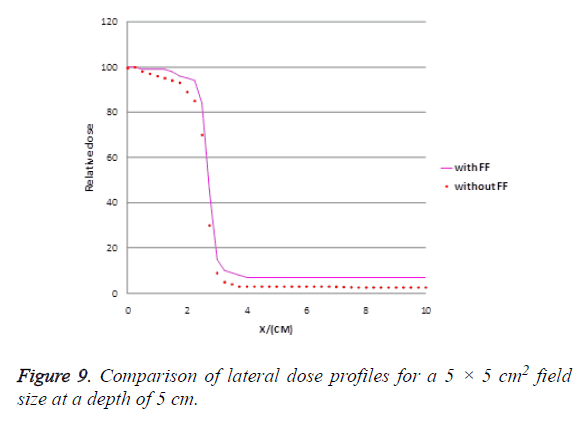
The dose in out-of-field region for small field size was investigated in our study for unflattened beam and compared with that of the flattened beam. Figure 9 shows the calculated flattened and unflattened beam profiles for a small field size (5 × 5 cm2) at a depth of 5 cm. The dose at 4 cm off-axis distance is lower in unflattened beams by 15% and it tends to decrease faster with increasing off axis distance than in flattened beams.
Our results are in consistence with the results reported by Titt et.al [10]. Faster lateral dose fall-off outside the treatment field will result in lower doses to surround normal tissues.
Discussion
A large portion of primary photons especially those close to the central axis of the beam are removed by the flattening filter thus removing the filter from the beam line should result in substantial increase in the dose rate and therefore a decrease in beam-on time should be achieved when radiation treatment is delivered. In order to verify this effect absolute absorbed dose per initial electron were calculated for flattened and unflattened beam at two different depths for different field sizes. The ratios of absolute depth doses for flattening filter free to standard flattened beams calculated for field size 10 × 10 cm2, at 10 cm depth for an Source to Surface Distance (SSD) equal to 100 cm was found to be 2.4 indicating the possible higher dose rate deliver by the unflattened beam. Percentage Depth Doses (PDDs) calculated for unflattened beam is found to be slightly lower than standard beam for all field sizes. Difference in the Percentage Depth Doses (PDDs) of flattened and unflattened beams are evident at deeper depths and are increased with increase in depth for all the field sizes. The photon spectra as a function of energy and average energy distribution as a function of off axis distance for flattened and unflattened beams are being calculated in our study. It was observed that the fluence of photon on central axis averaged over the total surface of the top of water phantom increased 1.84 times with removing flattening filter but the energy spectrum became softer and the average energy of photon energy spectrum on central axis was decreased from 1.52 to 1.23 MeV by removing flattening filter at the top of water phantom for 20 × 20 cm2 field size at 100 cm Source to Surface Distance (SSD). It is due to the differential attenuation of flattening filter with distance from central axis of beam. The thick central part of the flattening filter attenuates more low energy photons, but as the off axis distance increases more low energy photons are allowed to penetrate the thin lateral part of the flattening filter and they contribute to the photon energy spectrum, thus the mean energy of spectra is decreased. For the flattening filter free beam, the mean energy of spectra was not changed significantly with increasing off axis distance and it was respectively decreased from 1.23 MeV on central axis to 1.19 MeV at 20 cm off axis distance for 20 × 20 cm2 field size. Surface dose for the unflattened beam is found to be higher than that of the flattened beam for all the field sizes. The average energy difference on the central axis is considered to be the major reason for the superficial dose difference between the two kinds of beams. Lower average energy of the unflattened beam on central axis produce higher superficial dose. It can be seen that the surface dose for flattened beam varies more with the field size in compare to the unflattened beam. The major reason for the field size dependence of the superficial dose of flattened beam is the scatter component which originates mostly from the flattening filter. The total Scatter Correction Factor (SCP), for the unflattened and flattened beam has been investigated in our study. It can be seen from the data that the flattening filter free beam Scatter Correction Factor (SCP) increases more slowly with increasing field size than that of the flattened beam. This is due to the forward-peaked profile of unflattened beam, which produces less Scatter Correction Factor (SCP) because of the reduced off-axis intensity. The flattening filter free beam has greatly reduced fluence off axis, hence, less secondary head scatter is created, which is directed in toward the central axis. Due to this reason as the measured field size increases, the expected increase in Scatter Correction Factor (SCP) for flattening filter free beams is not seen which is found with the flattened ones. It is observed in our study that flattened and unflattened beams are similar within a few centimetres from the central axis. Thus Beam non flatness is unlikely to present a problem for treatments with small fields and the treatments can also benefit from an increased dose rate however for lager field sizes there is a significant difference in beam flatness for the two cases .The beam profiles for unflattened case are found to have lower relative dose value than the flattened beam near the field edge. The main reason for this behaviour is that the flattening filter elevates relative fluence of primary photons propagating off-axis and reduced head scatter present in unflattened beams. The out-of-field dose calculated without the flattening filter is found to be smaller outside the field edge for small field sizes when compared to the out-of-field dose calculated with flattening filter. It can be seen that the out-of-field dose from the flattening filter free beam is substantially lower, and it falls off faster with distance. This means that a significant reduction in the out-of-field dose and enhanced sparing of normal tissues and organs close to small treatment fields can be achieved.
Conclusion
A Monte Carlo simulation model was developed for a 6 MV photon beam based on Varian Clinic 600 unique performance linac operated with and without a flattening filter. The basic dosimetric features of both flattened and unflattened beams were calculated and compared. Our study shows that removing flattening filter increases the photon fluence and consequently the dose rate considerably. Absolute depth dose calculations showed an increase in dose rate with a factor of more than 2.4 for the unflattened 6 MV beam which is dependent on the depth. These ratios give an estimate of the amount of primary radiation removed from beam due to the interaction with flattening filter. Percentage Depth Doses (PDDs) values were found to be lower for unflattened beam for all field sizes. Surface doses were higher for the unflattened beam due to more contamination electrons and low energy photons in the beam. The total Scatter Correction Factor (SCP), less variation with field sizes indicate that removing the filter from the beam line can reduce significantly the amount of head scatter photons and therefore doses to normal tissues and organs.
Acknowledgment
The authors of this article wish to thanks Varian medical systems for providing us with the specifications needed for linac simulations.
References
- Fu W, Dai J, Hu Y, Han D, Song Y. Delivery time comparison for intensity-modulated radiation therapy with/without flattening filter: A planning study. Phys Med Biol 2004; 49: 1535-1547.
- Gillies BA, Brien PF, McVittie R, McParland C, Easton H. Engineering modifications for dynamic stereotactically assisted radiotherapy. Med Phys 1993; 20: 1491-1495.
- Brien PF, Gillies BA, Schwartz M, Young C, Davey P. Radiosurgery with unflattened 6MV photon beams. Med Phys 1991; 18: 519-521.
- Jeraj R, Mackie TR, Balog J, Olivera G, Pearson D. Radiation characteristics of helical tomotherapy. Med Phys 2004; 31: 396-404.
- Verhaegen F, Seuntjens J. Monte Carlo modelling of external radiotherapy photon beams. Phys Med Biol 2003; 48: R107-164.
- Sheikh-Bagheri D, Rogers DW. Monte Carlo calculation of nine megavoltage photon beam spectra using the BEAM code. Med Phys 2002; 29: 391-402.
- Mesbahi A, Reilly AJ, Thwaites DI. Development and commissioning of a Monte Carlo photon beam model for Varian Clinac 2100EX linear accelerator. Appl Radiat Isot 2006; 64: 656-662.
- Lee PC. Monte Carlo simulations of the differential beam hardening effect of a flattening filter on a therapeutic x-ray beam. Med Phys 1997; 24: 1485-1489.
- Vassiliev ON, Titt U, Kry SF, Pönisch F, Gillin MT. Monte Carlo study of photon fields from a flattening filter-free clinical accelerator. Med Phys 2006; 33: 820-827.
- Titt U, Vassiliev ON, Ponisch F, Dong L, Liu H. A flattening filter free photon treatment concept evaluation with Monte Carlo. Med Phys 2006; 33: 1595-1602.
- Rogers DW, Faddegon BA, Ding GX, Ma CM, We J. BEAM: A Monte Carlo code to simulate radiotherapy treatment units. Med Phys 1995; 22: 503-524.
- Rogers DW, Walters B, Kawrakow I. BEAMnrc user manual. NRC Report Ioniz Rad Stand 2004.
- Kawrakow I, Walters BR. Efficient photon beam dose calculations using DOSXYZnrc with BEAMnrc. Med Phys 2006; 33: 3046-3056.
- Walters B, Kawrakow I, Rogers DW. DOSXYZnrc user manual. NRC Report PIRS 2005.
- Ma CM, Rogers DW. BEAMDP user manual. NRC Report PIRS 1995.
- Ponisch F, Titt U, Vassiliev ON, Kry SF, Mohan R. Properties of unflattened photon beams shaped by a multileaf collimator. Med Phys 2006; 33: 1738-1746.
