Research Article - Biomedical Research (2018) Artificial Intelligent Techniques for Bio Medical Signal Processing: Edition-II
Medical imaging based spectral reflectance reconstruction combining PCA and regularized polynomial
Ke Wang1,2*, Huiqin Wang1,2, Zhan Wang3, Ying Yin2 and Yi Zhang2
1School of Management, Xi'an University of Architecture and Technology, Xi'an, PR China
2School of Information and Control Engineering, Xi'an University of Architecture and Technology, Xi'an, PR China
3Shaanxi Provincial Institute of Cultural Relics Protection, Xi'an, PR China
- *Corresponding Author:
- Ke Wang
School of Management
Xi'an University of Architecture and Technology, PR China
Accepted date: August 28, 2017
DOI: 10.4066/biomedicalresearch.29-17-494
Visit for more related articles at Biomedical ResearchAbstract
A spectral reflectance reconstruction method based on combining PCA and regularized polynomial is proposed to optimize the spectral data and channel response. Firstly, the PCA method is used to reduce the high dimensional spectral data of the training samples. Then, the polynomial expansion for channel response of the sample is carried out to improve the accuracy of spectral reconstruction through the PCA reduction dimension. At the same time, Tikhonov restriction is added to avoid data instability and random noise caused by polynomial expansion. The simulation experimental results show that, the method presented in this paper is better than the previous method in three precision evaluation method (RMSE, GFC, ISSD).
Keywords
Spectral reflectance reconstruction, PCA, Regularized polynomial, Tikhonov
Introduction
Optical spectral imaging technologies has revolutionized the fields of medical diagnosis and monitoring. The recent advancements in spectral imaging systems have paved way for developing various advancements in the fields of clinical diagnosis and image-guided surgery. These emerging technologies have vast importance in the field of forensic medicine, surgical guidance, biological tissue analysis, cancer detection and diagnosis etc. [1]. Multi-spectral imaging technologies are a dual modality imaging technique that enables in-vivo optical imaging in medical diagnostics. This novel method depicts high quality multi-spectral images from histological samples also. This real time tissue analysis has some major challenges such as tissue deformation, metameric failure, etc.
Under the different lighting conditions, different tissues can produce the same tristimulus value. This phenomenon is called metamerism phenomenon [2]. This phenomenon of metamerism reduces the diagnostic importance of the clinical images [3]. This will in turn lead to the inaccurate colour identification and less reproducibility of results. This is generally called as metameric failure [4]. In order to obtain the accurate colorimetric information of tissue histologies, we can obtain the spectral reflectance from the surface of objects. Different tissues have different spectral reflectance; this feature determines the true color of objects.
The spectral reflectance of objects on the surface is usually smooth. To efficiently obtain the spectral reflectance of different tissue monolayers, researchers designed the multispectral imaging system which can acquire spectral and spatial information of target object with multiple channels. The spectral reflectance can be reconstructed with this information based on some reconstructed methods [2]. However, the dimension of spectral space is often more than 10 times of colorimetric space. Under the condition to meet the reconstruction precision, it is possible to compress the large amount of spectral data to achieve a dimension reduction effect. The common method of compressing data is Principal Component Analysis (PCA) [3]. Using PCA, the original spectral data with certain correlation are combined into a new set of mutually independent data indexes. The essence of this method is to solve the ill-conditioned equation in reconstruction. The number of filters can be increased to get more dimensional information which could reduce ill condition. But in practical applications, the number of filters is usually not very adequate, thus the application of such method will be limited.
To improve the accuracy of spectral reflectance reconstruction, this paper researches the polynomial regression method to extend the channels response without increasing the number of filters for increasing the multidimensional information. However, there is noise in the extended polynomial which leads to the unstable reconstructed result. For this new illconditioned problem, prior information can be used to avoid this problem by adding appropriate restriction to the polynomial. In the above view, this paper researches a spectral reflectance reconstruction method (referred to as PTP) based on combining PCA and regularized polynomial regression in order to reduce the dimension of spectral data and improve the linearity of channels response. At the same time, the Tikhonov regularization is researched to limit ill-conditioned problem.
Principle of Spectral Reflectance Reconstruction
The multi-spectral imaging system is composed of several filters and a monochrome CCD digital camera. The digital response gi of ith filter will be obtained to reconstruct the spectral reflectance of object when using the multi-spectral imaging technique and the spectral reconstruction algorithm. The output response model is Equation (1).
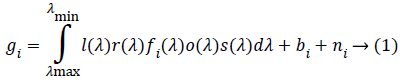
Whereas, l(λ), fi(λ), o(λ) and s(λ) are unknown quantities which can be combined into a single spectral function qi(λ)= l(λ)fi(λ)o(λ)s(λ). bi and ni denotes dark current response and imaging noise under ith filter. The spectral reflectance of the visible wavelength bands of 380~780 nm is represented by 10 nm interval sampling point. Then a N × 1 dimensional vector R is obtained. Correspondingly, the camera channel response is a C × 1 dimensional vector denoted by g. Equation (1) can be rewritten in the form of vector matrices as Equation (2).
g=QR+b+n → (2)
Wherein Q is C × N dimensional matrix of spectral response function, n is dark current which can be removed through the white board [4]. Without considering the effect of noise, the basic form of Equation (2) is expressed as Equation (3).
g=QR → (3)
Principal component analysis (PCA)
In practice, any spectral reflectance data set can be represented as a linear combination of several major unit basis vectors B=[b1,b2,…,bk]. To establish the training samples R, the weighted sum of the k base functions bi can be approximated as Equation (4).
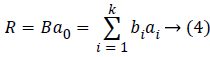
Wherein B=[b1,b2,…,bk] is the last k feature vector of the covariance matrix RRT, a0=[a1,a2,…,ak] is the corresponding transformation matrix. Equation (5) is the result of substituting Equation (4) into Equation (3).
g0=QBa0 → (5)
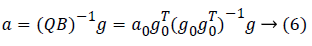
Wherein QB is the response stimulus value of k feature vectors. Equation (5) is multiplied by both side (QB)-1 to obtain the coefficient conversion matrix a0=(QB)-1g0. (QB)-1 will change with the change in the digital response value. For new test samples, the coefficient transformation matrix can be expressed as Equation (6).
Regularized polynomial regression (RPR)
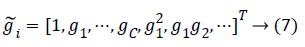
For each color sample, the corresponding response containing C elements (C is the number of channels) can be expressed as gi=[g1,g2,…,gc]T. In general, the greater number of channels, the better linearity of the imaging system will be. In order to improve the linearity of the system, the polynomial regression method [5] can be used to extend the original channels response without increasing the number of filters. This is, gi can be extended to Equation (7).
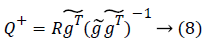
Using g̴ to denote a m × K dimensional matrix, the form of the transformation matrix Q+ is still unchanged, which is Equation (8).
It should be pointed out that when the number of expansion channels is large, the problem of over-fitting will appear in the polynomial regression method, and some random noise will also be included. The two things will affect the stability of data and the reconstruction precision. To solve such ill-posed problems, the polynomial regression can be added to Tikhonov restriction [6,7]. After the restriction is added, the objective function changes to Equation (9).

wherein, the former guarantees the authenticity of the data, and the latter controls the smoothness of the solution. λ is the weight of the latter one relative to the former one.
The proposed PTP method
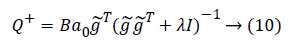
From Equation (3), the accuracy of spectral reflectance reconstruction depended on the transformation matrix Q+ which is obtained from the reflectivity matrix R and the response matrix g of the training samples. Therefore, considering both the spectral data and the channels response, dimension reduction and regularization methods are used to solve the ill-conditioned equations. Firstly, the feature vector B of the spectral data is extracted by PCA, which is used as the input variable of the training samples. Secondly, the regularized control objective function is used to adjust the expanded channel response g̴ as the output variable. The transformation matrix which Tiknonov restricted and PCA dimension reduced is changed as Equation (10).
wherein, I is unit matrix. Because the matrix  is a symmetric and semi-definite matrix, we change as
 to make its feature values in the
 range. Thereby, the conditional coefficient is limited to ensure that the condition number can be minimized. The condition number satisfies Equation (11).
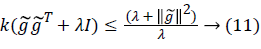
Equation (11) shows that the condition number can be controlled by the regularization parameter λ. We can select the optimal λ by the L curve method to reduce the ill-conditioned problem. Because ||Ba0-Q+g̴|| and ||Q+|| are functions of λ, we make lg||Ba0-Q+g̴|| and lg||Q+|| as the abscissa and ordinate of L curve. When λ makes lg||Ba0-Q+g̴|| and lg||Q+|| to obtain enough small at the same time, just correspond to the L curve corner. The corner point is the maximum curvature point for the L curve. The optimum λ is usually determined from the maximum point. Setting ρλ=||Ba0-Q+g̴|| and η(λ)=||Q+||, the L curve curvature is calculated as Equation (12).
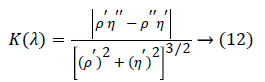
When d[K(λ)]/dλ=0,the curvature K(λ) takes the maximum values which is the optimal λ.
Experimental and Simulation Results Analysis
In the experiments, we used Raul (RAL) color cards including a total of 213 colors. The image data of the Raul color cards under multi-channel were obtained by multi-spectral imaging acquisition system. The spectral reflectance of the color cards were measured by spectrometer with a wavelength range of 380-780 nm and a sampling interval of 10 nm. When the data acquisition, 60 colors were selected as training samples, and the remaining colors were used as test samples using the MAXSUM method [8]. The PCA, RPR and PTP methods were respectively used to reconstruct the spectral reflectance by using Matlab2010b as the simulation platform. For the spectral reconstruction effect of the above three algorithms, the RMSE (root mean square error), GFC (goodness of fit coefficient) and ISSD (the index of system spectrum estimation shifting degree) are used to evaluate the spectral reconstruction accuracy. ISSD as a parameter to evaluate the spectral estimation uses only one index to evaluate the coincidence degree of the spectral curve [9-12]. When the two spectral vectors are identical, the matching skewness is 0. The smaller the absolute value of matching skewness, the higher the matching degree of the two spectra. The larger the absolute value of matching skewness, the less the matching degree of the two spectra. The accuracy of spectral reconstruction of the three reconstruction methods is shown in Table 1.
| RMSE | GFC (%) | ISSD | |||||||
|---|---|---|---|---|---|---|---|---|---|
| Mean | Max | Min | Mean | Max | Min | Mean | Max | Min | |
| PCA | 0.0391 | 0.0561 | 0.0116 | 98.20 | 99.63 | 93.53 | 0.1463 | 0.6371 | 0.0638 |
| RPR | 0.0241 | 0.0421 | 0.0109 | 98.17 | 99.74 | 92.53 | 0.1596 | 0.5556 | 0.0211 |
| PTP | 0.0185 | 0.0323 | 0.0067 | 99.51 | 99.96 | 98.81 | 0.1059 | 0.3593 | 0.0107 |
Table 1. Description of study comparison of PCA, RPR AND PTP.
From Table 1 we can see that the GFC average of the PTP method is above 99.5%, it shows that the reconstructed spectral reflectance curve and the original spectral reflectance curve cosine angle is very small to achieve a satisfactory reconstruction effect. And the lowest ISSD is 0.0107, indicating that the two spectral vectors have a relatively high degree of coincidence. The average spectral matching bias index of PTP method is also significantly lower than the other two methods, which further explains it is reliable to evaluate the degree of difference between the two spectral vectors by ISSD. The spectral reflectance curves of the partial color sample reconstructed using the three methods are shown in Figure 1. The ISSD value of sample in Figure 1a is 0.0218, representing the samples with a high coincidence degree between the reconstructed spectral curve and the original spectral curve. The ISSD value of sample in Figure 1b is 0.1214, representing the samples with a general coincidence degree between the reconstructed spectral curve and the original spectral curve. The ISSD value of sample in Figure 1c is 0.3513, representing the samples with a low coincidence degree between the reconstructed spectral curve and the original spectral curve. From Figure 1 we can see that the reconstructed spectral reflectance curve of the PTP method proposed in this paper has higher coincidence degree with the original spectral curves than the other two methods.

Figure 1: The spectral reflectance curves of the partial color samples.
Conclusion
In this paper, we propose a spectral reflectance reconstruction method PTP based on PCA and regularized polynomial, and evaluate the accuracy of reconstructed spectral reflectance of PTP. The experimental result shows that the PTP method considers both the spectral data and the influence of channel response on the reconstruction accuracy. The PTP method combines the PCA dimension reduction and channel response for the second order polynomial expansion of the spectral data which adds Tikhonov restriction to avoid the problem of data instability and over-fitting caused by random noise. As a result, the PTP method reduces the amount of data in multi-spectral data processing and improving the reconstruction accuracy of the algorithm, which is superior to the single reconstruction method. The PTP method in practical application can meet the requirements of color measuring, color quality assessment and other high-precision in the medical diagnosis and monitoring. This technology can improve the diagnostic reliability of medical imaging techniques in terms of quality as well as cost effectiveness.
Acknowledgment
This work is supported by the Chinese Research Projects for the Returned Overseas Students of the Education Ministry (No.K05055), Xi'an Science Technology Bureau (No. 2016043SF/RK06(3)), Beilin District Science Technology Bureau (No.GX1606), the Youth Fund of Xi'an University of Architecture and Technology (No.QN1628, No.QN1020).
References
- Lu G, Fei B. Medical hyperspectral imaging: a review. J Biomed Optics 2014; 19: 010901.
- Ren PY, Liao NF, Chai BH. Spectral Reflectance Reconstruction Based on Multispectral Imaging. Optical Technology 2005; 31: 427-429.
- Hidović-Rowe D, Claridge E, Ismail T, Taniere P, Graham J. Analysis of multispectral images of the colon to reveal histological changes characteristic of cancer. Med Image Understand Anal MIUA 2006; 1: 66-70.
- Korzynska A, Zak J, Roszkowiak L, Pijanowska D, Markiewicz T. Color standardization for the immunohistochemically stained tissue section images. IEEE International Conference on Imaging Systems and Techniques (IST), 2016.
- Yang WP, Xu N, Duan JJ. Application and Development of Multispectral Imaging in Color Reproduction. J Yunnan Nat University: Nat Sci Edn 2009; 18: 191-197.
- Wang YF, Tang ZN. Dimensionality Reduction Method based on Combination of PCA and ICA. Optical Technique 2014; 2: 180-183.
- Zhang WF. Spectral Reflectance Reconstruction based on Support Vector Regression. Computer Sci 2010; 12: 241-242.
- Liang H. Advances in Multispectral and Hyperspectra Imaging for Archaeology and art Conservation. Appl Physics Mat Sci Process 2012; 106: 309-323.
- Neumaier A. Solving Ill-Conditioned and Singular Linear Systems: A Tutorial on Regularization. Siam Rev 1998; 40: 636-666.
- Xie DH, Li R, Wan XX. Iterated Tikhonov Regularization for Spectral Recovery form Tristimulus. Spectroscopy Spectral Anal 2016; 36: 201-205.
- Colorchecker G. Methods for Optimal Color Selection. J Imag Sci 2006; 50: 481-488.
- Li SX, Liao NF, Sun YN. A new parameter for evaluating spectral estimation precision of multispectral camera. Spectroscopy and Spectral Anal 2007; 27: 1461-1464.