Research Article - Biomedical Research (2019) Volume 30, Issue 4
Machine learning based approach for vestibular disorder diagnostic in videonystagmography
Amine Ben Slama1*, Hanene Sahli2, Aymen Mouelhi2, Jihene Marrakchi3, Hedi Trabelsi1, Mounir Sayadi2
1University of Tunis El Manar, ISTMT, LR13ES07, LRBTM, Tunis, Tunisia
2University of Tunis, ENSIT, LR13ES03 SIME, Monfleury Tunis, Tunisia
3Department of Oto-Rhino-laryngology, La Rabta Hospital, Tunis, Tunisia
- *Corresponding Author:
- Amine Ben Slama
University of Tunis El-Manar ISTMT
LR13ES07, LRBTM Tunis Tunisia
Accepted Date: May 13, 2019
DOI: 10.35841/biomedicalresearch.30-19-216
Visit for more related articles at Biomedical ResearchAbstract
Nystagmus is a common sign of peripheral vestibular disorder (VD). Several problems have been recently noted from Video Nystagmo Graphic (VNG) analysis to get relevant diagnosis of VD diseases. The Vestibulo-Ocular Response (VOR) is characterized by a smooth pursuit eye movement in one direction, called slow phase of ocular nystagmus, which is interrupted by saccades (fast phases) in the other direction. The recording of ocular nystagmus during vestibular tests does not quantify the true response of the vestibulo-ocular reflex (VOR). So, to extract the real VOR, our study is focused on nystagmus analysis with videonystagmography (VNG) technique based on measuring amplitude and frequency vibration of eyeball movement. In this paper, we have proposed a fully automatic system based on nystagmus parameter analysis using a pupil detection algorithm and a machine learning approach for VD recognition. Firstly, an estimation of the pupil movement vectors using Hough Transform (HT) is employed to approximate the location of pupil region. Then, temporal and frequency features are computed from the rotation angle variation of the pupil motion. Finally, pertinent features are selected using a statistical criterion for discrimination and classification of the VD disease. Experimental results are employed using two categories which are normal and pathological cases. By discriminating the reduced features with the Support Vector Machine (SVM) technique, 94% of classification accuracy results are achieved. Compared to existing learning methods, the proposed technique is extremely effective to resolve the problem of VD assessment and provide an accurate diagnosis for medical devices.
Keywords
Vestibular neuritis, Nystagmus, Videonystagmographic (VNG) technique, Statistical criterion, SVM classifier.
Introduction
Recently, several research works [1-3] have been achieved in the field of vertigo assessment caused by vestibular disorder diseases, and up today, a practical evaluation of this disease is still being a challenging assignment for ENT doctors. In fact, the vestibular dysfunction [4] can generate disequilibrium and vertigo caused by a unilateral reflectivity of the vestibule. The vertigo is approximately a reason of clinical observations to evaluate subjects through the VNG technique for a fine analysis to understand the mechanisms of vestibular input caused by vestibular nerve, or central nervous.
The new system which has a new break through is Electronystgmograhy’s (ENG) technology. It has obstruction that perturb or prevent any reflectivity or hypovalence measurements considering the nystagmus slow phase.
These two barriers are:
• The unbalanced variation of the cornea tension, which disturb the nystagmus measurement.
• Irregular polarizations tension of the electrodes.
Nystagmus is an ocular motor disorder that is mostly horizontal and is manifested as involuntary eye movement [4]. It contains a slow eye movement interrupted by a reset phase and it is the most efficient sign of vestibular disorder in clinical analysis.
Eye recordings are still used for the evaluation of nystagmus vibration using VNG technique. This technique uses an infrared camera CCD to record eye motion in various tests. In order to study the vestibular system functionalities, and to quantify accurately the frequencies of eye movements that can result from unilateral or bilateral vestibular dysfunction.
However, many techniques of nystagmus analysis have been used to screen and analyze vestibular problems: The ENG and VNG [5].
VNG technique uses a parameterized method based on amplitude, velocity, and frequency of nystagmus signal. Several video processing approaches using VNG system lack precision in the detection of eye location caused by blinking noise and slow performance [6]. In order to resolve the complexity of pupil tracking, many methods are proposed in order to detect pupil location using a circle operator [7]. But these methods can miss pixels produced by a spatial deviation between the ideal pupil edge and the noisy points. Ohzeki et al. [8] developed several algorithms by a parameterized model with filtering techniques to reduce noise in the decomposition of the eye movement signal. Furthermore, Juhola et al. [9] proposed an algorithm for analysis of torsional nystagmus captured from VNG technique.
Different algorithms are frequently employed for pupil segmentation [10,11]. In the work of Daugman et al. [12], a pupil segmentation algorithm is used to track eye oscillation, but the principal drawback of this method is the difficulty to track the entire trajectory of eye. In addition, other methods were used for eye tracking using iris pattern. The crosscorrelation method [13] is usually applied in clinical practice. The major problem of this algorithm is the manual selection of iris area and the difficulty to compute the pupil deviation angle. Also, the efficiency of this method is still distorted by experimental conditions.
In this paper, we have proposed a new approach that can be used to provide a practical solution for vestibular neuritis characterization and detection using the VNG system. However, a simple VNG test cannot identify all vestibular problems. The nystagmus has a very complex signal. In fact, the rotation angle of eye movement is not adequate for the consistency of the clinical vestibular disorder information.
In attempt to employ more features from the VNG, we have proposed a methodology to extract temporal and frequency parameters of the nystagmus as new discrimination components vestibular neuritis. The main objective of this study is to present a new approach to amelorate the evaluation of vertigo. This technique is based on the selection of the most significant VNG features using HT algorithm for pupil tracking.
This paper is structured as follows: Section I represents the introduction, Section II illustrates data collection and the proposed method of VNG analysis for VD detection. Feature extraction and reduction of eye movement is given in Section III. Section IV presents results of pupil segmentation, feature extraction, reduction and classification. Finally, Section V is devoted to a conclusion and future works.
Materials and Methods
Data base collection
Our database consists of 60 subjects. 45 are confirmed to have vestibular neuritis, and 15 are normal. The dataset is evaluated using VNG sequences recorded during caloric and kinetic tests. As illustrated in Figure 1, the proposed methodology consists of two important steps: (a) Feature extraction and reduction: Based on the VNG images, temporal and frequency features extracted from pupil movement. (b) Feature classification using SVM method: The machine learning method is applied to separate subjects into two classes. The methods of classification have for purpose to identify the two VNG classes (Vestibular Neuritis (VN), Normal cases (NL)) based on some descriptive parameters. They apply to a large number of human activities and agree in particular with the problem of the automated decision-making. A learning system must then, extract a classification procedure from this set of examples. In fact, it is applied to extract a general rule on the basis of observed feature data.

Figure 1: Parameters of standard hough transform.
Nystagmus detection and optimized feature for neuritis discrimination
Afterwards, we have got an accurate segmentation result of pupil motion. In fact, the pupil shape is variable due to the fast nystagmus vibration; this dynamic variation can lead to a bad position detection. To overcome these problems, we have used a combined Otsu and mathematical morphology. Segmentation is used to locate the pupil by global threshold. Note that a threshold is used in each frame to perform a specific segmentation for pupil region detection. In fact, we have applied an adaptive threshold using only the pixels of pupil region for every frame.
Thus, a separation between the ROI (the pupil) and the background is applied based on the higher ratio between the inter and intra-class variances. Then, we have applied a morphological function using the opening and closing algorithm to remove pixels that can produce a false detection caused by the infrared light.
In order to compute the pupil position, Hough Transform algorithm (HT) is applied to obtain the pupil boundary and (x,y) center coordinates. As basic information for our vertigo assessment, we have extracted the rotation angle of pupil from the VNG sequence. Furthermore, the computed eye movement agrees with the occurrence of two-phase nystagmus components (slow and fast). The nystagmus waveform is differentiated to compute the velocity of the two slow phases which considers the difference between two successive signal points obtained by the following equation.
The standard Hough transform [14] is a form recognition method used for digital image processing. This technique was introduced specifically to find geometric edges. To detect the shape of the fetal head, Hough's circle detection method, also called HCT (Hough circle transform), is used. In this method, a circle is given by its Cartesian equation:
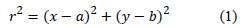
Where the point (xc, yc) of (a,b) coordinates presents the center of the circle, and r is the radius of the circle (Figure 1).
In the space (a,b,r), a circle is characterized by a point. The set of circles passing through a given point M (x,y) forms a vertex cone (a=x, b=y, r=0) and an axis r. A fine detection of the eye corresponds clearly to the intersection between several cones. If the radius of the searched circle is known, we can then place fix in the plane (a,b).
An accumulation matrix A is created: each element A (i,j) of the matrix contains the number of circles passing through the point M corresponding to this element. If the radius is unknown, the technique consists to generate an accumulation hypermatrix where each cell A (i,j,k) corresponds to a cube of the space (a, b, r), searching the entire radius from 1 pixel up to the dimension of the image.
After detecting the eye movement from VNG sequence using HT method, we extracted from the VNG sequence the rotation angle of pupil as basic information for our vertigo assessment. Furthermore, the computed eye movement agrees with the occurrence of two phase’s nystagmus component (slow and fast). The nystagmus waveform is differentiated to compute the velocity of the two slow phases which considers the difference between two successive signal points obtained by the following equation.
Few original features such as amplitude and frequency of nystagmus are selected from eye movement waveform [15]. The concept of temporal and frequency feature extraction based on segmentation method is a critical task in the field of vestibular evaluation, different features are extracted from the rotation angle of eye movement in order to select the most significant parameters that can be used for the classification stage.
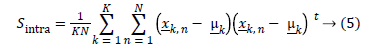
Note that an overlap between the available extracted features is not appropriate for the training process. In this stage, we have computed a Fisher criterion J [16,17] as the ratio between the inter-class and the intra-class variance for the selection of pertinent feature (Figure 2).

Figure 2: Organization graphic of the proposed VNG data reduction and classification.
The following algorithm presents the proposed Fisher criterion method.
Algorithm 1 of Fisher criterion computing
Calculate the mean feature vectors of the kth class.
Calculate the total average feature vectors of all classes.
Calculate the intra-class variance matrix of average dispersion coefficients.
Calculate the inter-class variance of average dispersion between different classes.
Finally, the J value is computed as follows
Before using Fisher criterion, it is necessary to apply a phase of standardization. The used technique is the normalization with zero average and constant variance as follows:
Feature classification using SVM for VD detection
The support vector machine (SVM) is a binary classification method using hypothesis space of linear functions by a projected data in a high dimensional feature space [18,19]. Using a kernel function, the SVM algorithm is based on the maximization margin between the data in order to present the discriminant vectors of the projection plan.
For our classification problem, two SVMs binary values are trained to define the class of binary subjects using the Gaussian Radial Basis Function kernel (Figure 3).

Figure 3: The basic principle of SVM algorithm using the gaussian using the radial basis function.
Results and Discussion
Segmentation results using hough transform method
In this work, we have used VNG sequences during the caloric and kinetic tests obtained from CCD camera with 30 fps frame rate and a resolution of 1980 × 720. In Figure 4, we present the pupil detection results using the HT model in different frame of two VNG sequence of normal and abnormal dataset.

Figure 4: Segmentation of pupil region image using HT and PCA algorithm in the first and second row: (a) Frame 1, (b) the Frame 2, (c) Frame 3 and Frame 4.
From the segmentation results, four subsequent frames are selected to prove the efficacy of the proposed HT procedure in pupil motion detection compared the PCA algorithm (First and second row of the Figure 4).
The performance of HT model is compared to the results given PCA method and the ground truth given by three experienced experts from VNG image segmentation results.
After many experiments, we conclude that the HT model proposed in this work gives an efficient segmentation result and an adequate convergence time process in 30 frames (Table 1).
| VNG Images Dataset | |||
|---|---|---|---|
| Accuracy (%) of pupil segmentation region | Hough Transform method | PCA method [16] | Ground truth |
| Mean | 85.45 | 79.12 | |
| Standard deviation | 4.72 | 6.54 | - |
| Min | 78.73 | 72..94 | - |
| Max | 87.25 | 81.12 | - |
| Total time of convergence (s) | 67.24 | 76.56 | - |
Table 1. Comparison results of the region detection segmentation methods on the database of 30 Video Nystagmo Graphy (VNG) images.
Results of feature extraction and reduction of nystagmus
In the classification pre-process, Fisher criterion is computed to estimate the training dataset and to select the pertinent features which are commonly more suitable for the classification stage as shown in Table 2.
| Features | Highest Priority Features |
|---|---|
| MaxFrq | * |
| minFrq | - |
| MnFrq | - |
| MaxFV | * |
| minFV | - |
| MnFV | - |
| MaxSV | - |
| minSV | * |
| MnSV | - |
| SPN | * |
| SFN | * |
Note: MaxFrq=Maximum nystagmus frequency; minFrq=Minimum nystagmus frequency; Mnfrq=Mean nystagmus frequency; MaxFV=Maximun fast velocity; minFV=minimum fast velocity; MnFV=Mean fast velocity; MaxSV=Maximum Slow Velocity; minSV=Minimum Slow Velocity; MnSV=Mean Slow Velocity SPN=Slow Period Nystagmus; SFN=Fast Period Nystagmus.
Table 2. Features selection in terms of choice of the highest-priority features *significant features; -: not significant features.
Hence, the “J” criterion value superior to 1 is approved to recognize the rotation angle variation features extracted from pupil movement of two patients affected by the VN and normal one which are obtained from two VNG stimulation test: kinetic test and caloric (Figure 5).

Figure 5: Rotation angle of eye movement from representative VNG sequences of kinetic and caloric test (a)-(b) affected and normal case respectively by: (a)-(b) vestibular neuritis, (c)-(d) normal case.
Then, we have select the maximum frequency of nystagmus (MaxFrq), the maximum fast velocity of nystagmus (MaxFV), the minimum slow velocity (minSV), and the standard deviation of both nystagmus frequency and period respectively (SFN), and (SPN) which are used to train the support vector machine (SVM) for the classification process (Table 2).
Classification results using FLD-SVM method
In this section, we have presented a comparison study of the classification results using Fisher-SVM method with those obtained by KNN (k-nearest neighbours) based on the distance function and the neighbour number K, and the artificial neural network (ANN) classifier.
A cross-validation experiment is applied in order to select the optimum SVM classifier structure.
The training-feature vectors set are divided into five equally sized sub datasets (Five folds). Each iteration presents four folds for the training and one-fold for the validation.
The tangent sigmoid transfer function is used for all neurons. In Table 3, a comparative study between Fisher-SVM and ANN classifiers is applied in term of validation error rate using five-fold cross-validation technique [18].
| Classifier | Fold 1 | Fold 2 | Fold 3 | Fold 4 | Fold 5 | Mean |
|---|---|---|---|---|---|---|
| KNN | 15.3 ± 2.7 | 14.5 ± 2.5 | 16.2 ± 2.9 | 13.7 ± 2.8 | 13.1 ± 2.3 | 14.56 ± 2.64 |
| ANN | 12.8 ± 2.4 | 12.9 ± 2.6 | 11.8 ± 1.8 | 10.4 ± 1.6 | 9.5 ± 1.2 | 11.8 ± 1.9 |
| Fisher-SVM | 5.9 ± 1.1 | 5.4 ± 0.9 | 5.6 ± 0.8 | 4.8 ± 0.6 | 4.3 ± 0.5 | 5.2 ± 0.8 |
Table 3. Validation error rates (%) of the Fisher-SVM, KNN and ANN classifiers using the five-fold cross-validation technique tested on the training features dataset (Mean Values ± Standard Deviation).
For each given training subset, we have also used five-fold cross-validation experiments to select the optimal number of hidden nodes.
From the cross-validation results, it is clear that the Fisher- SVM classifier is more efficient than the KNN and ANN methods in term of validation error rate (less than 6%).
The generated procedure needs to classify correctly the examples of the sample (the five features among 13 selected with top priority (MaxFrq, MaxFV, MinSV, SPN and SFN) having an efficient predictive power to classify correctly new descriptions. The classification process based on Fisher-SVM, KNN and ANN classifiers is collected from two different phases: (i) Considering that the training parameters dataset are divided into five sets, training sets are higher than 50% of the database (42 subjects randomly chosen). Contrarily to test sets that present only 25% of databases (ii) while the test of the network is prepared with a smaller part of the database.
The SVM structure is composed of five inputs according to the number of reduced feature vectors, a single hidden layer and an output layer. The two output nodes are created to detect vestibular neuritis disease from normal cases. In order to use the pertinent parameters of the projection plan, the SVM classifier is fixed on the maximization margin between the VNG dataset using a kernel function. In this work, using the Gaussian Radial Basis Function kernel, SVM binary values are trained to identify the binary topic classes. Therefore, the SVM target values are made with a threshold equal to 0.95 (desired VN class) or -0.95 (desired Normal class). The purpose of the methods of classification is to identify the two classes based on some descriptive parameters. They apply to a large number of human activities and agree particularly with the problem of the automated decision-making. The classification procedure is extracted automatically from a set of examples: 45 abnormal patients (affected by VN disease) and 15 normal patients. An example is the description case with the corresponding classification. From this set of examples, we have extracted a classification procedure; it is in fact to extract a general rule on the basis of observed data. The generated procedure needs to classify correctly the examples of the sample (the five features among 11 which are selected with top priority; maximum frequency (MaxFrq), maximum fast velocity (MaxFV), minimum slow velocity (minSV), standard deviation of nystagmus period (SPN) and standard deviation of nystagmus frequency (SFN)) and it has a good predictive power for correctly classify new descriptions.
Indeed, the basic idea and major advantage of the proposed method is shown in Table 4. We can see that the proposed method (Fisher-SVM) is more accurate (94%) than the KNN and (ANN) classifier; these results are compared by the ground truth given by three experienced experts. Finally, from the achieved results, we can conclude that the SVM classifier is more efficient, it provides a precise recognition of the vestibular neuritis disease. Through the validation stage, we have note that our proposed approach improves considerably the classification accuracy rate in vestibular disorder diagnostic process. We can also deduce that the use of the proposed method leads to closer results to those given by experts.
| Experiments | ANN Classifier | KNN Classifier | Fisher-SVM Classifier | ||||||
|---|---|---|---|---|---|---|---|---|---|
| SE (%) | SP (%) | AC (%) | SE (%) | SP (%) | AC (%) | SE (%) | SP (%) | AC (%) | |
| Experiment 1 | 88.3 ± 1.9 | 89.5 ± 1.8 | 86.8 ± 1.8 | 86.5 ± 2.1 | 87.6 ± 1.9 | 85.3 ± 1.8 | 93.2 ± 1.1 | 95.9 ± 0.4 | 94.1 ± 0.3 |
| Experiment 2 | 87.5 ± 2 | 90.3 ± 1.5 | 86.4 ± 2.1 | 85.9 ± 2.4 | 87.3 ± 1.6 | 84.1 ± 2.4 | 94.1 ± 0.7 | 95.8 ± 0.8 | 94.2 ± 0.8 |
| Experiment 3 | 86.8 ± 1.9 | 87.5 ± 1.8 | 85.5 ± 2.1 | 85.4 ± 2.1 | 88.3 ± 1.7 | 83.5 ± 2.6 | 94.6 ± 0.5 | 93.5 ± 0.8 | 92.9 ± 0.6 |
| Experiment 4 | 86.7 ± 2.5 | 89.8 ± 1.2 | 84.5 ± 2.1 | 84.9 ± 2.8 | 87.3 ± 1.8 | 83.9 ± 2.2 | 93.3 ± 0.8 | 91.4 ± 0.6 | 95.3 ± 0.8 |
| Experiment 5 | 83.9 ± 2.5 | 90.4 ± 1.2 | 85.4 ± 2.3 | 82.6 ± 2.8 | 85.3 ± 1.9 | 80.6 ± 2.5 | 93.2 ± 0.6 | 93.9 ± 0.5 | 94.4 ± 0.4 |
Table 4. Fisher-SVM, KNN and ANN classifier in terms of sensitivity (SE), specificity (SP) and accuracy (AC) on the selected features with five experiments (Mean Values ± Standard Deviation).
Consequently, this work presents an important comparison study of all treated measurements from previous works. In addition, there is no standard methodology which is reliably able to identify the vestibular neuritis without measuring all the parameters of the VNG sequence. That is why this study is considered exceptional comparing the number of treated measurements and tests with previous works [20]. With these results, we conclude that the proposed pre-processing and classification method can consistently be used to assist ENT doctors by providing a second judgment for indefinite cases that need further attention [18,21].
After the classification stage, an interesting process is presented to increase the diagnostic strategy of vestibular disorders by the use of a statistical study performed on our VNG database. The presentation of a clinical VNG test can be presented in terms of the uniformity of the analysis or the aptitude of the parameters from different tests, to differentiate between the affected patients by the VN disease and the normal ones. In order to get the optimal feature combination that conveys more information about VN, a statistical method is used to measure the relationship between the selected VNG features and the actual status of patients in the dataset.
Table 5 presents the results of the correlation coefficient between physical and different VNG parameters. According to these results, it is interesting to keep the selected features from FLD process as a descriptive parameter [22,23] and pertinent measures that can be used for vestibular neuritis analysis. These parameters give the low correlation with respect to the physical variable (age, sex). Hence, the relationship between the age, sex and the presence of the vestibular neuritis confirmed that these parameters which presents the low correlation rate are not influenced by the physical state of subjects. As far as the clinical treatment is concerned, these parameters help for the stability of diagnosis; the maximum nystagmus frequency (MaxFrq), maximum fast velocity (MaxFV), minimum slow velocity (minSV), standard deviation of nystagmus period (SPN) and standard deviation of nystagmus frequency (SFN) [24]. As a statistical analysis, making a second decision of medical practice [25] a clinical strategy can be based on the use of five parameters the MaxFrq, the MaxFV the minSV, the SPN, and the SFN [26].
| Selected Features | ||||||
|---|---|---|---|---|---|---|
| MaxFrq | minSV | MaxFV | SPN | SFN | ||
| Physical variables | Age | 31 | 20 | 32 | 17 | 36 |
| Sex | 16 | 17 | 20 | 9 | 25 | |
Table 5. Correlation in (%) between the age, sex and pathological variables extracted from VNG sequence.
Conclusion and Future Works
In this paper, we have presented a new direction for medical characteristics of nystagmus waveform extracted from VNG sequence in order to identify vertigo causes, especially vestibular neuritis disease. A proposed segmentation approach is used to detect angular eye movement based on HT algorithm. Then, effective methods are introduced by feature extraction, characterization, and classification based on temporal features of nystagmus waveform. Therefore, the selected feature process can be used to classify vestibular neuritis disease achieving an accuracy of 94% and an error rate of 6%. Compared to previous works, experimental results demonstrate that the proposed methodologies are extremely helpful and adequate for a real clinical application. Besides, this work presents a solid foundation for the development of an expert diagnosis and prognosis system. In future works, several attempts can be made to characterize and classify different categories of vestibular disorder disease. This work can present multiple contributions in the context of an expert diagnosis for the development of VNG application.
Acknowledgment
We are grateful for the support of Professor Mamia Ben Salah at Charles Nicolle Hospital of Tunis, who provided us a part of data used in this work.
Conflict of Interest
We have no conflict of interest to declare.
References
- Chen DL, Liu Y. Application of Video nystagmography to vertigo diagnosis. Chinese Medical Equipment Journal 2011; 6:32-46.
- Asawavichiangianda S, Fujimoto M, Mai M, Desroches H, Rutka J. Significance of head-shaking nystagmus in the evaluation of the dizzy patient. Acta Otolaryngol Suppl 1999; 540: 27-33.
- Lin FR, Migliaccio AA, Haslwanter T, Minor LB, Carey JP. Angular vestibuleocular reflex gains correlate with vertigo control afterintratympanic gentamicin treatment for Meniere’s disease. Ann Otol Rhinol Laryngol 2005; 114: 777-785.
- Shery T, Proudlock FA, Sarvananthan N, McLean RJ, Gottlob I. The effects of gabapentin and memantine in acquired and congenital nystagmus: a retrospective study 2006; 839-843.
- Kim S, Cho J, Jung J, Kim S, Lim J, Nam T, Kim J. A fast center of pupil detection algorithm for VOG-based eye movement tracking. Proceedings of the 2005 IEEE Engineering in Medicine and Biology 27th Annual Conference 2005.
- Savage CO Eye position prediction in the case of nystagmus and refixations. In Engineering in Medicine and Biology Society, EMBC, 2011 Annual International Conference of the IEEE 2011pp. 7924-7927.
- Daugman JG. Probing the uniqueness and randomness of iris codes: Results from 200 billion iris pair comparisons. Proc IEEE 2006; 94: 1927-1935.
- K Ohzeki, B Ryo. Video Analysis for detecting eye blinking using a high-speed camera. Fortieth Asilomar Conference on Signals, Systems and Computers 2006.
- M Juhola, H Aalto, T Jutila, TP Hirvonen. Signal analysis of three-dimensional nystagmus for otoneurological investigations. Ann of Biomed Eng 2001; 39: 973-982.
- Zhu D, Moore ST, Raphan T. Robust pupil center detection using a curvature algorithm. Comput Methods Programs Biomed 1999; 59: 145–57.
- Villanueva A, Cabeza R, Porta S. Eye tracking : Pupil orientation geometrical modeling. Image Vision Comput 2006; 24:633–679.
- Daugman JG. High confidence visual recognition of persons by a test of statistical independence. IEEE Trans Pattern Anal Mach Intell 1993; 15: 1148-1161.
- Iijima A, Minamitani H, Ishikawa N. Image analysis of quick phase eye movements in nystagmus with high-speed video system, Med Biolo Eng Comput 2001; 39: 2-7.
- Hertle RW, Zhu X. Oculographic and clinical characterization of thirty-seven children with anomalous head postures, nystagmus, and strabismus: the basis of a clinical algorithm. JAAPOS 2000; 4: 25-32.
- Ben Slama A, Mouelhi A, Sahli H, Manoubi S, Mbarek C, Trabelsi H, Fnaiech, F, Sayadi M. Features extraction for medical characterization of nystagmus. In Advanced Technologies for Signal and Image Processing (ATSIP), 2nd International Conference on 2016 pp. 292-296.
- Yuling Y, Gan D, Chi Z, Marriott G. Snake based automatic tracing of vocal fold motion from highspeed digital images 2012 PP: 593-596.
- Mouelhi A, Sayadi M, Fnaiech F, Mrad, K, Romdhane, KB. A new automatic image analysis method for assessing estrogen receptors’ status in breast tissue specimens. Computers in Biology and Medicine 2013; 43: 2263-2277.
- Ben Slama A, Mouelhi A, Sahli H, Manoubi S, Mbarek C, Trabelsi H, Fnaiech F, Sayadi M. A new pre-processing parameter estimation based on geodesic active contour model for automatic vestibular neuritis diagnosis. Artif Intell Med 2017; 80: 48-62.
- Mouelhi A, Sayadi M, Fnaiech F, Mrad K, Romdhane KB. Automatic image segmentation of nuclear stained breast tissue sections using color active contour model and an improved watershed method. Bioed Sig Proc Cont 2013; 8: 421-436.
- Akman OE, Broomhead DS, Clement RA, Abadi RV. Non-linear time series analysis of jerk congenital nystagmus. J Comput Neurosci 2006; 21: 153-170.
- Sahli H, Zaafouri A, Slama AB, Rachdi R, Sayadi M. Analytic approach for fetal head biometric measurements based on log gabor features. Ira J Sci Technol 2018; 1-9.
- Slama BA, Lentka, Ł, Mouelhi A, Diouani MF, Sayadi M, Smulko J. Application of statistical features and multilayer neural network to automatic diagnosis of arrhythmia by ECG signals. Metrology and Measurment Systems 2018; 25: 87-101.
- Slama BA, Sahli H, Mouelhi A, Tlig L, Manoubi S, Mbarek, C, Trabelsi H, Sayadi M. Automated approach for vestibular disorder diagnosis based on clinical VNG feature selection and fuzzy clustering, Biomed res 2018; 29: 1505-1513.
- Slama BA, Mouelhi A, Sahli H, Manoubi S, Lahiani R, Ben Salah M, Trabelsi H, Sayadi M. A new neural network method for peripheral vestibular disorder recognition using VNG parameter optimization. Int J Biomed Eng Technol 2018; 27: 321-336.
- Nahid AA, Mikaelian A, Kong Y. Histopathological breast-image classification with restricted Boltzmann machine along with backpropagation. Biomed Res 2018; 29: 2068-2077.