Research Article - Journal of Public Health Policy and Planning (2020) Volume 4, Issue 4
Individual health-related quality of life and the regional allocation of medical services: Insights from a stochastic health frontier analysis.
Rouven E Haschka1*, Helmut Herwartz2, Katharina Schley2
1Chair for Econometrics, University of Göttingen, Humboldtallee,3,37120, Germany
2Institute of Statistics, University of Göttingen, Humboldtallee, 3,37120, Germany
- *Corresponding Author:
- Rouven E Haschka
Chair for Econometrics
University of Göttingen, Germany
Tel: +49 551 39 21390
E-mail: rouven.haschka@uni-goettingen.de
Accepted date: August 17, 2020
Citation: Haschka RE, Herwartz H, Schley K. Individual health-related quality of life and the regional allocation of medical services: Insights from a stochastic health frontier analysis. J Public Health Policy Plann April 2020;4(4):42-57
DOI: 10.35841/public-health-policy.4.4.42-57
Visit for more related articles at Journal of Public Health Policy and PlanningAbstract
Health care systems around the world face increasing budgetary pressures due to a growing number of cases and new and costly treatment options. Improving health-related quality of life while achieving cost-containment is the ultimate goal of an efficient provision of health care services. By means of a stochastic frontier analysis, we condition subjective individual healthrelated quality of life on individual characteristics, such as health-related behaviour and socioeconomic status and regional indicators, like the medical infrastructure and demographic and socio-economic profiles. Our results indicate a positive relationship between general outpatient care and individual well-being. However, regional misallocation of medical services relates to inferior outcomes of regional health care service provision which are likely to negatively affect health-related quality of life at the individual level.
Keywords
Health-related quality of life, Health production, Health efficiency, Stochastic frontier analysis, Oversupply of medical services, Regional misallocation.
Introduction
Many health care systems around the world are suffering from cost pressures. Especially ageing populations, obesity and unhealthy lifestyles lead to demographic and social changes which are at risk to raise burdens of chronic diseases (e.g. cancer, cardiovascular diseases, diabetes). A larger number of patients with more co-morbidities and needs for intensified treatments affect the cost per patient and increase the pressures on health care budgets. Nowadays, health care expenditures grow faster than the gross domestic product (GDP) in most developed countries [1].
Seeing prevalent financial pressures and needs to handle more cases at constant budgets, the notion of so-called value based care [2,3], hints explicitly at the importance of quality of care within the multidimensional space of health outcomes. As noted in Porter [3] improving well-being at the individual level promises ‘true’ cost-containment. In this context reorganising the provision of medical care could become an important means to achieve favourable systemic health outcomes. Put differently, restructuring the regional allocation of the medical infrastructure might enhance well-being at individual levels and thereby benefit the efficiency of health care systems. Specifically, an unequal regional distribution of, e.g., physicians is likely related to an inferior performance of health care services showing up in higher burdens of diseases and, thus, ultimately straining the capabilities of the health care system. Additionally, growing costs of medical treatments arise from the over-use and misuse of medical services which are likely to spur the uncertainty of medical [4,5]. As all medical decisions are made under uncertainty, understanding the triggers of insecurity of patients possibly benefits Health-Related Quality of Life (HRQoL) and thereby supports cost containment.
A voluminous literature has been studying the performance of health care service provision and allows a broad classification into three research areas, (i) the efficiency of particular health care providers [6-8], for hospitals [9,10], for nursing homes [11], for physician practices), (ii) cross-country comparisons of health care systems [12-15], and (iii) regional variations of health care outcomes (for the cases of the US and Germany [16-21]. In light of the multidimensional nature of individual health and well-being, the regional level of analysis appears most suitable to unravel the determinants of HRQoL and of the uncertainty behind the evaluation of individual well-being, as well as to separate socio-demographic and health systemic effects for this purpose. Yet, the structural determinants of individual HRQoL and the uncertainty attached to the assessment of well-being have received surprisingly little attention in the related literature. Nevertheless, to improve quality of care and achieve ‘true’ cost-containment in the sense of Porter [3], it is essential to integrate the patient’s perspective in the analysis of the effectiveness of health care provision.
An improved understanding of the performance of health care services with high spatial resolution is particularly relevant for the case of Germany featuring strong regional variations in (i) quality of life, (ii) burdens of disease, and (iii) the availability of medical services and infrastructure. Against this background, we examine the determinants of individual HRQoL prevailing in Germany. While we account for individual characteristics, our main focus is on the effects of medical infrastructure and its utilisation by including regional information on medical service provision and demographic and socio-economic profiles. Our empirical model fits into the framework of the health production function of Grossman [22] which we quantify in terms of a Stochastic Frontier Analysis (SFA). As a particular merit of the modelling approach, our study provides new insights into the relationship of health systemic determinants and deviations from the health frontier and/or the uncertainty behind socalled SF-12 scores which have become a widely accepted tool for quantifying individual health outcomes [23]. The nonlinear SFA approach offers to capture the direct relationship of individual level variables such as health behaviour and individual HRQoL while at the same time indirectly measuring an effect of the availability of medical services on regional level on individual well-being through inefficiency as possible transmission channel. We combine individual-level panel data from the German Socio-Economic Panel (SOEP) with regional administrative information. In total, the data set consists of more than 45000 observations.
One might argue that the relationship between individual health and the availability of medical services is possibly ambiguous, as more health care infrastructure might be allocated to regions with poor overall health. This raises risks of biased estimation results due to reversed causality. We address the potentials of a bidirectional relationship of individual health and regional health systemic determinants within a preliminary analysis. By means of a Hausman-Test [24], we compare the estimation results of a Fixed Effects (FE) panel model and an Instrumental Variable (IV) estimation with heteroscedasticity-based instruments [25]. Based on the corresponding results, we conclude that potential endogeneity does not result in estimation biases.
To preview some results, we diagnose a positive effect of general outpatient care and average HRQoL. Overall, we find a strong connection between the regional misallocation of medical services, and an inferior performance of local health care systems which leads to weakened growth of or even reductions in HRQoL. Moreover, our findings reflect the supply-sensitivity of care meaning that physicians create their own demand based on the available services [26]. Furthermore, the results indicate that the uncertainty attached to the assessment of well-being differs according to the level of care. For instance, a higher supply of general outpatient services relates to a reduction in the uncertainty while an increase in the number of medical specialists likely leads to a rise in the uncertainty attached to individual HRQoL. Similar to results of related studies [16,27,28], regional deprivation is negatively associated with individuals’ well-being.
In the next section, we describe the stochastic health frontier model and introduce the data. A set of appendices provides a discussion of the spatial estimation strategy (Appendix A), a technical description of the density function of inefficiency and the moment conditions (Appendix B), a detailed description of the data (Appendix C), and a discussion of the parameter estimates attached to the individual characteristics (Appendix D).
Methodology
In this section, we provide the empirical strategy to assess the stochastic deviations from the health frontier. Furthermore, we describe the data and the determination of the variables.
The general SFA model of health production
SFA has become a common approach for modelling potentials and inefficiencies in various contexts, like the production of goods and services in economic entities (e.g., farms, firms, and hospitals). Unlike data envelopment approaches treating any deviation from a production function to result from inefficiency [29], the parametric SFA model allows to distinguish between inefficiency and random deviations from efficient service provision.
To evaluate how the allocation of medical infrastructure and regional demographic and socio-economic characteristics govern inefficiencies in the provision of individual HRQoL, we estimate a Grossman-type health production model [22]. We follow Wang [30] in the parametrisation of a one-step SFA model including exogenous influences on deviations from the health frontier. Quantifying the production function and deviations from the efficient technology simultaneously, one avoids eventually invalid conclusions based on two-step approaches which process estimated first-step efficiency scores [31-34].
The German health care system is characterised by free provider choice. Hence, spatial externalities (spillover effects) might play an important role in the provision and utilisation of health care services. As a result of patients migrating across regional borders, the efficiency of service provision in a given region might be influenced by the medical infrastructure in neighbouring regions. Supposing that regional health care services and the demographic and socio-economic environment influence the efficiency of health production, our pooled SFA model1 for HRQoL of individual i at time t and located in region j reads as

where
Moreover, conditional moments of uit are
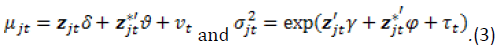
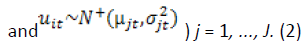
In (1), yit is the natural logarithm of HRQoL and xit is a K-dimensional vector of individual characteristics. In (2), we assume that inefficiency mainly arises from medical service provision and demographic and socio-economic characteristics at the regional level. Accordingly, zjt is a R-dimensional vector of region specific variables capturing the medical infrastructure as well as demographic and socio-economic factors for region j in time t. To account for patient mobility, we introduce a spatial structure in the distribution of the efficiency scores. We consider

where Zt is a J×R matrix of J regions and R covariates for a specific period t. Formalising the connectivity of regions, wj is a region specific weighting row vector of size J. The vector zjt∗ is a vector of the spatially lagged variables for region j at time t and represents a weighted average of the neighbouring regions. To determine the networking between regions, we define the spatial weights based on an exponential decay function [35]. By means of this approach and in contrast to other neighbourhood criteria, like nearest neighbours or distance thresholds with clear cut-off points, all regions are connected and the interactions between regions shrink with distance (Appendix A).
Stochastic deviations from the production frontier are captured by vit and assumed to be normally distributed with mean zero and variance ω2. As proposed by Wang [30] the inefficiency term uit follows a truncated-normal distribution with mean and variance depending on exogenous variables. By assumption, the inefficiencies are identically distributed per region (i.e. truncated normal with mean μjt and variance  ). The parameters κt, νt and τt denote fixed time effects. As a particular merit, the model specification in (1) to (3) allows non-monotonic covariate effects on deviations from the health frontier2. Moreover, the conditioning of the variance of inefficiency (2) on explanatory variables offers a structural view at the uncertainty attached to the assessment of well-being at the individual level. The model in (1)-(3) is estimated by means of maximum likelihood (ML) estimation.
Data and variables
Data are drawn from two sources: the SOEP (individual health data and other demographic and socio-economic characteristics) and the INKAR database (regional data). The SOEP [36] is a household panel study. Since 1984 the respondents answer an individual and a household questionnaire every year (for further information on the SOEP [37]. Since 2002 a batch of healthrelated questions has been included in the SOEP every second year, the ‘SF-12v2TM Health Survey’ (SF-12, Andersen et al. [38]). Additional information on health-related behaviour, e.g. smoking, is available since 2004. We only include individuals aged over 18 who participated in at least three waves. Overall, the data set consists of more than 45000 observations3 (Appendix C). We match the individual-level data with regional administrative data drawn from the INKAR database. Administered by the Federal Institute for Research on Building, Urban Affairs and Spatial Development4 the INKAR database provides infrastructure and other regional characteristics. We base the regional analysis on the so-called spatial planning units (‘Raumordnungsregionen’, ROR5).
Individual health-related quality of life
The SF-12 has become a widely used statistic to monitor health and measure HRQoL [18,23,39]. Based on twelve healthrelated questions classified into eight health concepts (e.g. physical functioning, pain, vitality, social functioning), the SF- 12 comprises two sub-scales (principal components) of physical (PCS) and mental health (MCS). Taking account of the complex nature of wellbeing by integrating several dimensions, the SF- 12 is more informative than self-reported health at ordinal Likert scales. As a further advantage in comparison with other health indicators, it also includes the mental dimension of well-being. Since objective measures of the health status (e.g., mortality) cannot adequately illustrate the burden of chronic diseases, subjective measures like the SF-12 have become increasingly important to measure HRQoL [38]. Similar to Eibich and Ziebarth [18], we take the average of the two sub-scales PCS and MCS to obtain an indicator of HRQoL. By construction, this average ranges between 0 and 100 with mean 50 and standard deviation 7 (Table 1). Figure 1 displays the regional distribution of the weighted average of the SF-126. A visual inspection reveals regional clustering. HRQoL does not substantially differ between East and West Germany as other health outcomes, like mortality figures typically do [40,41].
| Variable | Mean | SD | Between SD | Within SD | |
|---|---|---|---|---|---|
| Health outcome sf12 | 47.94 | 7.271 | 6.228 | 3.812 | |
| Individual characteristics (xit) | |||||
| Health-related behaviour | |||||
| bmi | 26.60 | 4.763 | 4.545 | 1.370 | |
| smoking | 0.25 | 0.432 | 0.391 | 0.182 | |
| healthy diet | 0.56 | 0.497 | 0.385 | 0.318 | |
| Health care utilisation | |||||
| hospital _stay | 0.17 | 0.374 | 0.214 | 0.305 | |
| doctor_visit | 3.62 | 4.185 | 2.792 | 3.094 | |
| private_health_insurance | 0.14 | 0.342 | 0.333 | 0.087 | |
| Demographic factors | |||||
| age | 55.12 | 16.085 | 16.093 | 2.999 | |
| male | 0.43 | 0.495 | 0.495 | 0.000 | |
| nationality | 0.05 | 0.214 | 0.210 | 0.037 | |
| married | 0.67 | 0.470 | 0.439 | 0.176 | |
| Socio-economic factors | |||||
| income | 1835.65 | 1096.470 | 998.643 | 462.123 | |
| not_employed | 0.50 | 0.500 | 0.444 | 0.232 | |
| part_time | 0.17 | 0.371 | 0.305 | 0.213 | |
| full_time | 0.33 | 0.470 | 0.422 | 0.215 | |
| training | 0.01 | 0.086 | 0.058 | 0.067 | |
| edu1 | 0.13 | 0.335 | 0.334 | 0.057 | |
| edu2 | 0.50 | 0.500 | 0.490 | 0.095 | |
| edu3 | 0.13 | 0.338 | 0.332 | 0.065 | |
| edu4 | 0.24 | 0.425 | 0.418 | 0.068 | |
| Regional variables (zjt) | |||||
| Medical infrastructure | |||||
| gp | 50.88 | 6.839 | 6.438 | 2.384 | |
| spec | 108.42 | 25.953 | 24.732 | 8.197 | |
| beds | 61.37 | 10.860 | 10.531 | 2.828 | |
| Demographic and socio-economic characteristics | |||||
| gdpp.c. | 28.91 | 7.609 | 7.070 | 2.888 | |
| education | 28.14 | 7.719 | 5.630 | 5.307 | |
| age65 | 20.46 | 1.950 | 1.706 | 0.958 | |
| female | 50.90 | 0.408 | 0.390 | 0.123 | |
| unemployment | 8.38 | 4.150 | 3.613 | 2.069 | |
Table 1. Descriptive statistics. The table documents descriptive statistics for 11082 individuals observed every other year from 2004 to 2014 in the upper panel (45054 observations), and for the 96 regions in the lower panel (576 observations). The second and third column document the pooled sample means and the unbiased pooled standard deviations, respectively. The last two columns show between and within standard deviations.

Figure 1. Spatial distribution of the weighted averages of the variable SF-12.
Individual characteristics
We base the choice of explanatory variables for the conditioning of HRQoL largely on the related literature [18,42], and distinguish four groups of variables that refer to health-related behaviour, health care utilisation and demographic and socioeconomic characteristics. Collecting indicators of healthrelated behaviour the first group includes the Body-Mass-Index (BMI)7 and two dummy variables indicating if a person smokes (smoking) or follows a health conscious diet (healthy diet). A mean BMI of 26.6 indicates that the German population has a tendency towards being overweight (Table 1). About 25% of the observed individual smoke, while more than 55% consider themselves to follow a healthy diet.
The second group of variables contains information on health care utilisation. The dummy variable hospital stay indicates if a person stayed in hospital in the previous year. We also include the number of doctor visits (doctor visits) during the three months previous to the interviews. A dummy variable which takes a value of unity if the person is privately insured (private health insurance) controls for the health insurance status8. Table-1 shows that 16.5% of the observed individuals stayed in hospital in the previous year and saw a physician about three to four times during the three months previous to the interview. Approximately 13% of the sampled individuals are privately insured such that members of private health insurances are slightly over represented [43].
The third group of variables consists of demographic factors. We consider age (age) in a continuous manner both in level and in quadratic terms. Further dummy variables account for gender (male=1 if the person is male), nationality (nationality=1 if the person has a nationality other than German) and marital status (married=1 if a person is married). The mean age in our sample is 55.12 years. About 40% of the observed individuals are male while 5% of the sample have a nationality other than German. A considerable fraction (67%) of sampled individuals are married.
The fourth group of variables captures the socio-economic status of an individual. In particular, it contains household income (income)9. Similar to the ‘German Mikrozensus’, we distinguish four groups of educational achievements. The first category (edu1) refers to individuals with an educational achievement of up to lower secondary level (ISCED10). The second category (edu2) contains all individuals with upper secondary education. The third category (edu3) comprises all individuals with vocational training and bachelor degree. Category 4 (edu4) consists of individuals with (higher) academic degrees (master degree, PhD or equivalent). Moreover, we account for an individual’s labour market status by means of four dummy variables. The first category (not employed) includes all persons that are not employed. The second and third category cover individuals working part-time (part time) and full-time (full time), respectively. The last category (training) includes all individuals either in vocational training, (voluntary) military or community service.
Regional characteristics
To explain how the availability and allocation of medical services shapes the performance of regional health care services, we include regional information on medical service provision. A regional level analysis is of particular relevance as the provision of health care services is decided at regional levels. Further, empirical evidence for Germany [18,44] suggests that potential sources of inefficiency are located at regional levels. Attributes of the health care infrastructure include the number of general practitioners (gp) and medical specialists (specialists) per 100,000 inhabitants and the number of hospital beds (beds) per 10,000 inhabitants. Figure 2 displays the regional distribution of the medical infrastructure. All graphs indicate regional clustering. The figure further displays a North-South gradient for general practitioners with higher densities in the South of Germany. Pointing to a rural-urban divide the graph reveals high densities of medical specialists in four major cities (for instance Berlin, Hamburg, Bremen and the area surrounding Munich).
Figure 2. Spatial distribution of the medical infrastructure.
As health is not only related to the health care system [45] and to refine the understanding of the underlying determinants of HRQoL, we also include regional information on demographic and socio-economic factors in the analysis [18,27]. Specifically, this group of explanatory variables consists of the gross domestic product (GDP) per capita (gdpp.c.), the share of school graduates with matriculation standard (‘Hochschulreife’) among all school graduates (education), the unemployment rate (unemployment) and the share of population older than 65 years (age 65).
The efficiency of regional health provision
In the following we discuss diagnostic and inferential results for the SFA model. Firstly, we consider the data based model selection. Secondly, we examine the regional variation of the performance of health care services. Thirdly, we discuss the extent to which the regional allocation of medical infrastructure and demographic and socio-economic characteristics shape the regional variation in the provision of health care services channelling into HRQoL divergence. If not mentioned otherwise, the discussion of estimation results refers to the nominal 5% significance level.
Model selection
As Greene (2008) points out there is no theoretical guidance for the positioning of additional covariate information (the z-variables) in the production function (1) or in the inefficiency term (3). Similar to Herwartz and Schley [44] we use a Vuong test [46] to determine a benchmark model specification. Accordingly, we compare alternative model specifications with distinct positionings of the regional characteristics, gp, specialists, beds, gdpp.c, education, unemployment and age 6511. The test results are conclusive for the positioning of the variables gp, gdpp.c. and unemployment. For the other variables we select a most appropriate model specification by means of log-likelihood statistics. As a result of the model selection process, the medical infrastructure and the other indicators of regional heterogeneity are included in the specification of inefficiency in (3).
Interaction of HRQoL and the availability of medical services
One might argue that the relationship between the availability of medical services and the population well-being is potentially bidirectional. For example, physicians might sort into areas with an higher share of privately insured individuals which have a better health status. Similarly, regulators might allocate more resources to areas with less favourable health outcomes. Consequently, the regression results might suffer from endogeneity bias due to reversed causality. Pointing against such effects, however, it is noteworthy that the German health care sector is a highly regulated market which does not offer free access for physicians. Rather, the supply of health care infrastructure is externally determined by structural planning based on allocation formulas [47]. For example, the spatial planning of hospital beds is based on the so-called Hill-Burton-Formula which only implicitly takes morbidity into account. Additionally, it is noteworthy that we combine data on individual HRQoL with regional level administrative data on health care infrastructure which likely weakens potential endogeneity.
To further rule out the potential of regression biases, we test for endogeneity by means of a Hausman test. For this purpose, we condition individual HRQoL on individual health-related behaviour, the demographic, and socio-economic status and on regional-level information on the availability of medical services and socio-economic profiles. We estimate both a fixed effects (FE) and an instrumental variable (IV) panel model. In the IV regression, we treat three regional-level variables as possibly endogenous, in particular gp, specialists, and beds. The population density is a potential instrument which is not correlated with the dependent variable while it represents in some way structural planning activities. However, with three potentially endogenous variables and only one instrument, a general IV model is underidentified. Accordingly, we exploit the informational content of heteroscedasticity-based instrumental variables [25], proposes an instrumental variable estimation which does not rely on external instruments. As Lewbel [25] argues, the efficiency of the IV estimation increases by including additional external instruments. Accordingly, we additionally include the population density as external instrument in the IV regression. Under the null hypothesis of the Hausman test, the differences in the coefficients between FE and IV regression are not systematic. Under the null hypothesis, the coefficients of both models are consistent while the FE-estimator is efficient. We conclude that our conditional model is sufficiently well specified based on a p-value of 0.8598. As it turns out from this exercise, potential endogeneity is unlikely to govern estimation biases in the documented results.
Table 2 documents the estimation result of the FE and IV model. The estimated coefficients of the individual level variables of both models are quite similar and have the expected sign except for the coefficient of age which lacks statistical significance. Potential multicollinearity might explain that the regional level variables lack statistical significance. This motivates the SFA approach taken in this study as it measures a direct effect of individual health behaviour on individual HRQoL while simultaneously assessing an indirect effect of the availability of health care services via inefficiency as transmission channel.
| Health-related quality of life (SF-12) | ||
| FE | IV | |
| Individual characteristics | ||
| Intercept | -2.663(-1.59) | - |
| bmi | -0.039 (-2.61) | -.037 (-2.53) |
| hospital stay | -1.055 (-16.16) | -1.056(16.17) |
| doctor visit | -.282 (-44.00) | -.282(-43.99) |
| age | 0.008 (0.25) | -.006 (-0.12) |
| age2 | -0.002 (-10.71) | -.002(-10.67) |
| ln(income) | 0.427 (4.19) | 0.413 ( 4.03) |
| Regional variables | ||
| gp | -0.018 (-1.17) | -.076 (-1.21) |
| specialists | -0.005 (-1.19) | -.028 (-2.03) |
| beds | 0.012 (1.78) | .027 (1.26) |
| ln(gdpp.c.) | 0.791 (1.59) | 2.260 (2.24) |
| education | -0.001 (-0.22) | 0.002 (0.30) |
| age65 | 0.065 (-1.52) | 0.037 (0.81) |
| unemployment | -0.0007 (-1.59) | 0.0009 (0.04) |
Table 2: Linear FE and IV regression (t-ratios in parentheses). All variables were within-transformed prior to estimation. The IV regression is based on a heteroscedasticity-based instrumental variable estimation (Lewbel, 2012).
Medical infrastructure and the inefficiency of regional service provision
While we condition HRQoL on individual characteristics and health-related behaviour, our main focus is the role of the regional allocation of medical infrastructure and the utilisation of medical services. Our results for the parameter estimates attached to the individual-level variables (Appendix D and Table 6) largely resemble those found in the related literature [24,48-50]12. Noticing that the model accounts for individual determinants of HRQoL with reasonable estimation results, the following discussion provides a complementary perspective on the determinants of HRQoL with a focus on health care service provision and utilisation. Firstly, we examine the regional patterns of health care performance. Secondly, we highlight the model implied relationships between systemic characteristics of health care in Germany and deviations from the health frontier13. As a particular merit of the modelling strategy, we accentuate in this context the role of system characteristics in shaping the uncertainty behind self assessments of HRQoL. Thirdly, we investigate the regional variation of the performance of health care services.
Regional patterns of health care efficiency
To get a first insight into the performance of regional health care systems and regional variation in HRQoL Figure 3 shows the distribution of the (sample weighted) mean estimated efficiency scores14. Apparently, in terms of HRQoL German regions do not perform at their full potential. The average efficiency level is 0.86 with a minimum of 0.76 and a maximum of 0.90. An eyeball inspection of Figure 3 reveals regional clustering of efficiency scores.

Figure 3. Spatial distribution for the average estimated technical efficiency scores implied by Model VI.
Marginal effects on expected HRQoL and the uncertainty of individual well-being
By quantifying both mean and variance of the distribution of inefficiency the applied frontier model allows to detect possible determinants of expected HRQoL as well as uncertainty inherent in the individual assessment of well-being. In particular, we can emphasize nonmonotonic and non-linear relationships between the medical infrastructure and HRQoL. For this purpose, we calculate the individual marginal effects (7-8) (Appendix B). Subsequently, the regional (sample weighted) average marginal effects are classified and sorted by each variable into five groups. In this context, we firstly discuss the relationship between HRQoL and regional demographic and socio-economic characteristics. Secondly, we focus on the relationship between the medical infrastructure and HRQoL and the uncertainty attached to the individual evaluation of well-being. We compare intermediate estimation results systematically across categories by means of Analysis of Variance (ANOVA) techniques (Table3).
| Quintile | Mean of | Average | Marginal effect | Mean of | Average | Marginal effect | ||||
|---|---|---|---|---|---|---|---|---|---|---|
| variable | efficiency | on E(uit) | on Var(uit) | variable | efficiency | on E(uit) | on Var(uit) | |||
| Medical infrastructure | ||||||||||
| gp | gp* | |||||||||
| 1st | 41.56 | .8536 | -.0402 | -.0061 | 41.56 | .8536 | .2201 | .0334 | ||
| 3rd | 50.66 | .8552 | -.0386 | -.0059 | 50.66 | .8552 | .2111 | .0319 | ||
| 5th | 60.80 | .8586 | -.0352* | -.0056* | 60.80 | .8586 | .1916* | .0304* | ||
| spec | spec* | |||||||||
| 1st | 80.52 | .8598 | -.0118 | .0029 | 80.52 | .8598 | .0457 | .0085 | ||
| 3rd | 104.18 | .8543 | .0085* | .0059* | 104.18 | .8543 | .0451 | .0089* | ||
| 5th | 149.55 | .8608 | .0300* | .0092* | 149.55 | .8608 | .0433* | .0089* | ||
| beds | beds* | |||||||||
| 1st | 46.10 | .8531 | .0086 | .0022 | 46.10 | .8531 | .1010 | .0170 | ||
| 3y | 62.51 | .8563 | .0083 | .0022 | 62.51 | .8563 | .1051 | .0174 | ||
| 5y | 76.00 | .8507 | .0092 | .0024* | 76.00 | .8507 | .1014 | .0176 | ||
| Demographic and socio-economic characteristics | ||||||||||
| gdpp.c. | age65 | |||||||||
| 1y | 20.11 | .8507 | -.0271 | -.0067 | 18.05 | .8639 | -.0042 | -.0010 | ||
| 3y | 27.74 | .8600 | -.0366* | -.0084* | 20.34 | .8554 | -.0031* | -.0008* | ||
| 5y | 40.69 | .8572 | -.0359* | -.0080* | 23.41 | .8503 | -.0017* | -.0006* | ||
| education | unemployment | |||||||||
| 1y | 18.61 | .8563 | -.0012 | -.0003 | 3.89 | .8513 | .0013 | .0002 | ||
| 3y | 27.30 | .8589 | -.0010* | -.0003* | 7.65 | .8613 | .0012* | .0001* | ||
| 5y | 39.88 | .8554 | -.0005* | -.0002* | 15.13 | .8513 | .0023* | .0003* | ||
Table 3. Marginal effects on inefficiency. The table reports the marginal effects for the z-variables for Model VI. The data is sorted and classified into five groups by each z-variable. We classify the marginal effects of the spatially lagged variables by the level of the corresponding variable of the region. For the lowest, middle, and highest groups, the second and sixth columns report the mean of the respective variable, the third and sevenths columns show the average technical efficiency while the fourth, fifth, eighths and ninths columns report the marginal effect on E(uit) and V (uit), respectively. We test for significance in the mean effects of the classified regions with respect to the regions in the lowest quintile. The stars indicate 5% nominal significance.
HRQoL and regional diversity regarding the role of demographic and socio-economic regional characteristics and the deviations from the health frontier, the marginal effects assess how a change in the in the regional diversity relates, on average, to a change in the efficiency and performance of the health care provision. This can directly be translated into an average change in HRQoL at the individual level15. We diagnose a negative relationship between the performance of health care services and regional deprivation. Accordingly, higher regional per capita income (gdpp.c.) increases HRQoL. Low income families seem more likely confronted with access barriers to medical services [51,52]. Similarly, a larger proportion of graduates with matriculation standard (education) leads to an improved well-being. This result is intuitively appealing, since superior educational achievements are generally associated with an intensified utilisation of preventive care [53] and a strengthened awareness of medical treatments. Moreover, we diagnose a negative relationship between unemployment (unemployment) and HRQoL. On the one hand, this could possibly reflect a lower utilisation of medical services due to potential access barriers of the unemployed. On the other hand, unemployment is associated with economic hardship which might lead to reduced spending on health care and stronger burdens of disease [18,27,54-56]. Somewhat surprisingly, a larger share of the elderly (age 64) appears related with an improved performance of health care services in terms of HRQoL. Similar to our results, Eibich and Ziebarth [57] diagnose a direct positive association between the share of the elderly and the SF-12 for the German districts. They explain their result by the availability of possibly better health care resources in districts with a high share of the elderly and by the longevity of the population in general.
HRQoL and the medical infrastructure regarding the role of health systemic characteristics in explaining HRQoL, we diagnose a non-monotonic relationship between medical specialists (spec) and individual well-being. For example, in regions with a relatively low supply of specialists an increase of services translates into average improvements of HRQoL of 1.2%. In regions with medium and relatively high supply an expansion in the provision of medical specialists indicates potential HRQoL losses of 0.9% and 3%, respectively. This might hint at a potential oversupply of specialized care. The supply of specialized medical services in neighbouring regions (spec∗) shows adverse effects on local health outcomes. Hence, a sufficient local supply of specialized outpatient care seems advantageous for the efficient provision of health care services and results in an improved HRQoL especially in regions with a relatively low supply of specialized physicians.
Similar to the case of specialized health care, the marginal effects of an increased provision of general care (gp) appear nonlinear with stronger improvements of HRQoL in regions with a relatively low supply of general medical services and smaller gains in areas with a relatively high supply. The marginal benefits in HRQoL are about 4.0%, 3.8%, and 3.5% for the regions with lowest, middle and highest density of general practitioners, respectively. The effect difference between the result for regions with lowest and medium density lacks significance, however. Medical services provided in neighbouring regions are associated with weakened performance of local health care services. Furthermore, the number of hospital beds (beds) has a negative effect on HRQoL. Similar to the results for medical specialists the size of the effect increases with the number of hospital beds. The differences in the mean effects, however, lack statistical significance.
Seeing that marginal effects of medical service provision depend in a non-monotonic manner on the medical infrastructure is generally in line with the notion of supply-sensitive care, stating that the utilisation of medical resources mainly reflects their supply [58]. In other words, physicians are supposed to create their own demand based on the available resources [26]. As an implication, more health care services and/or expenditures do not necessarily lead to improvements of HRQoL [58,59]17.
The uncertainty of HRQoL Besides promoting health, health care systems could support patients by targeting the uncertainty attached to medical decision making. Uncertainty about individual HRQoL possibly results in an over-use of costly services and redundant medical treatments (McNeil, 2001). From a patients perspective, a reduction in the uncertainty of medical decision making would possibly reduce the level of stress emerging from unsettled times of illness [60-68] translating into an improvement of HRQoL. Our results offer new insights into the determinants of uncertainty. We find that the uncertainty attached to the evaluation of well-being differs according to the existing supply of medical services similar to the marginal effects on expected HRQoL. In particular, a growing supply of general medical outpatient services likely decreases the variation of HRQoL. The possible reduction in the variation of HRQoL in regions with a low supply is more pronounced as opposed to regions with a relatively high level of services. This further highlights possible positive effects of a sufficient local supply of general outpatient care [69-75]. In contrast to this, a higher supply of medical specialists increases on average the uncertainty in the assessment of well-being. This relationship is less pronounced in regions with a relatively low level of specialized care which implies a potential oversupply of specialized medical services in some regions.
In particular, a lack of coordination between service providers likely raises the uncertainty of medical decision making of patients [76-89]. Further, the direct access to medical specialists possibly increases the uncertainty attached to the considerations of treatment options. This is especially relevant for regions with a high level of supply as low access barriers to medical care facilitate the utilisation of services.
Second-stage results of marginal effects and efficiency levels
Medical service provision and utilisation in East and West Germany To gain further insights into the relationship between medical infrastructure and HRQoL, we classify the German regions according to morbidity profiles3. Subsequently, we analyse differences in the marginal effects.
In Table 4, we compare the marginal effects in West German regions with a high morbidity profile with regions in West Germany with a low morbidity profile and regions in East Germany18. Interestingly, we do not find significant differences between the average marginal effects in West Germany. This result potentially suggests that regional patterns in the provision and utilisation of medical services do not sufficiently explain morbidity differentials in West German regions. Accordingly, we concentrate the subsequent discussion on the differences between East and West German regions with a high morbidity profile. For general outpatient care, a higher level of medical services translates into a potential average HRQoL improvement of 5.7% in Eastern and 3.3% in Western regions. Furthermore, regions in East Germany would likely benefit from a higher supply of specialized care (average benefit in HRQoL of 3.8%) while the opposite holds for the regions in West Germany. On the one hand, this hints at a potential misallocation of the medical infrastructure. On the other hand, the more pronounced beneficiary effects on efficiency and HRQoL in Eastern regions indicate that East Germany benefited from structural investments in health care infrastructure leading to a more efficient service provision [40]. The medical infrastructure in the neighbouring regions relates to higher potential output losses in East Germany. This finding additionally emphasizes the importance of a reallocation of medical services especially for the case of regions in Eastern Germany.
| Variable | Marginal effect on E(uit) | Marginal effect on Var(uit) | ||||
|---|---|---|---|---|---|---|
| West East | West East | |||||
| high | low | high | low | |||
| Medical infrastructure | ||||||
| ln(gp) | -.0329 | -.0328 | -.0572* | -.0053 | -.0052 | -.0080* |
| ln(specialists) | .0187 | .0178 | -.0376* | .0073 | .0071 | -.0001* |
| ln(beds) | .0105 | .0103 | .0041* | .0026 | .0025 | .0016* |
| ln(gp*) | .1789 | .1782 | .3147* | .0289 | 0.0283 | .0440* |
| ln(specialists*) | .0444 | .0439 | .0488* | .0090 | .0087* | .0090 |
| ln(beds*) | .0912 | .0906 | .1347* | .0163 | .0160 | .0207* |
| Demographic and socio-economic characteristics | ||||||
| ln(gdpp.c.) | -.0370 | -.0364 | -.0245* | -.0085 | -.0082 | -.0064* |
| education | -.0011 | -.0011 | -.0002* | -.0003 | -.0003 | -.0002* |
| age65 | -.0038 | -.0037 | -.0010* | -.0010 | -.0009 | -.0005* |
| unemployment | .0011 | .0012 | .0026* | .0001 | .0001 | .0003* |
Table 4. Average marginal effects on inefficiency according to morbidity profiles. The second and third columns show the average marginal effects on E(uit) for the West German regions with high and low morbidity profiles, respectively. The fourth column reports the average marginal effects for the East German regions (all regions have a morbidity profile above the German average). The three rightmost columns document the average marginal effects on V (uit) for regions in West (high and low mortality) and East Germany, respectively. We test for significance in the mean of the groups with respect to the West German districts with high morbidity. The stars indicate 5 % nominal significance.
With respect to regional deprivation, we find smaller potential benefits of higher income and better education in Eastern regions. Moreover, the relationship between unemployment and HRQoL is more pronounced in East Germany. These results highlight differences in the utilisation patterns between East and West Germany still prevailing almost three decades after the German reunification.
Conclusion
Health care systems around the world face growing financial pressures to satisfy the demands of an ageing population with a rise in the burden of chronic diseases. Nowadays, health care expenditures grow faster than GDP in most developed economies.
To meet financial pressures service providers need to handle more cases while the budgets remain largely stable. Under the notion of value-based care, the health care literature has intensively discussed possible solutions to cost-containment including the improvement of quality of care. The regional reorganisation of medical infrastructure is an important means to promote the performance of health care service provision translating into enhanced HRQoL.
We analyse how the availability of health care services shapes HRQoL for the case of German regions by means of a health production function approach. For a model including spatial health care utilisation patterns, the estimation results unravel a positive relationship between general outpatient care and HRQoL. Nevertheless, regional misallocation of medical services in general leads to a potential reduction of individual well-being. Pointing at supply-sensitive care in Germany, the relationship between the provision of medical services and HRQoL seems to be sensitive to the level of the local supply. For instance, the beneficial effects of medical care on HRQoL are more pronounced in areas with a low supply of medical services. Both regional utilisation patterns of and the access to health care services influence HRQoL. In particular, regional deprivation negatively affects HRQoL. Furthermore, we find that the uncertainty attached to the evaluation of HRQoL at the individual level differs according to the level of care. For instance, a higher supply of general practitioners reduces the uncertainty while a higher number of medical specialists increase it.
Out findings have several important policy implications: First, to improve the performance of regional health care services in Germany and to reduce inefficiencies, the resource allocation of medical infrastructure should take account of the supplysensitivity of medical care. Second, taking patient mobility across regional borders into account, our results highlight the importance of a sufficient local supply of general outpatient care. In this context, strategies to promote the utilisation of local general medical services could improve the performance