Research Article - Biomedical Research (2016) Health Science and Bio Convergence Technology: Edition-I
Importance of the shape and orientation of the spine and pelvis for the vertebral column pathologies diagnosis with using machine learning methods
Selahaddin Batuhan Akben*Osmaniye Korkut Ata University, Bahce Vocational School, Osmaniye, Turkey
- *Corresponding Author:
- Selahaddin Batuhan Akben
Osmaniye Korkut Ata University
Bahce Vocational School
Turkey
Accepted date: July 19, 2016
Abstract
Disc-hernia and spondylolisthesis are the major disorders related to vertebral column. Expert medical doctors examine the pelvis and lumbar spine shape and orientation to diagnose the disorder. However some shape and orientation parameters may be misleading and are unclear. Therefore recently the automatic diagnosis methods (classification methods) have been proposed to help medical doctors. However the proposed results may be misleading, since are triple-classification results. Hence the automatic diagnosis of each disorder should be tested separately also. Moreover, the medical doctor need is determination of more useful parameters rather than the automatic diagnosis proposals. In this study, which parameters should be used to diagnose which disorder, was determined for more informative automatic diagnosis proposal. According to the findings, success rate of the classification of healthyspondylolisthesis and herniated-spondylolisthesis are high (about 97% for healthy-spondylolisthesis and about 98% for hernia-spondylolisthesis classification) but the same result cannot be determined for hernia-healthy classification. Also the most important parameter for the Spondylolisthesis classification is grade of spondylolisthesis (GS).
Keywords
Vertebral column pathologies, Disc hernia, Spondylolisthesis, Automatic diagnosis, Classification, Machine learning.
Introduction
The vertebral column is an important part of the axial skeleton and comprises of many parts. These parts are inter-vertebral discs, nerves, muscles, medulla, and a group of vertebras (each bone of spine). Human body support, medulla spinals and nerve center protection and body movement facilitation are main functions of vertebral column [1,2]. Anatomic or life condition related several reasons can cause vertebral column disorders with very different intensities [3]. Major vertebral column disorders (pathologies) are disc herniation and spondylolisthesis [4]. In case of disc hernia the inter-vertebral discs slip out from their places and compress the nerves, so it causes the pain [5]. In case of spondylolisthesis, vertebra is forward displaced (forward slippage of vertebra) and the bones start to press on nerves [6]. Disc hernia and spondylolisthesis can be seen in Figure 1 and Figure 2 [7].

Figure 1: Structure of normal and herniated disc in vertebral column.

Figure 2: Structure of normal and spondylolisthesis vertebral column.
Vertebral column pathologies are mostly occurred in the lumbar and can be detected using MRI or other radiology images. Expert medical doctors often visually examine the sagittal and axial MRI images to diagnose disorder [8]. However visual examination of the axial or the sagittal images may not be sufficient (Especially for spondylolisthesis). Therefore the shape and orientation of the pelvis and lumbar spine are also examined in detail to make a precise diagnosis. In the shape and orientation evaluation stage, the pelvic incidence, pelvic tilt, lumbar lordosis angle, sacral slope, pelvic radius and grade of spondylolisthesis are examined [9]. If these parameters (values) are in normal range the expert medical doctors can diagnose the disorders.
Although these parameters are often sufficient for precise diagnosis of the expert medical doctors, sometimes it might be exceptions [10]. Recently, some computer-aided automatic detection methods have been proposed to resolve this problem (to assist the medical doctors) [11-16]. But all of these previous methods are intended to distinguish between the normal, hernia and spondylolisthesis in the same classification process. However, priority need of medical doctors is to determine the more effective parameter should be used during the disorder diagnosis. Moreover, these parameters may not be sufficient for the diagnosis of both disorders. Therefore classification should be made separately for each disorder.
In conclusion, in this study, classification performances were measured to evaluate the single and multiple uses of parameters. Moreover, classification was performed separately for the normal-hernia, normal-spondylolisthesis, herniaspondylolisthesis and normal-hernia-spondylolisthesis. Thus, which parameters should be used to diagnose which disorder, was determined. As a result, the parameters should be used in the diagnostic stage has been proposed with the aim to help the expert medical doctors. Furthermore, for the diagnosis of a disorder (Hernia, spondylolisthesis or both) whether shape and orientation parameters are sufficient or not were proposed.
Materials
In this study the publicly available vertebral dataset taken from the UCI machine learning repository was used because it contains the necessary diagnostic parameters and to compare with previous studies results (This data set was also used often in the proposed computer-aided automatic diagnostic methods in previous studies) [17]. This dataset includes 100 healthy subjects, 60 disk hernia disorders and 150 spondylolisthesis disorders. Each subject (healthy or disorder) data consist of six measurement values (attributes). Attributes are: Pelvic incidence, pelvic tilt, lumbar lordosis angle, sacral slope, pelvic radius and grade of spondylolisthesis. These attributes are six different biomechanical feature vectors used to diagnosis of vertebral column pathologies by expert medical doctors. The dataset used in this study can also be seen in Table 1.
| No | Attribute Name | Mean Value | STD | Normal Range |
|---|---|---|---|---|
| 1 | Pelvic Incidence (PI) | 60.50 | 17.24 | 51.80±12.36 |
| 2 | Pelvic Tilt (PT) | 17.54 | 10.00 | 12.92±6.81 |
| 3 | Lumbar Lordosis Angle (LLA) | 51.93 | 18.55 | 43.50±12.30 |
| 4 | Sacral Slope (SS) | 42.95 | 13.42 | 38.88±9.58 |
| 5 | Pelvic Radius (PR) | 117.92 | 13.32 | 123.64±9.31 |
| 6 | Grade of Spondylolisthesis (GS) | 26.30 | 37.56 | 21.6±6.28 |
Table 1: Structure of used dataset.
Methods
In this study, proposed classifiers for the same dataset used in the previous study were tested for comparison. Thus, the most appropriate and successful classifier was selected and used for analyses. Tested classifiers are K-Nearest Neighbor, Support Vector Machines, Decision Tree, Multi-Layer Perceptron and Naïve Bayes.
Naïve Bayes is well-known and most used classifier in data mining problems. Naive Bayes aims to determine the class of the data presented to the system with the probability algorithms. Probability algorithms are based on the Bayes rule. Its main advantages are the feasibility and performance. Also, it is the well-known and mostly used classifier of machine learning problems. Naive Bayes algorithm can be expressed as: Where P (Ci) is the poster priority of Ci. [18].
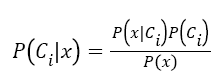 →(1)
→(1)
In K-Nearest Neighbor (KNN) classification, training and test sets are identified first. Elements of the test sets are classified according to their proximity to the training set. So a test element is made member to its closest training set. During this process, proximity is measured only between the test element and neighbor elements of the training set to itself. During the identification process of test element, proximity is measured only between the test element and neighbor elements of the training set to itself. Also the number of neighbors providing maximum classifier success has been selected. In this study, all distance measures have been tried and the most successful (Euclidian distance) was selected and used [19].
In Support Vector Machines (SVM) classification, largest gap between the groups of training set was identified first. Then the separator-line that to be divided the gap into two is determined. Finally, the test element is assigned as member to a training set group on the same side of the line. If there are more than two groups the separator line is drawn according to the largest gap between the groups [20].
Artificial neural network (ANN) is a model inspired by biological neural networks. Artificial neural network consist of processing units called neurons, nodes, processing units or cells as in biological neural networks. Aim of ANN is to create optimum system for the further inputs according to the desired outputs and inputs. For this aim inputs are weighted so that the most appropriate. In this study, network was created with two layers. Since many activation functions were tested but sigmoid function has been gave the best accuracy, the sigmoid function was used [21].
In decision tree method, instances are classified as in from root to leaf nodes of tree. Process logic of the method is: if attribute 1, attribute 2, ..... then the outcome. Decision tree method also determines the limit values of the classes besides the classification. In this method, the number of nodes is determined according to need or dendrogram graph [22].
In the classification stage, Cross-Validation (CV) technique was also used for assessing the results to be generalized to an independent data set. Thus predictive model will perform in practice was more accurately estimated [23]. According to CV method, data used as training is 90% in each cycle and the data used as testing is 10% in each cycle. Total of 10 cycles were used and thus each of subjects was used as both training and testing.
Furthermore ROC (Receiver Operating Characteristic) was used to measure the accuracy [24]. According to the ROC method, the accuracy parameter shows the predictive capability of a classifier as percentage. Accuracy of classifier can be computed by:
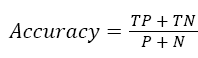 →(2)
→(2)
is the number of correct classified positives, is the number of correct classified negatives, is the number of positives and is the number of negatives. While the negative is the known labels of a class the positive is the known labels of other class. If the determined label of a class is same with known label of same class it means true negative. Meanwhile if the determined label of other class is same with known label of this other class it means true positive.
Results and Discussion
In the study, the most successful classifier that can classify the data set was selected first. For this purpose, the data set was classified using various classifiers. Then the results obtained were compared. Classifier results can be seen in Table 2.
| Classifiers | Accuracy Rate (%) |
|---|---|
| KNN | 78.39 |
| SVM | 81.61 |
| Decision Tree | 77.23 |
| Naïve Bayes | 83.87 |
| MLP | 83.22 |
Table 2: Classifier results for triple-class.
As seen in Table 2 the most successful classifier is Naïve Bayes. Therefore Naive Bayes classifier was used to detailed analyses in this study. In the first stage of the analyses, all data (dataset consisting of healthy, hernia and spondylolisthesis) were divided into three classes (healthy, hernia and spondylolisthesis) in a single classification process. Thus, subjects were identified as belonging to which class according to measured parameters. The results were also evaluated according to single or together use of the attributes. In this way, during the classification of dataset in a single classification process, combination of attributes that should be used was also determined. Results can be seen in Table 3. In Table 3, only the most successful combination of each combination types was written.
| Combination Type | Attribute combinations Supplying maximum performance |
Accuracy (%) |
|---|---|---|
| Using single attribute | Using only PI | 61.29 |
| Using only PT | 51.61 | |
| Using only LLA | 63.23 | |
| Using only SS | 62.26 | |
| Using only PR | 54.84 | |
| Using only GS | 78.06 | |
| Using two attributes together | Using SS and GS or PR and GS | 80.32 |
| Using three attributes together | Using SS, PR and GS | 84.52 |
| Using four attributes together | Using LLA, SS, PR and GS | 84.12 |
| Using five attributes together | Using PT, LLA, SS, PR and GS | 84.12 |
| Using all attributes together | Using PI, PT, LLA, SS, PR and GS | 83.87 |
Table 3: The classification of the all data.
As seen in Table 3, classification success of the three or more attributes use is much more than the classification success of single attribute use. Also, this result means that the success rate of the healthy-disorder classification will be about 84.5% using the three or more attribute. However, this result is misleading about the success of diagnosis of a disorder since the number of subjects groups is not equal. So, a disorder that the classification success rate (performance) and the number of subject are very high is caused to high overall classification success rate. In this study, it should be noted that the number of spondylolisthesis subjects is 2.5 times more than the number of hernia subjects. So, the high classification success rate of spondylolisthesis (Accuracy rate of spondylolisthesis) may be caused to think the misleading high classification success rate for hernia (Accuracy rate of hernia). Therefore, it is necessary to evaluate the classification success of the healthy-hernia and healthy-spondylolisthesis one by one. Healthy-hernia classification results can be seen in Table 4. Healthyspondylolisthesis classification results can be seen in Table 5. As in the Table 3, in Table 4 and Table 5, only the most successful combination of each combination types was written.
| Combination Type | Attribute combinations supplying maximum performance |
Accuracy (%) |
|---|---|---|
| Using single attribute | Using only PI | 62.50 |
| Using only PT | 65.63 | |
| Using only LLA | 66.87 | |
| Using only SS | 68.13 | |
| Using only PR | 68.13 | |
| Using only GS | 62.5 | |
| Using two attributes together | Using SS and PR | 78.75 |
| Using three attributes together | Using SS, PR and GS | 78.13 |
| Using four attributes together | Using PT, LLA, SS and PR | 80.00 |
| Using five attributes together | Using PT, LLA, SS, PR and GS | 78.39 |
| Using all attributes together | Using PI, PT, LLA, SS, PR or PT, LLA, SS, PR, GS | 78.75 |
Table 4: Healthy-Hernia classification.
| Combination Type | Attribute combinations supplying maximum performance |
Accuracy (%) |
|---|---|---|
| Using single attribute | Using only PI | 77.42 |
| Using only PT | 62.26 | |
| Using only LLA | 78.07 | |
| Using only SS | 76.45 | |
| Using only PR | 67.42 | |
| Using only GS | 97.10 | |
| Using two attributes together | Using GS and anyone | 96.77 |
| Using three attributes together | Using GS and any of the other 2 | 96.13 |
| Using four attributes together | Using GS and any of the other 3 | 95.48 |
| Using five attributes together | Using GS and any of the other 4 | 94.19 |
| Using all attributes together | Using PI, PT, LLA, SS, PR and GS | 93.87 |
Table 5: Healthy-Spondylolisthesis classification.
As shown in Table 4 and Table 5, the success rate of healthyhernia classification (about 80%) is very low as compared to the success rate of healthy-spondylolisthesis classification (about 97%). Also the success rate of healthy-hernia classification (about 80%) is lower than the success rate of overall classification (about 84.5%). This result means: While healthy-spondylolisthesis classification increasing the overall classification success the healthy-hernia classification decrease the overall classification success. If so, dividing the dataset into three classes does not give information about health of subject.
In another aspect, it can be said that only GS parameter use is sufficient enough to spondylolisthesis diagnosis. However the success rate of the spondylolisthesis-hernia classification should be also analyzed to confirm this finding. Healthyspondylolisthesis classification results can be seen in Table 6. As in the previous Tables, only the most successful combination of each combination types was written.
| Combination Type | Attribute combinations supplying maximum performance |
Accuracy (%) |
|---|---|---|
| Using single attribute | Using only PI | 83.33 |
| Using only PT | 71.43 | |
| Using only LLA | 86.67 | |
| Using only SS | 85.24 | |
| Using only PR | 71.43 | |
| Using only GS | 95.71 | |
| Using two attributes together | Using LLA and GS or SS and GS | 98.10 |
| Using three attributes together | Using PT, LLA and GS | 98.10 |
| Using four attributes together | Using GS and any of the other 4 | 97.62 |
| Using five attributes together | Using PT, LLA, SS, PR and GS | 97.62 |
| Using all attributes together | Using PI, PT, LLA, SS, PR and GS | 96.67 |
Table 6: Hernia-Spondylolisthesis classification.
As shown in Table 6, the success rate of the herniaspondylolisthesis classification is very high. So, it can be said that definitely the spondylolisthesis can be distinguished easily from the healthy and hernia. Also the spondylolisthesis can be distinguished from the healthy and hernia with same success rate. So the parameters of the healthy and hernia are almost the same. In conclusion, findings related to computer-aided diagnosis of vertebral column pathologies are:
• If the automatic diagnosis method (classification method) is used the spondylolisthesis disorder can be distinguished by a high success rate (about 97-98%) from both herniated and healthy subjects.
• Use of only GS (grade of spondylolisthesis) parameter is sufficient for healthy-spondylolisthesis classification. However, use of GS parameters with others reduces the healthy-spondylolisthesis classification success. In other words, the parameters except GS may be misleading for healthy-spondylolisthesis classification.
• Hernia-spondylolisthesis classification can also be done with high success rate (98.10%). Use of only GS parameter is sufficient also for this classification. Use of GS parameter with others does not reduce the success of healthy-spondylolisthesis classification. Contrary increases the success. So the parameters except GS should be used also for hernia-spondylolisthesis classification since all attributes are informative compared to healthyspondylolisthesis classification.
• The success of the healthy-hernia classification is not very high (about 80%). So the diagnosis of hernia with the parameters used in this study should not be preferred although may provide information for some patients.
• In summary these parameters (especially GS) are for spondylolisthesis diagnosis. Triple-class classification including hernia data is not true. Also hernia-healthy classification is not true.
In addition, it should be noted that analyses of this study are based on raw data. The difference between the classes can be highlighted using some pre-processing techniques. Thus the success of hernia-healthy classification can be improved. In addition, success of hernia-healthy classification can be improved also by trying different classifiers. Also in previous studies, it has been proven that use of pre-processing and various classification methods increases the success rate [11,25].
Conclusion
In this study, dataset consist of healthy-spondylolisthesishernia subjects were classified. Various classifiers were tested and most successful classifier (Naive Bayes) was used for analyses. Analysis results were identified two important findings. The first of these findings is the parameters of the shape and orientation of spine-pelvis are not enough to healthy-hernia diagnosis although these parameters give some information. The second is that the spondylolisthesis subjects can easily be distinguished from the hernia and healthy subjects by using parameter of grade of spondylolisthesis. As a result of these findings, the proposed methods in previous studies are misleading since the numbers of subjects of classes are not equal.
On the other hand, the grade of spondylolisthesis parameter for the diagnosis of spondylolisthesis is the most decisive parameter. Therefore, this parameter must be used was proposed in this study. Furthermore, this study also will be the source for vertebral column studies to be done using different classification and processing techniques.
References
- Gadow HF. The evolution of the vertebral column, Cambridge University Press, 2014.
- Netter FH. Atlas of Human Anatomy, Professional Edition: including NetterElsevier Health Sciences, 2014.
- McGill SM. Low Back Disorders, 3E. Human Kinetics,2015.
- Barrey C, Pinheiro-Franco JL, Le-Huec JC, Perrin G, Roussouly P. Compensatory Mechanisms Contributing to the Maintenance of Sagittal Balance in Degenerative Diseases of the Lumbar Spine In Advanced Concepts in Lumbar Degenerative Disk Disease, Springer Berlin Heidelberg, 2016.
- Aebi M. Is low back pain after disc herniation with Modic Type 1 changes a low-grade infectionEuropean Spine Journal, 2013; 22: 689-689.
- Joglekar SB, Schwender JD. Minimally Invasive Spine Surgery in Lumbar Spondylolisthesis In Minimally Invasive Spine Surgery, Springer New York, 2014.
- Unal Y, Kocer HE. Diagnosis of pathology on the vertebral column with backpropagation and Naïve Bayes classifier, In Technological Advances in Electrical, Electronics and Computer Engineering (TAEECE), International Conference on IEEE276: 2792013.
- Kelm BM, Wels M, Zhou SK, Seifert S, Suehling M, Zheng Y, Comaniciu D. Spine detection in CT and MR using iterated marginal space learning, Medical image analysis 2013; 17: 1283-1292.
- Canale ST, Beaty JH. Campbell's Operative Orthopaedics: Adult Spine Surgery, 2012; Elsevier Health Sciences.
- Been E, Kalichman L. Lumbar lordosis The Spine Journal 2014; 14: 87-97.
- Unal Y, Polat K, Kocer HE. Pairwise FCM based feature weighting for improved classification of vertebral column disorders, Computers in biology and medicine 2014; 46:61-70.
- Hidayah I, Adhistya EP, Kristy MA. Application of J48 and bagging for classification of vertebral column pathologies, In Information Technology and Multimedia (ICIMU), International Conference on IEEE 2014; 314-317.
- Abdrabou E. A hybrid intelligent classifier for the diagnosis of pathology on the vertebral column, Proc of Intelligent Information and Engineering Systems 2012; INFOS.
- Ansari S, Sajjad F,Naveed N, Shafi I. Diagnosis of Vertebral Column Disorders Using Machine Learning Classifiers, In Information Science and Applications (ICISA), International Conference on IEEE 2013; 1-6.
- Roy AG, Chatterjee A, Hossain MK, Perrizo W. Fast attribute-based table clustering using Predicate-Trees: A vertical data mining approach, Journal of Computational Methods in Sciences and Engineering 2012; 12: 139-146.
- Keles A. Expert Doctor Verdis: Integrated medical expert system, Turkish Journal of Electrical Engineering & Computer Sciences, 2014; 22: 1 032-1043.
- Berthonnaud E, Dimnet J, Roussouly P, Labelle H. Analysis of the sagittal balance of the spine and pelvis using shape and orientation parameters', Journal of Spinal Disorders & Techniques 2007; 18: 40-47.
- Aggarwal CC, Zhai C, Mining text data, Springer Science & Business Media, 2012.
- Akben SB. A new method for selection of neighborhood parameter in distance-weighted k-nearest neighborsclassidier (DWKNN): Circular attribute neighbors, IU-Journal of Electrical and Electronics Engineering, 2016; 16: 2021-2026.
- Akben SB, Tuncel D, Alkan A. Classification of multi-channel EEG signals for migraine detection, Biomedical Research 2016; 27: 743-74
- Akben SB, Subasi A, Tuncel D. Analysis of repetitive flash stimulation frequencies and record periods to detect migraine using artificial neural network, Journal of medical systems 2012; 36: 925-931.
- Alpaydin E. Introduction to machine learning, MIT press, 2014.
- Kraska T, Talwalkar A, Duchi JC, Griffith R, Franklin MJ, Jordan MI. MLbase: A Distributed Machine-learning System, In CIDR, 2013; 1: 2-1.
- Duda RO, Hart PE, Stork DG. Pattern classification, John Wiley & Sons, 2012.
- Ansari S, Sajjad F, Naveed N, Shafi I. Diagnosis of Vertebral Column Disorders Using Machine Learning Classifiers. In Information Science and Applications (ICISA), International Conference on IEEE, 2013; 1-6.