Research Article - Journal of Infectious Diseases and Medical Microbiology (2018) Volume 2, Issue 3
Epidemiological modelling of vaccination and reduced funeral rites interventions on the reproduction number, R0 of Ebola virus disease in West Africa.
Sampson Akwafuo1*, Xuan Guo1, Armin Mikler2
1Department of Computer Science and Engineering, University of North Texas, Denton, TX, USA
2Centre for Computational Epidemiology and Response Analysis, University of North Texas, Denton, TX, USA
- *Corresponding Author:
- Sampson Akwafuo
Department of Computer Science and Engineering
University of North Texas
USA
Tel: 4694516075
E-mail: sampson_akwa@yahoo.co.uk
Accepted date: July 25th, 2018
Citation: Akwafuo S, Guo X, Mikler A. Epidemiological modelling of vaccination and reduced funeral rites interventions on the peproduction number, R0 of Ebola virus disease in West Africa. J Infectious Disease Med Microbiol. 2018;2(3):7-11.
Abstract
Introduction: The Ebola virus, the causative agent for Ebola hemorrhagic fever, is one of the deadliest pathogens of record. The last major outbreak of the disease occurred in six countries of West Africa in 2014, with wide-spread transmission in Guinea, Liberia and Sierra Leone. Casualties were also recorded some countries outside Africa. The disease has a mortality rate of up to 90% and may lead to death within 10 days of infection. A lot of concerted efforts were instituted to control the raging epidemic. Materials and Methods: Using existing data on recorded cases and recently available intervention details, we model the impacts of these control measures on the sensitivity of the reproduction number, R0 . Specifically, we study the effects of vaccination and reduced funeral rites. We develop a mathematically-based computational model, incorporating a system of differential equations, which represents compartments of the epidemic population and intervention parameters. Results: Our findings reveal the percentage of the population that needs to be vaccinated, in each of the countries, to ensure containment of the disease outbreak. In addition to other interventions, the reproduction number can be effectively controlled, and the epidemic suppressed, by concentrating on vaccination and streamlined funeral activities. Conclusions: Our model can be used to forecast the duration of Ebola epidemic in any country, using our generic coefficient. Percentage of the population requiring herd immunity, through vaccination can be obtained. If there are no interventions in funeral activities, the R0 will remain above one. R0 will now depend on other interventions and the epidemic will linger for a longer time.
Keywords
Ebola, Modelling, West Africa, Vaccination.
Introduction
Ebola virus disease (EBOV) is caused by a virulent and lethal pathogen, belonging to the family of Filoviridae and order of Mononegavirales [1]. Its genome is a single stranded RNA of approximately 19,000 nucleotides long (Figures 1 and 2). There are many species of the virus including Zaire, Bundibugyo and Reston ebolavirus.

Figure 1: Structure of Ebola virus.

Figure 2: Sample result of Ebola virus DNA sequencing.
Bats and other wild animals are major carriers of the virus. It causes a severe and often fatal haemorrhagic fever in humans and mammals [2], leading to death in about 10 days of infection. It is zoonosis and can also be transmitted through body fluids in human-to-human interactions [3]. EBOV has a high mortality rate of 60%-90%. Since 1976 when Ebola virus disease first appeared in Africa, there have been many spontaneous outbreaks, resulting in substantial number of casualties [4]. 11,310 deaths occurred during the last epidemic, between 2013 and 2015, with recorded casualties outside West Africa, including United States [5-8].
Objectives
The prime objective of this study is to develop a model, using epidemiological data and metrics from three West African countries: Guinea, Sierra Leon and Liberia, that will be used to determine effects of public health interventions on Ebola virus disease control. Specifically, given the population of the country, the model will estimate the number of individuals required to be vaccinated to ensure the reproduction number (R0) becomes less or equal to one. We will also estimate how reduction in funeral activities will affect the R0 of the disease.
Methodology
A deterministic model, involving a modified version of SIR structure is developed. Similar structures have been used recently in investigating the dynamics of Ebola virus [9-11] and other infectious diseases [12]. The population is divided into three sub-groups: The susceptible (S) represents all members of the public that are prone to contacting the disease, due to interactions with other population sets. Other subgroups include infected (I) individuals, recovered from the disease (R), infected but hospitalized (H), dead individuals on the funeral waiting list (F) and the vaccinated (V) population. Individuals receiving medications at home or quarantined are assumed to belong to the H group [13] (Figure 3).

Figure 3: Structure of the model.
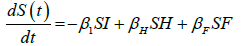
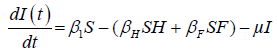
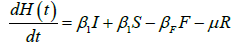
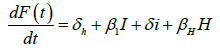
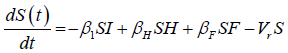
We developed a set of dynamic SIR equations to simulate the parameters of the disease. Existing data were used for the model fitting [4,12]. The equations below were used to model the behavior of the disease and movement across each group when there are no interventions:
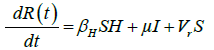
These equations were modelled to study the behavior and sensitivity of R0 to the population groups without interventions. When vaccination is introduced, the susceptible and recovered equations become:
 (2)
(2)
The vaccinated population at time, t+1, is given by:
The impacts of interventions on the reproduction number is investigated using these equations:
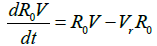
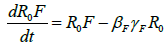
Where R0 is the initial reproduction number, R0V represents the resultant reproduction after the introduction of vaccination [14]. R0F is the reproduction number when the funeral rites and number of days are reduced. γF represents the traditional funeral duration the country of study. As in the previous equations, βF is the rate of infection from a dead person to a susceptible individual. Other parameters are as described in Table 1 [12,15,16].
Table 1. Model parameters and their description.
| Parameter | Description | Guinea | Liberia | Sierra Leone | Source |
|---|---|---|---|---|---|
| Β1 | Transmission rate | 0.2275 | 0.1701 | 0.2355 | [10,18] |
| βH | Transmission rate during hospitalization | 0.4269 | 0.062 | 0.08 | [1] |
| βF | Transmission rate during funeral | 0.0445 | 0.489 | 0.111 | [3] |
| µ | Recovery rate | 0.160 | 0.128 | 0.160 | [3,18] |
| δh | Fatality rate of hospitalized population | 0.43 | 0.50 | 0.75 | [3,8] |
| δi | Fatality rate of infected population | 0.6728 | 0.4725 | 0.3143 | [18] |
| R0 | Reproduction number | 1.51 | 1.59 | 2.53 | [20,8] |
| N | Population of the country | 11745189 | 4294077 | 6092075 | [13] |
| γF | Traditional funeral duration | 2.01 days | 3.255days | 4.5 days | [18,19] |
| Vr | Vaccination rate | 0.5, 0.05 | 0.5, 0.05 | 0.5, 0.05 | [1,15] |
| Vϵ | Vaccination efficacy | 0.5487 | 0.5487 | 0.5487 | [10,18] |
Assumptions
1. An infected individual who receives care and treatment at home, and later recover, is considered to have passed through the hospitalised group into the recovered group.
2. Latent period (days) in exposed class is usually small and therefore ignored.
3. Individuals receiving medications at home or quarantined are considered part of the H group.
Parameters and their description
Our model parameters are explained in Table 1.
Results and Discussion
Effects of vaccination
When eqn. (1) were simulated, the Reproduction Number R0, continues to increase, within the run-time. However, using eqn. (2) and a vaccination rate of 0.5, in Guinea, the reproduction number shows a gradual decrease, as vaccination cycle increases. R0 becomes less than 1 after the 11th cycle (Figure 4a). This indicates that not less than 11 cycles are required, for vaccination to be effective in the control of the epidemic in Guinea. However, in Liberia, using an initial reproduction number of 1.7994, it becomes less than 1 after the 13th cycle (Figure 4b). In Sierra Leone, the threshold value occurred after the 19th cycle (Figure 4c).

Figure 4a: Relationship between vaccinated population and the reproduction number (Liberia).

Figure 4b: Relationship between vaccinated population and the reproduction number (Guinea).

Figure 4c: Relationship between vaccinated population and the reproduction number (Sierra Leone).
As shown in Figure 5, in addition to other studied interventions, in Guinea, 36% of the population needs to be vaccinated to bring the R0 less than 1 and effectively work towards controlling the epidemic. In Liberia, and Sierra Leone, 43% and 51% of the population needs to be vaccinated respectively. This is due to different initial reproduction numbers for the country. Sierra Leone has the highest R0 of 2.53 and hence higher number of persons need to be immunized in the country.

Figure 5: Different rates of vaccination and their effects on the susceptible population.
A vaccination rate of 0.5 corresponds to half of the public health work force in the entire country, participating in the vaccination outreaches 6. In West Africa, this might not be easily obtainable. Vaccination rate of 0.05 therefore becomes a more practical and ideal option. Vaccination campaigns are carried in cycles or dedicated periods, where health workers visit households in a location and vaccinate members of each household. This does not preclude the usual work-in exercises at health facilities.
Effects of traditional funeral rites
The usual traditional burial days of dead individuals in West African rages from 2 to 7 days, with accompanying traditional funeral rites [17,18,19]. Using funeral transmission rate, βF=0.0045, we model the effects of reducing these activities and ensuring dead individuals are buried by trained public health officers only. As shown in Figure 6, R0 becomes less than one after the 7th cycle in Guinea. In Liberia and Sierra Leone, it took a little longer (12th and 18th cycles) to bring the R0 less than one [20]. This is due to lengthy funeral durations in these countries. As shown in Figure 7, if there are no interventions in this area, the R0 will remain above one. R0 will now depend on other interventions and the epidemic will linger for a longer time.

Figure 6: Numbers and percentage of the population required to be vaccinated to bring R0 <1.

Figure 7: Impacts of reduced funeral activities on the three countries.
Conclusion
In this study, we used existing epidemiological data and a deterministic model to investigate the effect of vaccination and streamlined funeral activities on the reproduction number of Ebola virus disease. Results from our model affirm the need for an intervention in the postdeath transmission [16] of Ebola virus. Reducing the funeral rites and days can effectively affect the reproduction number and assist in controlling the disease. We can deduce the duration of the epidemic, if suggested proportions of the studied interventions are applied. The generic version of our model can be applied by public health officers in estimating the number of individuals required to be vaccinated, to ensure the control of the disease.
References
- http://arxiv.org/pdf/1501.05555v1
- Keeling MJ, Rohani P. Modelling Infections Diseases in Humans and Animals. Princeton University Press, Princeton, NL. 2008:307-15.
- Rivers CM, Lofgren ET, Marathe M, et al. Modeling the Impact of Interventions on an Epidemic of Ebola in Sierra Leone and Liberia. PLOS Curr. 2014;6.
- World Health Organisation. Ebola data and statistics. WHO, Geneva. 2015.
- Center for Disease Control and Prevention. Ebola virus disease. CDC, US. 2017.
- Dixon MG, Schafer IJ. Ebola Viral Disease Outbreak-West Africa. MMWR Morb Mortal Wkly Rep. 2014;63(25):548-51.
- Chowell G, Viboud C, Hyman JM, et al. The Western Africa Ebola Virus Disease Epidemic Exhibits Both Global Exponential and Local Polynomial Growth Rates. PLOS Curr. 2015;7.
- Chowell G, Nishiura H. Transmission dynamics and control of Ebola virus disease (EVD): a review. BMC Med. 2014;12(1):196.
- van den Driessche P, Watmough J. Reproduction numbers and sub-threshold endemic equilibria for compartmental models of disease transmission. Math Biosci. 2002;180:29-48.
- Amira R, Delfim FMT. Mathematical Modelling, Simulation and Optimal Control of the 2014 Ebola Outbreak in West Africa. Discrete Dyn Nat Soc. 2015;2015:9.
- Shaman J, Yang W, Kandula S. Inference and forecast of the current West African Ebola outbreak in Guinea, Sierra Leone and Liberia. PLoS Curr. 2014;6.
- Akwafuo S, Shattock A, Mikler AR. Modelling HIV Intervention among Most-at-Risk/Key Population: Case Study of FWSS in Nigeria. J AIDS Clin Res. 2017;8:732.
- http://data.worldbank.org/indicator
- Camacho A, Kucharski A, Aki-Sawyerr Y, et al. Temporal changes in Ebola transmission in Sierra Leone and implications for control requirements: a real-time modelling study. PLoS Curr. 2015;7.
- Mohammadi D. Ebola Vaccine trials back on track. Lancet Infect Dis. 2015;385(9964):214-5.
- Weitz JS, Dushoff J. Modeling Post-death Transmission of Ebola: Challenges for Inference and Opportunities for Control. Sci Rep. 2015;5:8751.
- World Health Organization. Ebola Response Road Map Situation Report. WHO, Geneva. 2014.
- Mingwang S, Yanni X, Libin R. Modelling the effect of comprehensive Interventions on Ebola Virus Transmission. Sci Rep. 2015;15818.
- CL Althaus. Estimating the Reproduction Number of Ebola Virus (EBOV) during the 2014 Outbreak in West Africa. PLoS Curr. 2014;6.
- Pandey A, Atkins KE, Medlock J, et al. Strategies for Containing Ebola in West Africa. Science. 2014;346(6212):991-5.