Research Article - Biomedical Research (2017) Volume 28, Issue 1
EEG signal complexity analysis for schizophrenia during rest and mental activity
Thilakvathi B1*, Shenbaga Devi S1, Bhanu K2 and Malaippan M31Department of ECE, College of Engineering, Anna University, Chennai, India
2Madras Medical College and Government General Hospital, Chennai, India
3Kilpauk Medical College, Chennai, India
- *Corresponding Author:
- Thilakavathi B
Department of ECE, College of Engineering
Anna University, Chennai-602105, India
Accepted date: February 22, 2016
Abstract
Electroencephalogram (EEG) signal complexity quantifies the brain dynamic and yields many different features to diagnose many psychotic disorders. The aim of this work is to analyze EEG to detect schizophrenia in comparison with normal subjects using EEG signal complexity, at various conditions such as rest and mental activity. In order to stimulate mental activity, this work proposes a two modified odd ball paradigms. In this research work, 55 schizophrenia subjects and 23 normal subjects together 78 subjects are included. EEG is recorded under resting state with eyes closed and during the stimuli applied. Shannon entropy, Spectral entropy, Information entropy, Higuchi’s Fractal Dimension, Kolmogorov complexity and Approximate Entropies are considered as features and are analyzed in two aspects. One is at rest condition and the other is during application of stimulus for mental activity. The signal complexity is more for schizophrenia compared to the normal group during different mental states and it is more dominant during mental activity with p<0.0001 for the features Higuchi’s Fractal Dimension, Kolmogorov complexity and Approximate Entropy. The highest classification accuracy 88.5% is obtained when features of both stimulus are considered together. This work suggests that the EEG signal complexity during mental activity can be used to identify schizophrenia subjects.
Keywords
Schizophrenia, Modified odd ball paradigm, EEG, Complexity analysis, SVM classifier
Introduction
Schizophrenia is a devastating psychiatric disease with symptoms of both negative and positive [1]. Though Electroencephalogram (EEG) and Magneto encephalogram (MEG) have been widely used for the investigation of psychiatric syndromes by researchers, such techniques are not used to identify schizophrenia in day to day clinical practice [2]. There are no biological markers for most of the mental disorders. From the literature given by some researchers, it is very clear that most of the disorders such as schizophrenia, Obsessive Compulsion Disorder, Attention Defect Hyperactivity Disorder, etc., that affect the mental condition produce very similar variation in baseline brain activity [3]. The non-linearity of the brain is basically from the neuronal level. The complexity is generally used to describe the characteristics of biological systems. The analysis of brain signal complexity has been widely used in many psychiatric disorders [2]. Measures of signal complexity quantify different features of standardized EEG pattern [3]. Brain complexity has been also used to investigate the pathological problem and distinct difference is obtained compared to healthy groups [4].
Sometimes measuring complexity is very much helpful in evaluating motor activity of schizophrenia subjects [5]. Li et al. reported about the complexity of Schizophrenia in comparison with depression patients and controls [6]. Some researchers used dynamic changes in electro dermal activity as an indicator of neural complexity for schizophrenia subjects [7]. Schizophrenia subjects have reduced neural complexity as the age increases [8]. The Lempel-Ziv complexity of the spontaneous EEG is often used to examine human mental fatigue [9] and widely used to evaluate the complexity of brain signal from the MEG for depressed subjects [10]. Even anesthetic depth has also been identified by EEG signal complexity [11]. The nonlinear activity of EEG in subjects with schizophrenia was already reported by Elisa Carlino et al during mathematical arithmetic task [12]. Dynamical aspects of EEG for schizophrenia subjects are evaluated and reported that it is high only on Fz and Cz electrodes [13]. The positive and negative symptoms of schizophrenia are discriminated by Higuchi’s fractal dimension [14]. It is already reported with the help of fMRI signals, that the schizophrenia subjects have a higher complexity than controls [15]. The human physiological systems and sleep EEG analysis are traditionally characterized as a complex using Higuchi’s fractal dimension [16,17]. Tetsuya Takahashi et al used Multi scale entropy to measure dynamical complexity and observed higher complexity for schizophrenia only at lower frequencies. This complexity is observed in both pre and post treatment [18]. The alpha band of resting EEG for schizophrenia has shown more irregular and suggested for the diagnosis [19].
Though, already a variety of studies [5-8,12-15] have been carried out in EEG signal complexity for schizophrenia subjects, this study focuses on the signal complexity analysis during mental activity (cognitive process). To stimulate mental activity this work proposes two types of specially designed stimuli. Features are extracted during cognitive process and are compared with respect to resting EEG.
Materials and Methods
The workflow of the proposed method is shown in Figure 1

Figure 1: Block diagram of proposed method.
Subjects
EEG is recorded from 78 subjects of whom 23 are normal subjects and 55 are affected by schizophrenia. The average age of 55 schizophrenia subjects is 40.3(20 women and 35 men) and the mean age of 23 normal subjects is 41.7 (11 women and 12 men). Subjects only with schizophrenia are the inclusion criteria for this study design and this is verified by the psychiatrist. All subjects who are either admitted as an inpatient or outpatient have undergone Mental State Examination. The Mental State Examination is carried out by the psychologist. Based on the report given by the psychologist, psychiatrist diagnoses the schizophrenia subjects according to International Classification of Diseases (ICD)-10 criteria specified by World Health Organization. Finally, only the subjects who are diagnosed as schizophrenia included in this study. All subjects are incidentally right handed and informed consent is obtained. The Schizophrenia subjects are taking different antipsychotic medications and doses during this study.
EEG recording
The 23 channel Brain Clarity-Brain Tech+40 equipment is used to record EEG at FP2, F4, C4, P4, F8, T4, T6, O2, FP1, F3, C3, P3, F7, T3, T5 and O1 positions of International standard 10-20 system using mono polar montage with linked ear as reference. The sampling frequency of EEG is kept at 256 Hz. Initially, the subjects are asked to sit in a chair in a relaxed position with closed eyes. EEG is recorded using eyes opened task, eyes closed task, during hyperventilation, post hyperventilation, photic stimulation and by providing visual stimuli designed for this work. EEG signals are filtered by a band pass filter with upper and lower cutoff frequencies of 0.1 Hz and 70 Hz respectively, and notch filter (50 Hz) for removing power line interference by the equipment setting. The sensitivity of the equipment is set to 7.5 μv/mm. In many studies, oddball paradigm is used to analyze cognitive processes [20]. So we have specially designed two modified odd ball paradigms to examine the mental activity, and they are named as Stimulus 1 and Stimulus 2 in this paper.
Modified odd ball paradigm-stimulus 1
We have defined the pictures of different babies as target picture and the pictures other than baby such as sceneries, animals, flowers, transport and birds are set as non-target pictures. In a run, one baby picture and non-target pictures are displayed with 500 ms and 750 ms duration respectively with reference to odd ball criterion. The entire run is repeated five times. In each run, the occurrence of target picture, namely baby picture is random. Totally 5 runs are designed in this stimulus. The non-target pictures are changed for every run. The total stimulus lasts entirely for 1 minute and 27 seconds. Figure 2a shows the pattern of stimulus 1. There are 5 runs used in the protocol and the list of pictures used for each of the runs is shown in the corresponding rows. These pictures include both target and non-target pictures.

Figure 2: Design of modified odd ball paradigm pictures used for; A) Stimulus 1; B) Stimulus 2.
Modified odd ball paradigm-stimulus 2
This stimulus is a slightly weaker stimulus than the stimulus 1. Here also, the baby picture is considered as a target and flower pictures are set as non-target pictures and both appear randomly in a run. There are nine epochs and in each epoch, one baby picture and 6 flower pictures are displayed in a defined order with equal time duration of 1 s. Between the two epochs, blank screen with 0.75 s duration is displayed. This stimulus lasts for 1 minute and 23 seconds. The pictures used in stimulus 2 are shown in Figure 2b. In stimulus 1, though the target picture is a baby picture, the non-target pictures are changed, but in stimulus 2, the non-target pictures are pictures of flowers and target is the picture of a baby which remains unchanged.
The information about the target and the non-target picture is explained and shown to the subjects prior to the recording. The subject is instructed to mentally count the number of target pictures during the stimulus presentation and instructed to tell the count at the end of recording. The recording consists of conventional EEG recording followed by recording of EEG during stimulus presentation. At the end of the conventional recording of EEG, the subject is requested to open the eyes. The above described two types of stimuli are displayed one after another on the 15 inch computer screen (color monitor) using windows media player. The color monitor is located at 1.5 meter distance from the subject making 10° angle with respect to their eyesight. The start and end time of the stimulus is marked by the EEG marker during recording. For the purpose of analysis, we consider 10 second epoch of EEG data during mental activity which contain minimum eye blink artefact.
Preprocessing
EEG used for rest stage condition analysis does not require any preprocessing technique, because the subjects are with eyes closed condition. By visual inspection, artifact free 10 s EEG is considered for rest condition analysis. Since we have used visual stimulus to stimulate mental activity, it is necessary to open the eyes while recording EEG during stimulus presentation. The possibility of eye blink artifact is more in this condition and hence it is essential to remove eye blink artifact. Such eye blinks are removed with the help of ICALAB using AMUSE algorithm. The recorded EEG during rest, stimulus and eye blink removed EEG are shown in Figure 3.

Figure 3: Sample recorded EEG for schizophrenia (FP1 channel).
Features extraction
A number of parameters exist to study about the EEG signal complexity. From the literature survey made [2,5,6,8,14], it is decided to use Spectral Entropy, Information Entropy, Shannon Entropy, Higuchi’s Fractal Dimension, Kolmogorov Complexity and Approximate Entropy as features to analyze the complexity of EEG signal for schizophrenia in comparison with normal subjects under various brain activity conditions. These features are selected for further analysis because they are frequently used popular parameters to study about the regularity/irregularity of a signal and some of these are suggested by researchers for analysis of nonlinear brain dynamic activity for mental disorders.
Shannon entropy (ShEn): Claude Shannon defined entropy as a measure of uncertainty for random variable. Since EEG signals are random in nature, some information may be gathered if we use Shannon Entropy (ShEn) as one of the features to measure its complexity. When signal amplitudes are equally probable, ShEn is maximized. In the present study, for the selected artifact free 10 second epoch of normalized EEG signal, the histogram is calculated to obtain the probability of occurrence of each amplitude. Then the Shannon entropy is determined and it is normalized by dividing log k where k is the length of the signal [21].
Spectral eEntropy (SpEn): The spectral entropy (SpEn) is basically calculated from power spectrum. To calculate entropy, frequency samples are considered from the power spectrum of the given EEG signal. To normalize the spectral entropy, it is divided by a factor log Nf where Nf is the number of frequency components in the range f1 and f2 [22]. The frequency range f1 and f2 are set to 0.1 Hz and 70 Hz respectively.
Information Entropy (InEn): Information Entropy (InEn) is a measure of information actually contained in the signal. It is calculated directly from the amplitude of the signal by considering every time series value and the value of InEn is normalized by the log of the length of the signal [23].
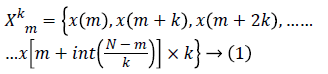
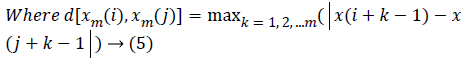
Higuchi’s Fractal Dimension (HFD): Fractal dimension can be simply interpreted as a degree measuring the roughness or the irregularity of a signal [14,22]. A fractal dimension is an index for characterizing fractal patterns or sets by quantifying their complexity as a ratio of the change in detail to the change in scale. The fractal dimension refers to non-integer or fractional dimension of a geometric object. It estimates the fractal dimension directly in the time domain where the original signal is considered as a geometric figure. In the present study, 10 second EEG data with a sampling frequency of 256 contains totally 2560 samples. These samples are used to construct k time series, where k=1, 2,..... kmax. The value of kmax is chosen as 48 in this study as indicated by Gomez et al. [24]. The new time series Xkm is generated using equation (1) where m denotes initial time and k shows delay between the points [24]. The parameter m takes the value from 1 to k.
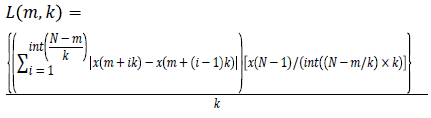
For each time series, average length is computed as follows
 (2)
(2)
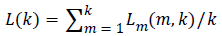
The total average length is calculated as follows
 (3)
(3)
Kolmogorov Complexity (KOL): Kolmogorov Complexity (KOL) is another statistical property which is used to quantify the complexity or irregularity of signal. Evaluation procedure starts by considering the mean value of the time series. Then every value of the time series is compared with the mean value. If the value is greater than the mean, it takes value of 1; if less than the mean, it takes the value 0. Thus, a symbol sequence consisting of 1’s and 0’s is obtained. This is a coarse granulation process. The complexity is measured with this symbol sequence. The new symbol sequence is scanned and the complexity counter is increased by one when every time new sequence is detected. Lempel and Ziv have shown that the complexity c(n) of random strings converges to the value where n is the length of the sequence. C(n) is the KOL complexity which is calculated by c(n) divided by b(n) where b(n) is the ratio between n and log n. In this case, n is the length of the EEG time series data [25].
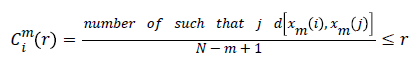
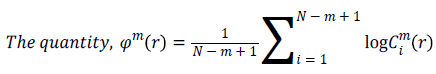
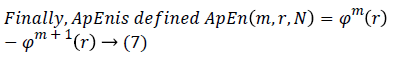
Approximate Entropy (ApEn): It is a measure for quantifying the randomness of the signal. Initially the value of m and r are chosen as 2 and 0.25*Standard deviation of the signal respectively [22]. From the time series signal, 10 second length EEG x(i), xm(i)vectors are formed. The ApEn of the finite signal is calculated as follows.
For each value of i, 1 ≤ i ≤ N-m+1 the value
 (4)
(4)
 (6)
(6)
Results
The features discussed in section 2.6 describing the nature of complexity of EEG signal are calculated for all 16 channels and hence are hereafter referred to as complexity measures. EEG data length of 10 sec is considered uniformly for all 16 channels. The average values of the features of each channel for the two groups, namely normal group and schizophrenia group are computed and considered for analysis. The complexity measures are computed for two conditions, namely when the subjects are at rest and during the cognitive process stimulated by the application of visual stimuli.
Complexity analysis at rest condition
The average values of all features for both groups at rest, stimulus 1 and stimulus 2 are shown in Figures 4a-4c respectively. From the Figure 4a, it is inferred that the ShEn, InEn, HFD, ApEn and SpEn parameters are high for schizophrenia subjects compared to the normal groups except KOL. Higher the values of these parameters corresponds to greater complexity in the data [8]. Literature says that increase in complexity value for schizophrenia subjects is due to neural complexity [7]. In the present study, it is inferred that the selected parameter during rest EEG does not yield greater difference between the two groups. This insists us to consider this analysis during application of stimuli.

Figure 4: Complexity measure comparison between normal and schizophrenia; A) during rest; B) during stimulus 1; C) during stimulus 2.
Complexity analysis during mental act
As described in section 2.2, EEG is recorded during the cognitive process stimulated by the application of stimuli. This helps us to enable mental activity of subjects compared to rest condition. It is seen from the results that the chosen parameters are high for schizophrenia compared to normal subjects during mental activity and it is shown in the Figures 4b and 4c. The brain response obtained for the stimulus 1 clearly indicates that the parameters such as InEn, HFD, KOL and ApEn show high values for schizophrenia group whereas SpEn and ShEn measures decrease in comparison with normal subjects. These findings are same for the EEG analysis during application of stimulus 2. In summary, during the cognitive process, an increase in EEG complexity is very high in comparison with the rest and also considerable differences between the two groups are noted. So this work is further extended to compare such parameters with respect to rest condition. Figure 5 shows the comparison of all features during the cognitive process with respect to rest condition. In comparison with rest state all complexity values are high except SpEn irrespective of the nature of the group. It is also observed, all types of complexity measures of schizophrenia groups show significant differences from normal subjects and increase in their value from the rest condition is tremendous.

Figure 5: Complexity comparison between normal and schizophrenia during stimuli with respect to rest; A) shannon entropy measures; B) spectral entropy measures; C) information entropy measures; D) higuchi’s fractal dimension measures; E) approximate entropy measures; F) kolmogorov complexity measures.
But spectral entropy decreases for schizophrenia compared to normal subjects. From this, we can conclude that the EEG signal complexity analysis during the cognitive process may be bringing out some feature to distinguish the schizophrenia group from normal subjects. Since the parameters have changed during mental activity, it is essential to analyze the level of change from the rest condition. The comparison of some parameter measures in the three conditions, namely at rest and during the presentation of the two stimuli is depicted in Figure 6 for illustration purpose. It is inferred that the values of the EEG complexity for the stimulus increase from the rest condition. Though it increases in both the groups, schizophrenia group has maximum difference compared to normal group for the parameters ShEn, HFD, ApEn and KOL. Even though InEn measure does not produce major change, SpEn decreases with respect to resting EEG. Hence it is inferred that instead of the rest condition and the stimulus condition taken independently, the difference between the rest and mental activity during the period of stimulus will be a better feature to distinguish between the two groups.

Figure 6: Box plot for variation of complexity measures; a) Variation of Approximate Entropy; b) Variation of Approximate Entropy; c) Variation of Shannon Entropy; d) Variation of Kolmogorov Complexity.
Lobe wise complexity analysis
This work is further extended to find the lobe wise response of the brain to the stimulus. To achieve this, the complexity values are segregated according to five lobes and each lobe complexities are analyzed as follows. For the frontal lobe analysis, the average of 6 channels such as FP2, FP1 F8, F3, F7, and F4 is computed. For the central lobe study, the average value of complexity at C3 and C4 is taken into consideration. In order to compute the performance of the parietal lobe, P4 and P3 channel results are averaged. The average of T6, T4, T3 and T7 channel complexity is considered for temporal lobe analysis. To analyze Occipital lobe response, mean value of O2 and O1 is considered Figure 7 shows the complexity values at various lobes.

Figure 7: Lobewise Signal Complexity Analysis; a) ApEn at various lobes; b) HFD at various lobes; c) KOL at various lobes; d) ShEn at various lobes.
When we compare the results in Figures 7a-7d, we found that all features have their maximum values either at temporal or at occipital lobes during rest and stimulus 1 except for the feature InEn. During detail examination, signal complexity is generally found very high in the occipital lobes for some measures like HFD, ApEn whereas the parameters like ShEn, KOL have shown high in the temporal lobe. High Complexity in occipital lobe might be caused due to the application of visual stimuls. Although the signal complexity values are high during mental activity, the analysis of these features shows that the lobes in which the maximum and minimum values of these features occur are different for the schizophrenia group in comparison with normal group. The signal complexity at the frontal lobe reaches least value for both groups but this minimum is more for normal subjects. Out of five lobes, more difference between the two groups is observed during mental activity only in the frontal and parietal lobe. This maximum difference is more specific at electrodes FP2, F8, FP1 and F7 for schizophrenia group compared to normal subjects. We have used 6 features to analyze schizophrenia using signal complexity and our finding suggests that cognitive process EEG may be helpful to discriminate from normal.
Feature reduction by statistical evaluation
The parameters which are analyzed in the section 3 are tested with the Student’s t test and Analysis of Variance (ANOVA). It is described below.
Student’s t-Test
The significance of features in discriminating the schizophrenia from normal is determined by the student’s two tailed t test with unequal variances [26]. The complexity measures described in section 2.6 for all subjects during various brain conditions are the parameter of t-test.99% confidence level is set to find the difference between the two mean values. So the significance level is kept at α=0. 01. The SPSS statistics tool is used and it defines the actual level of significance observed (p). If p<α, then it shows there is a difference in features between the two groups. The results of two tailed t-test are shown in Table 1.
| Parameters | Rest/P value | Stimulus 1/P value | Stimulus 2/P value |
|---|---|---|---|
| ShEn | 0.019 | 0.824 | 0.000a |
| SpEn | 0.403 | 0.328 | 0.016 |
| InEn | 0.546 | 0.186 | 0.231 |
| HFD | 0.001b | 0.000a | 0.000a |
| Kol | 0.857 | 0.000a | 0.000a |
| ApEn | 0.189 | 0.000a | 0.000a |
| a-Significant features with p<0.00001 b-Significant features with p<0.01 |
|||
Table 1. Results of statistical analysis of complexity measures.
It is inferred from Table 1 that HFD is a significant complexity measure for all the three conditions (p<0.01, marked with b). For stimulus1 and stimulus 2, apart from HFD, the other parameters, namely KOL and ApEn also play significant roles in discriminating the two groups. ShEn appears to be a significant parameter for stimulus 2 other than the above mentioned parameters. It is to be noted that in the table, for some parameters, the p value is very small and hence they are shown as 0.0000. Thus when the results of the statistical t test are analyzed, it is found that the two groups can be distinguished based on EEG features during the stimulus.
ANOVA
The one way ANOVA is carried out in the MATLAB environment to determine the total variation in a set of complexities when the brain condition changes from rest to mental activity and the results are shown in Table 2. It was carried out for each group individually. The results shown in Table 2 are specified only for the F-ratio and critical value of ANOVA. Critical value is the actual value from the F table at 5% and approximated to four digits. The ANOVA has been done for all calculated features.
| Parameters | Normal | Schizophrenia | ||
|---|---|---|---|---|
| F-ratio | Critical value | F-ratio | Critical value | |
| ShEn | 126.57 | 0 | 166.42b | 0 |
| SpEn | 27.97a | 0 | 25.97 | 0 |
| InEn | 0.94 | 0.3983 | 1.43 | 0.2498 |
| HFD | 14.75 | 0 | 48.47b | 0 |
| Kol | 134.84 | 0 | 276.17b | 0 |
| ApEn | 131.83 | 0 | 261.14b | 0 |
| aParameter shows significant variation for Normal Subjects cParameter shows significant variation for Schizophrenia Subject |
||||
Table 2. Results of statistical analysis of features using ANOVA
Table 2 is analyzed as follows. ShEn has critical value of 0.0000 and for schizophrenia group the F ratio is 166.42 which is higher than that of normal group with nature of 126.57. This shows that ShEn has shown larger variations for schizophrenia during the brain conditions namely rest, stimulus 1 and stimulus 2. This result also shows significant differences between resting and mental task which can be obtained in F ratio for all parameters being greater than the critical values. This helps us to conclude that high difference in features exist between two groups when moving from rest to stimulus. Moreover, the features marked with ‘a’ in Table 2 shows greater variance for normal subjects and it is other way for the features marked with ‘b’. Therefore the features HFD, KOL and ApEn for schizophrenia are more dominant during mental activity compared to the rest and complexity at this mental activity can be used as a feature to identify schizophrenia from the normal groups.
Classification of schizophrenia from normal subjects
Based on the statistical test made, we have selected HFD and ShEn as features during rest condition, HFD, Kol and ApEn during stimulus 1 and ShEn, HFD, Kol and ApEn are considered as features during stimulus 2 to classify schizophrenia from normal subjects. The features are grouped into many categories as shown in Table 3. Two types of classifiers namely feed forward neural network and SVM classifiers are designed using these features. The classifiers are trained and tested with two different combinations of feature set. Initially, the classifiers are trained and tested with 70% and 30% feature sets respectively. To see the changes in the performance of the classifier, they are changed as 80% and 20% respectively.
| Type of the Classifier | Testing and Training inputs | No. of Subjects | Accuracy(%) for the Features during | |||||||
|---|---|---|---|---|---|---|---|---|---|---|
| Schizophrenia | Normal | Resting EEG | Stimulus 1 | Stimulus 2 | Rest and Stimulus 1 | Rest and Stimulus 2 | Stimulus 1 and Stimulus 2 | Rest and Stimulus (1 and 2) | ||
| Feed Forward Neural Network | Training 70% | 39 | 16 | 77.9 | 65.4 | 69.1 | 64.1 | 64.1 | 80.2 | 77.9 |
| Testing 30% | 16 | 7 | ||||||||
| Training 80% | 47 | 13 | 72.7 | 64.2 | 67.9 | 62.9 | 67.1 | 81.5a | 79.2 | |
| Testing 20% | 15 | 3 | ||||||||
| SVM Classifier | Training 70% | 39 | 16 | 73.9 | 79.1 | 75 | 69.5 | 68.75 | 80.3 | 78.2 |
| Testing 30% | 16 | 7 | ||||||||
| Training 80% | 47 | 13 | 80 | 81.25 | 79.16 | 75 | 69.5 | 88.5a | 85.5 | |
| Testing 20% | 15 | 3 | ||||||||
| aHighest classification accuracy | ||||||||||
Table 3. Performance of the classifier.
The designed Feed forward neural network with back propagation algorithm has one hidden layer with one input and one output layer. The hidden layer has 2n+1 neurons where n is the numbers of features and sigmoid activation function is used. The momentum coefficient and the performance goal are set to 0.95 and 0.0001 respectively. The mean square error is considered to meet the performance goal. Secondly, SVM classifier is used to classify the Schizophrenia group from normal subjects for comparison purpose. Radial Basis Functions are used as kernel for SVM classifier and quadratic programming method is used to separate the hyper plane. The performances of both neural network and SVM classifier are shown in Table 3.
From Table 3, it is inferred that SVM classifier gives better accuracy compared to feed forward neural network. In Table 3 the impact of stimulus features can be seen clearly, since it has given high classification accuracy with respect to resting EEG features. When the features of each stimulus are combined with those in resting EEG, the accuracy of the classifier does not improve. But when distinct features of both stimuli alone are used as inputs of the classifier, the highest classification accuracy of 81.5% is achieved with a feed forward neural network and 88.5% is seen in SVM. This concludes that the schizophrenia group can be identified from normal groups using the EEG signal complexity obtained during stimulus alone and the application of the SVM classifier gives better accuracy when compared to the neural network.
Discussions
This work uses EEG as a tool to identify schizophrenia. Firstly, when the subjects are at rest, HFD measure is helpful to differentiate schizophrenia from normal subjects. Neural complexity of schizophrenia is high and this is clearly seen in the increase in complexity measures with our study [7]. Secondly, during the application of visual stimuli, the EEG signal complexity measures of schizophrenia have shown considerable changes and significant difference is obtained for the features HFD, ApEn and KOL with very low value of p (p<0.001). Functional fragmentation of neural subsystems related traumatic dissociation and splitting in schizophrenia increases the neural complexity which causes EEG more complex [7]. As far as lobes are concerned, the more complexity difference is observed both at frontal and parietal lobes between the two groups. The frontal lobes are responsible for memory problems which are associated with regulation of behavior and cognitive perception [27]. These problems are very common for schizophrenia subjects, and in this connection, more difference could have obtained between the two groups. The parietal lobe supports frontal lobe in the storage and retrieval of memory [28]. Further the white and gray matter volume reductions are normally seen in schizophrenia subjects at the parietal lobes [28]. Hence neural complexity increases and this is seen in our results. The details of various studies already made for schizophrenia are compared with the proposed work and it is shown in Table 4. Analysis of EEG for schizophrenia subjects has been carried out by other researchers and they have considered a different set of complexity measure as features. Table 4 shows the list of such features used by other researchers along with the features used in the present work. From the Table 4, it can be inferred that many of the complexity measures used in the present work are considered by other researchers also.
| Ref. No | No.of Subjects | No.of Electrodes | Data and Condition | Feature, Results | Feature selection/ Statistical Analysis | Classification Accuracy |
|---|---|---|---|---|---|---|
| 1 | 13 | 16 | EEG, Resting | ED (low) | - | - |
| 6 | 62 | 16 | EEG, Resting +Mathematical | LZC (high) | Done | - |
| 7 | 30 | 2 | EEG, Resting | CD (high) | - | |
| 8 | 15 | 148 | MEG, Resting | LZC (high) | Done | - |
| 5 | 24 | - | Actigraph | Sample Entropy (high) | Done | - |
| 12 | 23 | 16 | EEG, Resting | CD (high) | Done | - |
| 13 | 12 | 3 | EEG, Resting | Mobility (high) | Done | - |
| 14 | 18 | 30 | EEG, Resting | HFD (high) | - | - |
| 15 | 13 | - | fMRI, Resting | Spectral entropy, HurstExponent (high) | - | - |
| 18 | 22 | - | EEG,Resting | MSE | - | - |
| 19 | 31 | 6 | EEG,Resting | CD, Kolmogorov (high) | - | 0.861 |
| Proposed Method | 48 | 16 | EEG, Resting +two different mental task(visual stimulus) | InEn, ShEn, SpEn, ApEn, HFD, KOL (high+more high during mental task | Done | 0.885 |
Table 4. Performance Report of the various studies.
Conclusions
In the present work, from the EEG under the conditions of rest and during stimuli, significant complexity features are derived and analyzed for the schizophrenia condition in comparison with normal subjects. Different combinations of significant complexity features are used for classification. It is inferred that the classifiers with complexity features derived from stimulus 1 and stimulus 2 conditions give better accuracy. In this study, schizophrenia subjects are not categorized according to their symptoms and gender. Although this study is carried out with newly designed paradigm to stimulate mental activity (cognitive process), some of the features correlate with previous findings. This study focuses on the EEG signal complexity during rest and mental activity and concludes parameter measures during both resting and mental activities are helpful to identify schizophrenia. This study can facilitate the diagnostic interpretation of EEG for schizophrenia condition.
Acknowledgement
The study was approved by the Institutional Ethics Committee of Madras Medical College, Chennai, India and the work was carried out in Institute of Mental Health, Chennai, India. We would like to thank the Director, Institute of Mental Health, Chennai, India who helped us to bring out this study. Our special hearty thanks to Dr. M. Malaiappan who supported us by providing information in data interpretation and Dr. Poornachandrika who provided support in coordinating physicians to provide enough number of subjects for this study and enough guidelines for this work. We also like to thank the Doctors, Dr. Vanishree, Dr. Sujatha, Dr. Arvind, Dr. Arun, Dr. Jayakrishnaveni, Dr. Sabitha, Dr. Sivalingam and Dr. Saravanan who provided patient support. We also would like to thank the technician, Mrs. Umamaheswari for her support in EEG recording procedure. We also thank all the staff members who provide support for this study.
References
- Jeong J, Kim DJ, Chae JH, Kim SH, Ko HJ, Paik IH. Nonlinear analysis of the EEG of schizophrenics with optimal embedding dimension. Med Eng Physic 1998; 20: 669-676.
- Fernandez A, Andreina Mendez M, Hornero R, Ortiz1 T, Lopez-Ibor JJ. Analysis of brain complexity and mental disorders. Actas Esp Psiquiatr 2010; 38: 229-238.
- Anier A, Lipping T, Ferenets R, Puumala P, Sonkajarvi E, Ratsep I, Jantti V. Relationship between approximate entropy and visual inspection of irregularity in the EEG signal, a comparison with spectral entropy. Br J Anesthesia 2012; 109: 928-934.
- Bhattacharya J. Complexity analysis of spontaneous EEG. Acta Neurobiol Exp 2000; 60: 495-501.
- Hauge ER, Berle JO, Oedegaard KJ, Holsten F, Fasmer OB. Nonlinear Analysis of Motor Activity Shows Differences between Schizophrenia and Depression: A Study Using Fourier analysis and Sample Entropy. PLoS ONE 2011; 6: e16291.
- Li Y, Tong S, Liu D, Gai Y, Wang X, Wang J, Qiu Y, Zhu Y. Abnormal EEG complexity in patients with schizophrenia and depression. Clin Neurophysiol 2008; 119: 1232-1241.
- Bob P, Chladek MS, Glaslova K, Fedor-Freybergh P. Neural complexity, dissociation, and schizophrenia. Med Sci Monit 2007; 13: HY1-5.
- Fernandez A, Lopez-Ibor MI, Turrero A, Santos JM, Moron MD, Hornero R, Gomez C, Mendez MA, Ortiz T, Lopez-Ibor JJ. Lempel-Ziv complexity in schizophrenia: A MEG study. Clin Neurophysiol 2011.
- Lian-Yi Z, Chong-Xun Z. Lempel-Ziv complexity changes and physiological mental fatigue level during different mental fatigue state with spontaneous EEG. Health 2009.
- Mendez MA, Zuluaga P, Hornero R, Gomez C, Escudero J, Rodriguez-Palancas A, Ortiz T, Fernandez A. Complexity analysis of spontaneous brain activity: effects of depression and antidepressant treatment. J Psychopharmacol 2012; 26: 636-643.
- Yli-Hankala A. Entropy of Electroencephalogram as a Measure of Anesthetic Depth. Business Briefing: long-term health care; 2004.
- Carlino E, Sigaudo M, Pollo A, Benedetti F, Mongini T, Castagna F, Vighetti S, Rocca P. Nonlinear analysis of electroencephalogram at rest and during cognitive tasks in patients with schizophrenia. J Psychiatry Neurosci 2012; 37: 259-66.
- Elbert T, Lutzenberger W, Rockstroh B, Berg P, Cohen R. Physical Aspects of the EEG in Schizophrenics. Biol Psychiatry 1992; 32: 595-606.
- Raghavendra BS, Dutt ND, Halahalli HN, John JP. Complexity analysis of EEG in patients with schizophrenia using fractal dimension. Physiol Meas 2009; 30: 795-808.
- Sokunbi MO, Gradin VB, Waiter GD, Cameron GG, Ahearn TS, Murray AD, Steele DJ. Nonlinear Complexity Analysis of Brain fMRI Signals in Schizophrenia. PLoS ONE; 9: e95146.
- Georgiev S, Minchev Z, Christova C, Philipova D. EEG Fractal Dimension Measurement before and after Human Auditory Stimulation. Bioautoma 2009; 12: 70-81.
- Klonowski W, Olejarczyk E, Stepien R. Sleep-EEG Analysis Using Higuchi’s Fractal Dimension. International Symposium on Nonlinear Theory and its Applications (NOLTA2005) Bruges 2005; Belgium.
- Takahashi T, Cho RY, Mizuno T, Kikuchi M, Murata T, Takahashi K, Wada Y. Antipsychotics reverse abnormal EEG complexity in drug-naive schizophrenia: A multiscale entropy analysis. Neuroimage 2010; 51: 173-182.
- Zhao Q, Hu B, Li Y, Peng H. An alpha resting EEG study on nonlinear dynamic analysis for Schizophrenia. Neural Engineering 2013;IEEE/EMBS Conference,6-8 Nov 2013,484-488,sandiego,California.
- Roschke J, Fell J. Spectral analysis of P300 Generation in depression and Schizophrenia. Neuropsychobiol 1997; 35: 108-114.
- Kamath C. Entropy-Based Algorithm to Detect Life Threatening Cardiac Arrhythmias Using Raw Electrocardiogram Signals. Middle-East J Sci Res 2012;12: 1403-1412.
- Ferenets R, Anier A. Comparison of Entropy and Complexity Measures for the Assessment of Depth of Sedation. IEEE Transact Biomed Eng 2006; 53: 1067-1077.
- Sabeti M, Katebi S, Boostani R. Entropy and complexity measures of EEG signal classification of Schizophrenic and control participants. Artific Intel Med 2009; 47: 263-274.
- Gomeza C, Mediavilla A, Hornero R, Abasolo D, Fernandez A. Use of the Higuchi’s fractal dimension for the analysis of MEG recordings from Alzheimer’s disease patients. Med Eng Physic 2009; 31: 306-313.
- Labate D, Foresta FL, Morabito G, Palamara I, Morabito FC. Entropic Measures of EEG Complexity in Alzheimer’s disease through a Multivariate Multi scale Approach. IEEE Sensor J 2013; 13: 3284-3292.
- Kothari CR, Garg G. Research Methodology Methods and Techniques. 3rd ED: New Age International Publishers 2014; India.
- Highley RJ, Walker A, Margaret ME, Mcdonald B, Harrison PJ, Crow TJ. Schizophrenia and the frontal lobes: Post-mortem stereological study of tissue volume. Br J Psychiatry 2001; 178: 337-343.
- Yildiz M, Borgwardt SJ, Berger GE. Parietal Lobes in Schizophrenia: Do the Matter? Schizophrenia Res Treat 2011.