Research Article - Journal of Fisheries Research (2019) Volume 3, Issue 1
Economics of Value Addition in Fish in Manipur State of India: Empirical Analysis
Chinglen Meitei N1, Ram Singh2*, Feroze SM2
1Department of Agricultural Economics, CoA, UBKV, Cooch Behar, India
2SSS, CPGS, Central Agricultural University (Imphal), Umiam-793 103, Meghalaya, India
- *Corresponding Author:
- Dr. Ram Singh
Professor SSS, CPGS
Central Agricultural University Imphal Umiam-793 103, Meghalaya, India
Tel: +91-9402197624
E-mail: ramsingh.cau@gmail.com
Accepted on March 02, 2019
Citation: Chinglen Meitei N, Singh R, Feroze SM. Economics of value addition in fish in Manipur state of India: Empirical analysis. J Fish Res. 2019;3(1):18-25.
DOI: 10.35841/fisheries-research.3.1.18-25
Visit for more related articles at Journal of Fisheries ResearchAbstract
Fishery is a significant sector of the Indian economy from the point of view of food supplies, foreign exchange and also for its potential to generate employment. The North Eastern (NE) region of India has been recognized as a global hot spot of fresh water bodies. The annual growth rate of fish production in NE India registered a positive growth over the years indicating a healthy trend. The fish production of Manipur is mostly contributed by the Loktak Lake which is the largest freshwater lake in NE India. Population of Manipur consumes fish in various forms which includes fermented, sun dried, smoked, pickles, freshly cooked. Keeping in view present research paper in an overview to assess the value addition at each stage of marketing of fish of Loktak Lake. A sample of 60 numbers of fishermen and 10 numbers of different intermediaries were taken into consideration for this research. A standard analytical technique has been employed to analyse the data to draw in inferences from the results. The findings of the paper demonstrated that the local trader -cum- retailer earned a huge profit which was higher than the profit earned by the fishermen. Therefore, the study recommends encouraging the maximum involvement of fishermen in value addition process at their level to harvest the higher profits. The state fish department must lead to encourage the fishermen with latest tools and techniques for value addition.
Keywords
Value, Addition, Fish, Loktak Lake, Manipur and assessment.
Introduction
Fish is considered as the cheapest source of high quality animal protein that can be produced easily for human consumption. It is highly recommended for children, pregnant women and adults because of its high level protein, digestibility and lack of cholesterols, preventive resource for heart attack or failure and stroke [1]. As a whole, fish provides essential nutrition for over one billion people including at least 50 per cent of the animal protein for 400 million people from the poorest countries [2]. Fishery science and agriculture are considered as the sunshine sector of the global economy which provides food, nutrition, income and livelihood for hundreds of millions of people around the globe [3]. Human consumption has significantly increased from 67 percent in 1960s to 87 percent (more than146 MT) in 2014. World trade in fish and fishery products also grown significantly in value terms with exports rising from US $ 8 billion in 1976 to US $ 148 billion in 2014 at an annual growth rate of 4.0 per cent [4].
Fishery is a significant sector of the Indian economy from the point of view of food supplies, foreign exchange and also for its potential to generate employment [5]. India is rich in fish fauna representing 11.72 per cent of species, 23.96 per cent of genera, 57 per cent of families and 805 orders of the world [6]. Also India is blessed with a rich diversity of freshwater fishes both in Western Ghats and North Eastern Hills [7]. India is a major producer of fish in the world through aquaculture. The total fish production during 2013-2014 was 9.58 MT with 6.14 MT from inland sector and 3.44 MT from marine sector contributing 5.68 per cent of the global fish production [8]. During 2013-14 quantity of exports of fishery products were 0.98 MT with a value of Rs.30213.26 crores. Out of total fish production in India marketing fresh constitute about 5.81 MT (74.27%), freezing 0.94 MT (12.12%), curing 0.33 MT (4.25%), canning 0.04MT (0.54%), reduction 0.30 MT (3.85%), miscellaneous purposes 0.15 MT (1.93%), offal for reduction 0.0006 MT (0.01%), unspecified 0.07 MT (0.91%) and others 0.16 MT (2.15%) respectively [9]. Major inland fish producing states are Andhra Pradesh (1.9 MT) followed by West Bengal (1.6 MT), Gujarat (0.8 MT), Kerala (0.7 MT) and Tamil Nadu (0.6 MT) respectively during 2013-14 [3].
The North Eastern (NE) region of India has been recognized as a global hot spot of fresh water biodiversity [10]. Among NE states, Assam registered highest fish production (254.27 thousand tonnes), followed by Tripura, Manipur, Nagaland, Meghalaya, Arunachal Pradesh, Mizoram and Sikkim [11]. During 2013-14, the total inland fish production in India was 61.40 lakh tonnes, to which contribution of NE India is only 3.59 lakh tones with the productivity of 600 kg per ha [3]. The annual growth rate of fish production in NE India registered a positive growth over the years indicating a healthy trend [12].
In the state of Manipur fish production mostly contributed by the Loktak Lake which is the largest freshwater lake in NE India and the only floating lake in the world [13]. Population of Manipur consumed fish in various forms which includes fermented, sun dried, smoked, pickles, freshly cooked etc. [14]. The production of fish in the state was 30.50 thousand tonnes of which Bishnupur district have the highest production of 9.31 thousand tonnes [15]. The cultured fishes include Catla, Rohu, Mrigal, Bighead, Pengba and some common carp species namely Silver carp, Grass carp, Common carp etc. Among the different forms of fish in Manipur, fresh water local fish is most preferred by consumer (32.22%), followed by fermented (22.77%), frozen (22.22%), smoked (15.55%) and miscellaneous including tin fish (7.22%), respectively [14].
The state is having the potential of higher fish production, can also provide various value added fish products to consumers through various marketing channels and the different roles also can be undertaken by various market functionaries in Manipur. Among the NE states, Manipur registered third highest fish production. The fish production of the state was mostly contributed by the Loktak Lake which is the largest freshwater lake in north east India and the only floating lake in the world. All the major rivers in Manipur drain into the Loktak Lake and it therefore acts as an accumulation point of varieties of fishes. The livelihoods of fishermen inhabited around the Loktak Lake are entirely depending on the fishes caught from the lake. They catch the fishes at any time from any part of the lake since Government has not set any limited fishing area for the fishermen. It will help to identify the efficient marketing channel to be employed for marketing of fish and value added products. An overall analysis will provide a policy document to develop a policy option for upliftment of livelihood and income of the different stakeholders including fishermen involved in business of fish and fish products at Loktak Lake of Manipur. Therefore, keeping in view the above facts the present paper is an overview of value addition in fish at its different stages of marketing.
Material and Methods
Locale of research
The present study was conducted in the state of Manipur. Fish farming is mainly confined in all the districts of Manipur but it is mostly concentrated in the four districts of valley regions i.e., Imphal-East, Imphal-West, Bishnupur and Thoubal due to the availability of good marketing structure and higher demand of fish. The total water spread areas of fisheries resources extends to about 56.46 thousand hectares which includes ponds/ tanks (11.44 thousand ha.), lakes/beels (24.43 thousand ha.), river/streams (13.89 thousand ha.), low lying paddy fields (5.74 thousand ha.) and reservoirs (0.97 thousand ha.) respectively [11]. Catla, Rohu, Mrigal, Bighead, Pengba and some carp species namely Silver carp, Grass carp and Common carp were mainly cultured in the state.
Manipur the “Jewel of India” or “Switzerland of the East’ has peculiar features like endemic plants, animals and scenic beauties [16]. Loktak Lake is one of them. Loktak Lake shines at the center of Manipur, a state in north eastern India that’s also known as “Paradise unexplored”. Loktak (lok means “stream” and tak means “the end”) lies where the journey of several streams and rivers come to an end. It is a natural treasure for Manipur and plays a significant role in the economy of the state, as Loktak is the main source for power, irrigation, livelihood of fishermen and drinking water for the state. The Loktak Lake is the largest natural wetland in Eastern India which is located about 48 km from Imphal city. The lake is spreading 32 km in length and 13 km in width with a mean depth of 2.7 m [17]. The livelihoods of fishermen inhabited around the Loktak Lake were entirely depending on the fishes caught from the lake.
All the major rivers in Manipur drain into the Loktak Lake and it therefore acts as an accumulation point of varieties of fishes. The livelihoods of fishermen inhabited around the Loktak Lake were entirely depending on the fishes caught from the lake. Several types of fishing gears are used in Loktak Lake [12]. Loktak is home for 48 different species of fishes under 5 order 17 family 33 genera (Table 1).
| Common name | Scientific name | Local name |
|---|---|---|
| Indian carpletmola | Amblypharyngodonmola | Mukanga |
| Asiantic snake head | Channaorientalis | Meitei ngamu |
| Striped snake head | Channastriatus | Porom |
| Bar eyed gody | Glossogobiusgiuris | Ngainonngamu |
| Stinging catfish | Heteropneutesfossilis | Ngachik |
| Common barb | Puntiussophore | Phabounga |
| Colisa | Trichogasterlalious | Ngabemma |
| Indian glass fish | Parambassisranga | Ngamhai |
| Climbing perch | Anabas testudineus | Ukabi |
| Tilapia | Oreochromismossambicus | Tunghanbi |
| Kandala | Notopterusnotopterus | Ngapai |
| Day’s mystus | Mystusbleekeri | Ngasep |
| Fresh water eel | Monopterusalbus | Ngaprum |
| Loktak loach | Lepidocephalichthysirrorata | Nganap |
| Scale carp | Cyprinuscarpio | Puklaobi |
| Silver carp | Hypophthalmichthysmolitrix | Silver |
| Rohu | Labeorohita | Rou |
| Grass carp | Ctenopharyngodonidella | Napichabi |
| Mrigal | Cirrhinusmrigala | Mrigal |
| Catla | Catlacatla | Catla |
Table 1. Fish species commonly reported in Loktak Lake of Manipur.
Sampling
Four villages namely Karang, Ithing, Thanga and Moirang have been selected purposively for the study based on maximum number of fishermen engaged in Loktak Lake. A sample of 60 respondents and 10 numbers of retailers cum local traders were drawn using randomly proportionate to size of total number of fishermen as well as marketing intermediaries engaged in the respective village at Loktak Lake. The primary data pertained to the prevailing price in study area during calendar year of 2016- 17.
Data and Analytical techniques
Marketing cost: The total cost incurred on marketing either in cash or in kind by the producer seller and by the various intermediaries involved in the sale and purchase of commodities till the commodities reaches the ultimate consumer, may be computed as:
C = CF + ΣCmi
Where,
C=Total cost of marketing of the commodity
CF=Cost paid by the producer at the time the produce leaves the farm till he sells it, and
Cmi=Cost incurred by the ith middleman in the process of buying and selling the product.
Marketing Margin of Middlemen: It is the difference between the total payments (cost+purchase price) and receipts (sale price) of the middlemen (ith agency). It has been worked out as:
Where,
Ami=absolute marketing margin of ithmiddlemen
Pri= total value of receipts per unit (sale price)
Ppi=purchased value per unit (purchased price)
Cmi=cost incurred on marketing per unit.
Percentage margin of middleman: To work out the percentage share of margin of middleman following formula has been used:
Percentage margin of middleman
Where,
PRi=Total value of receipts per unit of produce (sale price)
Ppi=Purchase value of goods per unit of produce (purchase price)
Cmi=Cost incurred in marketing per unit.
Thus it includes the profit of the middleman and the returns.
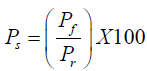
Producer’s share in consumer’s rupee: The price received by the producer expressed in terms of percentage of the retail price (i.e., the price paid by the consumer) is the producer’s share.
Ps = 
Where,
Ps=Producer’s share in the consumer rupee.
Pf=Price received by the fisherman per unit of output
Pr=Retail price per unit of output.
Therefore, the higher the percentage of the producer’s share in consumer’s rupee, higher is the efficiency of the marketing channel.
Price spread: It is the difference between the price paid by consumer and the price received by the producer for an equivalent quantity of farm produce. It was calculated by using the following formula:
Where,
Ps =Producer’s share in the consumer rupee.
Pf=Price received by the fisherman per unit of outputs
Pr=Retail price per unit of output, and
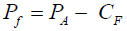
Where,
Pf=Net price received by producer
PA=Wholesale price
CF=Marketing cost incurred by producer
Hence,
Price spread = 
Where,
Pc=price paid by consumer
Pf= price received by the fisherman
Marketing efficiency: It is defined as the effectiveness or competence with which a market structure performs its designated function. This will be computed using the Acharya’s modified marketing efficiency (MME) approach [18] given as:
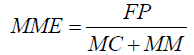
Where,
MME=modified measure of marketing efficiency
FP=price received by fisherman
MC=marketing cost
MM=marketing margins.
The data on value addition by intermediaries including fish growers were recorded by taking into consideration of various by-products prepared at each level of marketing for the calendar year 2016-2017. The formula to work out the value addition by each stakeholder is worked out as under:
Value addition=Selling price of the product – Cost of the total inputs [19].
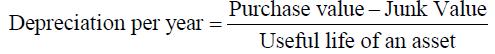
The depreciation annually of various implements and tools like lift net, dip net, gill net, scoop net, long line and box traps were used by fishermen has been calculated by using following formulae:
Results and Discussion
Marketing pattern of the fish
For any business or an entrepreneur, successiveness depends on its marketing aspects. Marketing is considered as an important aspect through which the produce is disposed from the fisherman to the point of consumption. Fish marketing is un-organized in the state of Manipur. Hence, marketing of captured fish from Loktak Lake is mostly dominated by the local traders known as uunja. The producer’s surplus, disposal pattern though various marketing channels of fish, price spread of identified channels and marketing efficiency of the respective channels were studied.
Producer’s surplus of captured fish
The quantity retained by the respondents in the study area was found to be 38.57 kg, in which family consumption contributes maximum with 2.32 per cent followed by social obligations (1.10%), payment in kind (0.84%) and spoilage (0.57%) respectively. The marketable and marketed surplus of captured fish was found to be equal (Table 2). These findings were in the conformity of research finding of Mog R [20] in which found that the marketed surplus and marketable surplus was more or less same. This may be due to less retention capacity and fish being perishable in nature, so immediate selling after capturing was required. Therefore, analysis showed fish as an important component of the diet of the fishermen of the state of Manipur in India.
| Particulars | Quantity (in kg) | Quantity (%) |
|---|---|---|
| Total production | 798.85 | 100 |
| Retained for | ||
| a) Family consumption | 18.5 | 2.32 |
| b) Payment in kind | 6.75 | 0.84 |
| c) Social obligation | 8.75 | 1.1 |
| d) Spoilage | 4.57 | 0.57 |
| Total (a to d) | 38.57 | 4.83 |
| Marketable surplus | 760.28 | 95.17 |
| Marketed surplus | 760.28 | 95.17 |
Table 2. Producer’s surplus and utilization of captured fish from Loktak Lake.
Marketing channels of fish in the state of Manipur
Captured fish from the fishermen to the ultimate consumer was passing through three major marketing channels which were identified as
Channel-I: Producer→ Local trader cum Retailer→ Consumer (41.67%)
Channel-II: Producer→ Consumer (33.33%)
Channel-III: Producer→ Wholesaler→ Retailer→ Consumer (25%).
The maximum of the captured fish (41.67%) is disposed off through channel-I (Producer→ Local trader (uunja) cum Retailer→ Consumer) followed by channel- II (Producer→Consumer) and channel-III (Producer→ Wholesaler→ Retailer→ Consumer) with 33.33 per cent and 25 per cent, respectively. Hence, the channel-I (Producer→ Local trader (uunja) cum Retailer→ Consumer) was the most prominent marketing channel [21,22] for fish in the state of Manipur (Table 3).
| Marketing channel | Quantity | Quantity |
|---|---|---|
| ( in kg) | (%) | |
| Channel-I | 316.81 | 41.67 |
| Channel-II | 253.4 | 33.33 |
| Channel-III | 190.07 | 25 |
| Total | 760.28 | 100 |
Table 3.Disposal pattern of fish through different marketing channels
Marketing cost and margin of captured fish
Under the channel-I (Producer→ Local trader cum Retailer→ Consumer), the local trader cum retailer purchased the fish from the fisherman’s home and further sold to the consumers. The net price received by the fisherman was worked out to be of Rs 220 per kg, which constituted of 91.67 per cent of consumer’s rupee. The marketing cost incurred by the local trader on transportation (1.19%), loading and unloading (0.64 %) and grading (0.40%) of consumer’s price. Transportation cost was found to be highest among the cost incurred by the local trader cum retailer in fish marketing. The local trader earned marketing margin of Rs.14.65 per kg which contributed of 6.10 per cent of consumer’s rupee. The price paid by the consumer under this channel was Rs.240 per kg. Another channel-II (Producer→ Consumer) which is called as ‘direct marketing’, the net price received by the fisherman was Rs.242.83 per kg of which accounted of 97.13 per cent of consumer’s rupee. Similar, results were found by Kumar, et al. [23] in their study in Bharatpur district of Rajasthan of India and Singh [24] in Tripura state of India. The remaining (2.87%) contributed by transportation cost in consumer’s rupee. The price paid by the consumer in this channel was recorded of Rs.250 per kg. Similarly, Channel- III (Producer→ Wholesaler→ Retailer→ Consumer) where the fisherman incurred Rs.7.17 per kg as marketing cost (2.66%). The net price received by the fisherman was observed to be of Rs.192.83 per kg which was accounted to be of 71.42 per cent of the consumer’s rupee. The wholesaler incurred of Rs.2.28 per kg as marketing cost of which loading and unloading charge (0.47%), grading (0.34%) and market fees (0.04%) were the items of cost. The margin of the wholesaler has been accounted to be of Rs.27.72 per kg which was shared 10.27 per cent in the consumer’s rupee. Cost incurred by the retailer was Rs.3.76 per kg which included transportation (0.52%), loading and unloading (0.47%) and grading (0.21%). The retailer’s margin has been accounted to be of 13.42 per cent of the consumer’s rupee (Table 4).
| Particulars | Channel-I | Channel-II | Channel-III |
|---|---|---|---|
| Net price received by producer | 220.00 | 242.83 | 192.83 |
| (91.67) | (97.13) | (71.42) | |
| Cost incurred by fisherman | |||
| a) Assembling | - | - | - |
| b) Transportation | - | 7.17 | 7.17 |
| (2.87) | (2.66) | ||
| Total (a to b) | - | 7.17 | 7.17 |
| (2.87) | (2.66) | ||
| Producer’s sales price | 220.00 | 250.00 | 200.00 |
| Wholesaler’s price | - | - | 200.00 |
| Cost incurred by the wholesaler | |||
| a) Transportation | - | - | - |
| b) Loading and unloading | - | - | 1.26 (0.47) |
| c) Grading | - | - | 0.92 (0.34) |
| d) Weighing | - | - | - |
| e) Market fees (@ Rs.0.10/kg) | - | - | 0.1 |
| (0.04) | |||
| Total (a to e) | - | - | 2.28 |
| (0.84) | |||
| Wholesaler margin | - | - | 27.72 |
| (10.27) | |||
| Local trader price | 220.00 | - | - |
| Cost incurred by local trader cum retailer | |||
| a) Transportation | 2.86 (1.19) |
- | - |
| b) Loading and unloading | 1.54 | - | - |
| (0.64) | |||
| c) Grading | 0.95 | - | - |
| (0.4) | |||
| d) Commission (@ Rs.0.50 per kg) | - | - | - |
| Total (a to d) | 5.35 | - | - |
| (2.23) | |||
| Local trader margin | 14.65 | - | |
| (6.1) | |||
| Cost incurred by retailer | |||
| a) Transportation | - | - | 1.41 (0.52) |
| b) Loading and unloading | - | - | 1.28 (0.47) |
| c) Grading | - | - | 0.57 |
| (0.21) | |||
| d) Commission (@ Rs.0.50/kg) | - | - | 0.5 |
| (0.19) | |||
| Total (a to d) | - | - | 3.76 |
| (1.39) | |||
| Retailer’s margin | - | - | 36.24 |
| (13.42) | |||
| Price paid by the consumer | 240.00 | 250.00 | 270.00 |
| (100.00) | (100.00) | (100.00) |
Note: Figures in parentheses are percentage to the consumer’s price.
Table 4. Marketing cost and margin of captured fish through different channel(Rs/kg).
Hence, the channel-I (Producer→ Local trader cum Retailer→ Consumer) was found to be most popular as maximum of the captured fish were disposed off through this channel-I [21,22]. Therefore, strengthening of the channel-I through physical interventions was the need of hours.
Price spread of captured fish
The net price received by the fisherman was highest under channel-II (Rs.242.83 per kg) which has accounted of 97.13 per cent of consumer’s rupee, followed by channel-I (91.67%) and channel-III (71.42%). Among the channels, channel-I was found to be more efficient in which marketing cost (2.23%) was found to be least followed by channel-II (2.87%) and channel-III (4.89%). Hence, increased marketing cost reduced the fisherman’s share in consumer’s rupee. Subsequently, the fisherman received higher share in consumer’s price in channel- II (97.13%) which was mainly due to absence of intermediaries [23] and less marketing cost incurred by the fisherman (Table 5). On the other hand, less net price received by the fisherman and higher price spread under channel-III [22] was mainly due to more margins earned by intermediaries involved in the marketing process under the channel.
| Particulars | Channel-I | Channel-II | Channel-III |
|---|---|---|---|
| Net price received by fisherman (Rs) | 220.00 (91.67) | 242.83 (97.13) | 192.83 (71.42) |
| Marketing cost | 5.35 (2.23) | 7.17 (2.87) |
13.21 (4.89) |
| Marketing margin | 14.65 (6.10) | - | 63.96 (23.69) |
| Price spread | 20.00 (8.33) | 7.17 (2.87) |
77.17 (28.58) |
| Consumer’s price | 240.00 (100.00) |
250.00 (100.00) |
270.00 (100.00) |
| Producer’s share in consumer rupee (%) | 91.67 | 97.13 | 71.42 |
Note: Figures in parentheses are percentage to the consumer’s price
Table 5. Channel wise price spread of captured fish (Rs/kg).
Marketing efficiency
As it is apparent from the analysis that marketing cost was highest in channel-III (Rs.13.21/kg), followed by channel-II (Rs.7.17/kg) and channel-I (Rs.5.35/kg). The average selling price of fisherman was observed to be highest in channel-II (Rs.250.00/kg), followed by channel-I (Rs.220.00/kg) and channel-III (Rs.200.00/kg) [22,23]. Marketing efficiency was found to be highest in channel-II (34.86) which was due to less marketing cost and no involvement of any intermediaries followed by channel-I (11.00) and channel-III (2.59). Highest marketing cost and marketing margin (profit earned by intermediaries in the channel) were observed in channel-III, consequently the marketing efficiency was least [21] (Table 6).
| Particulars | Channel-I | Channel-II | Channel-III |
|---|---|---|---|
| Marketing cost | 5.35 | 7.17 | 13.21 |
| Marketing margin | 14.65 | - | 63.96 |
| Average selling price (Rs) | 220.00 | 250.00 | 200.00 |
| Marketing efficiency | 11.00 | 34.86 | 2.59 |
| Rank | II | I | III |
Table 6. Marketing efficiency of different channels (Rs./kg).
Even though channel-I was the most popular in the state of Manipur of India as the maximum of the fish production has been disposed-off through the Channel-I, but the marketing efficiency was lesser than the other channel-II. This was because of higher marketing cost and marketing margin under the channel-I. Thus, the principle of ‘lesser the price spread better will be marketing efficiency’ implies in channel-II and followed by Channel-I and Channel-III.
Value addition
Intermediaries involved in value addition: It was observed that 55.71 per cent of the fishermen and 7.14 per cent of retailers cum local traders were involved in the value addition (smoked) of fish in the study area. Remaining fishermen were involved to sale fresh fish and all the intermediaries have also performed fresh fish selling activity. Hence, it can be concluded that majority of the intermediaries (62.85 %) in the study area performed the value addition (smoked) of fish before the produce reached to the ultimate consumer (Table 7). Similar findings were found by Vishwanath, et al. [25] in which it was observed that due to lack of transport and cold storage facilities in the hill areas smoking method have been practiced from early times for preservation.
| Intermediaries | Total respondents (No.) | Respondents (No) | Respondent performing value addition (%) | ||
|---|---|---|---|---|---|
| Fresh sale | Value addition (smoked) | ||||
| Fishermen | 60 | 21 | 39 | 55.71 | |
| Retailer cum local traders | 10 | 5 | 5 | 7.14 | |
| Total | 70 | 26 | 44 | 62.85 | |
Table 7. Intermediaries involved in conversion of fresh fish to smoked fish.
Investment and maintenance cost of crafts and gears: Various types of fishing crafts and gears are used by the fishermen to catch fish in Loktak Lake of Manipur [26]. To estimate the unit production cost of fish involved in value addition process the investment and maintenance cost of crafts and gears were recorded. The depreciation per annum as well as per day of each of implements was estimated of Rs.2014.41 and Rs.5.52 per day, respectively as an investment and maintenance cost of crafts and gears for catching fish in Loktak Lake (Table 8).
| Implements | Purchase value | Junk values | Expected years |
Overhead charges |
Dep/year | Dep/day | |||
|---|---|---|---|---|---|---|---|---|---|
| Canoes | 13471.67 | 10341.67 | 14.63 | 95.83 | 330 | 0.90 | |||
| Lift net | 475 | 251.79 | 4.32 | 38.57 | 83.21 | 0.23 | |||
| Dip net | 5276.31 | 3497.37 | 4.93 | 50.65 | 422.6 | 1.16 | |||
| Gill net | 386 | 201.85 | 2.43 | 0 | 217.78 | 0.60 | |||
| Scoop net | 2467.74 | 1419.36 | 5.32 | 72.58 | 278.99 | 0.76 | |||
| Multi-pronged spear | 2300 | 1466.67 | 7.73 | 70 | 185.07 | 0.51 | |||
| Long line | 1333.33 | 600 | 2.33 | 100 | 427.78 | 1.17 | |||
| Box traps | 271.43 | 100 | 3.5 | 20 | 68.98 | 0.19 | |||
| Total | 2014.41 | 5.52 | |||||||
Note: Dep- depreciation
Table 8. Investment and maintenance cost of crafts and gears in fishing (Rs).
Cost estimation in value addition: For the fisherman maximum cost apart from price of fresh fish was the labour charge of fisherman which contributed about 23.38 per cent of the total cost, followed by female labour charge (10.24%), firewood (6.28%), others (2.22%), children labour charge (2.03%) and depreciation on fishing implements (0.62%). The total cost incurred was Rs.406.12 per kg and the final selling price of the value added product was Rs.420.00 per kg. So, the fisherman finally earned a net profit of Rs.11.51 per kg after value addition. In case of local trader cum retailers maximum cost incurred was in the purchase of fresh fish which contributed about 71.96 per cent to the total cost incurred, followed by labour charge of the female involved in value addition (13.17%), firewood (8.10%), others that includes loss due to damage of product (2.85%), labor charge of children (2.61%) and purchase of wire maze (1.35%). The total cost incurred by the local trader cum retailer was found to be Rs.333.53 per kg of fish and the final selling price of the value added product was Rs.450.00 per kg (Table 9). Hence, the local trader cum retailer finally earned a profit of Rs.116.47 per kg which was comparatively higher than the profit earned by the fisherman [27]. This higher selling price after value addition is mainly because of higher purchasing price. The results were supported by Devi [26] and found that value added fish products were getting 68 per cent more return than non- value added selling of fish.
| Particulars | Intermediaries | |
|---|---|---|
| Fisherman | Local trader-cum retailer | |
| (a) Price of fresh fish per kg | 220 | 240 |
| (55.17) | (71.96) | |
| (b) Production cost | ||
| i) Depreciation on fishing implements | 2.52 | - |
| (0.62) | ||
| ii) Labour charge for catching fish (male) | 94.97 | - |
| (23.38) | ||
| Sub total | 97.49 | - |
| (24.01) | ||
| (c) Value added cost Labour charges for smoking | ||
| i) Female | 41.6 | 43.91 |
| (10.24) | (13.17) | |
| ii)Child | 8.26 | 8.71 |
| (2.03) | (2.61) | |
| Wire maze | 4.28 | 4.51 |
| (1.05) | (1.35) | |
| Fire woods | 25.49 | 26.9 |
| (6.28) | (8.07) | |
| Others | 9.0 | 9.5 |
| (2.26) | (2.85) | |
| Sub total | 88.63 | 93.53 |
| (21.82) | (28.04) | |
| (c) Total cost incurred (a+b+c) | 408.49 | 333.53 |
| (100.00) | (100.00) | |
| Gain before value addition | 120.14 | - |
| (d) Selling price after value addition | 420.00 | 450.00 |
| Net profit after value addition (d-c) | 11.51 | 116.47 |
Note: Figures in parentheses are percentage to total cost incurred.
Table 9. Various costs involved in preparation of smoked fish (Rs/kg).
Conclusion
Hence, it is concluded that majority of the intermediaries in the study area performed the value addition (smoked) of fish before the produce reached to the ultimate consumer. Although the all fishermen of Loktak Lake could not take an advantage of value addition due to less resources with them. Therefore, involving all fishermen in value addition of fish may be an emerging opportunity to enhance the due share in consumers’ rupee. The local trader cum retailer earned a profit huge profit which was comparatively higher than the profit earned by the fishermen. Again it may be due to less accessible to technical knowhow of value addition by the fishermen. Therefore, the study recommends encouraging the maximum involvement of fishermen in value addition process at their level to harvest the higher profits. The state fish department must lead to encourage the fishermen with latest tools and techniques for value addition.
Acknowledgements
The authors of the paper are very much thankful to the Central Agricultural University, Imphal to facilitate the facilities to conduct this master research for partial fulfilment of degree in the discipline of Agricultural economics from which this manuscript has been prepared.
Compliance with Ethical standards
The authors declare that they have no conflict of interest on the content of manuscript and study undertaken.
Research involving human participants and informed consent
A clear expression of consent was obtained from the farmers/ informants who were interviewed for collection of primary data for present research study.
References
- Kareem RO. Analysis of economic efficiency of artisanal fisheries in Osun State, Nigeria. PhD Thesis. Obafemi Awolowo University. Ile-Ife. Osun State. Nigeria. 2011.
- WBG. The global program for fisheries: Strategic vision for fisheries and aquaculture. Agricultural and rural development department. The World Bank Group. Washington DC. 2011.
- Goswami C, and Zade VS. Statistical analysis of fish production in India. Int J Innov Res Sci Eng Technol. 2015;4(2):294-99.
- FAO. The State of World: Fisheries and Aquaculture. Fisheries Department. Rome. 2016.
- Acharya SK. Livelihood, income and productivity in fishery. Agrotech Publishing Academy. Udaipur. Rajasthan. 2009;11-15pp.
- Jayaram KC. The Freshwater Fishes of the Indian region. Narendra Publishing House. Delhi. 1999;27:509.
- MPEDA. Promoting the rainbow revolution of India. 2015.
- GoI. Annual report 2013-14. Department of Animal Husbandry, Dairying and Fisheries Ministry of agriculture. Govt. of India. New Delhi. 2014(a).
- GoI. Handbook on Fisheries Statistics. Department Of Animal Husbandry, Dairying and Fisheries, Ministry of Agriculture, Govt. of India, New Delhi. 2014(b).
- Kottelat M, Whitten T. Freshwater biodiversity in Asia with special reference to fish. Washington DC. 1996;17-22.
- Singh ND, Krishnan M, Sivaramane N, et al. Determination of Efficiency of Fish Farms in North-East India Using Data Envelopment Approach. Agricultural Economics Research Review. 2015;28(2): 329-37.
- Biaklun PK, Ajit Kumar N, Basavaraja N. Status of aquaculture and fisheries in Manipur. Fishing Chimes. 2009;29 (1):102-4.
- Devi SZ, Singh NR, Singh NA, et al. Fish production in Manipur-An economic analysis. Journal of Crop and Weed. 2014;10(2):19-23.
- Hoilenting, Sharma R, Sharma A, et al. Consumer demand for different forms of fish and fish products in Manipur, India. Indian Journal of Agricultural Marketing. 2015;29(2):129-34.
- GoM. Manipur State Profile. Annual administrative report. Govt. of Manipur. Imphal. India. 2015.
- Maibam S, Ngasepam RS, Ningthoukhongjam ID, et al. Checklist of fish species of Loktak Lake. Bishnupur District. Biological Forum. 2015;7(1):171-9.
- Trisal CL, Manihar Th. Loktak-The atlas of Loktak. Wetland International and Loktak Development Authority. New Delhi. India. 2004.
- Acharya SS, Agarwal NL. Agricultural Marketing in India. 5th Edition. Oxford and IBH Publishing. New Delhi. India. 2011;p48.
- Kohls RL, Uhls JN. Marketing of Agricultural Products. Macmillan Publishing Company. New York. USA. 1967.
- Mog R. Master thesis on economics of production of selected cultured fisheries in Gomati district of Tripura. Central Agricultural University. Imphal. Manipur. India. 2015.
- Prabhakar C, Thennarasu M. Efficiency evaluation of domestic fisheries marketing in Cuddalore district of Tamil Nadu. Indian Journal of Agricultural Marketing. 2012;26(2):65-75.
- Nath K. Production and marketing efficiencies of inland fisheries in North-East India: The Empirical study of Lohit and Lower Subansiri districts of Arunachal Pradesh. Int J Fish Aquat Stud. 2015;2(5):39-45.
- Kumar B, Prakash S, Kumar NR, et al. Marketing process, margins and price spread of fish in Bharatpur district of Rajasthan. Indian Journal of Agricultural Marketing. 2014;28(1):1-9
- Singh K. Price spread and marketing efficiency in marketing of cultured fish species in South Tripura District of Tripura. Indian Journal of Agricultural Marketing. 2008;22(2): 207-20.
- Vishwanath W, Lilabati H, Bijen M. Biochemical, nutritional and microbial quality of fresh and smoked mud eel fish Monopterus-a comparative study. Food Chem. 1998;61(1/2):15-19.
- Devi PKVV. Value chain management practices in marine fisheries: A case study of Andhra Pradesh. International Journal of Managing Value and Supply Chains. 2016;7(2):9-19.
- South GR, Morris C, Bala S, et al. Value adding and supply chain development for fisheries and aquaculture products in Fiji, Samoa and Tonga: Scoping study for Tilapia (Oreochromissp). Suva. Fiji: Institute of Marine Resources. School of Marine Studies. FSTE. USP. IMR Technical Report. 2012;18p.