Research Article - Biomedical Research (2021) Volume 32, Issue 3
Development of ACR quality control procedure for automatic assessment of spatial metrics in MRI
Ines Ben Alaya*, Mondher Telmoudi, Rania Guesmi, Mokhtar MarsLaboratory of Biophysics and Medical Technology, Higher Institute of Medical Technology of Tunis, Tunis El Manar University, 1006 Tunis, Tunisia.
- Corresponding Author:
- Ines Ben Alaya
Laboratory of Biophysics and Medical Technology
Higher Institute of Medical Technology of Tunis
Tunis El Manar University
1006 Tunis
Tunisia
Accepted date: June 10, 2021
Abstract
Quality control of Magnetic Resonance Imaging (MRI) equipment based on the American College of Radiology (ACR) protocol is a crucial tool for assuring the optimal functionality of the MRI scanner. This protocol includes the test of several parameters in particular spatial properties such as Slice position accuracy, high-contrast spatial resolution, and slice thickness accuracy. Those parameters are usually evaluated visually and manually using a workstation. As we know that Visual assessment is operator dependant and results may vary, so making the process automatic will reduce the errors and improve the accuracy. We propose in this study an automatic algorithm which is able to extract the three spatial proprieties. We tested our automated quality control process on ten MRI scanners. We assessed the performance of the proposed pipeline by comparing the measurements with the manual analysis made by three experienced MRI technologists. We also compared the results against the recommended values provided by the ACR quality assurance manual. Afterward, all data sets are quantitatively evaluated using the Pearson test by computing the correlation coefficient and the p-value. The comparison between our automatic quantitative algorithm and manual evaluation confirms the effectiveness of the proposed approaches. Accordingly, the results of the Pearson test showed that automated analysis correlated highly with manual analysis and the P-value was less than the significance level of 0.05. An interesting finding was that the total analysis time was significantly shorter than the time needed for manual analysis.
diagnostic imaging technique in the early detection of abnormal changes in tissues and organs. Producing high quality of MRI data is a crucial initial step for MRI image interpretation and for obtaining the maximum diagnostic information from the images. To ensure that the key goals of MRI are achieved, Quality Control (QC) should be performed using a standard MRI phantom [1,2].The American College of Radiology (ACR) phantom is widely used for quality assurance purpose [3]. The ACR protocol recommends the acquisition of phantom images to assess the quality of the MRI system. The ACR phantom uses a standardized imaging protocol with standardized MRI parameters. The scanning protocol of the ACR MRI QC procedure included three sets of sequences: a singleslice sagittal localizer, a set of 11-slice axial T1-weighted images and a set of 11-slice axial T2-weighted images [4]. Seven quantitative tests were measured including geometric accuracy, high-contrast spatial resolution; image intensity uniformity, percent-signal ghosting, slice thickness accuracy, slice position accuracy, and lowcontrast object detectability [5]. Recommended acceptance criteria are also included in the ACR protocol to assess the clinical relevance of quality assurance.
Usually, the ACR phantom images must be analyzed by an experienced operator according to the ACR instructions. That is, someone views the images, performs the associated tests using various on-screen measurement tools, and compares the results to the ACR values [6].
Nevertheless, the visual assessment of phantom image quality is operator dependent and may vary between operators and also for the same operator in different time points. Hence, overcoming these limitations is crucial for a more objective quality assessment [7,8]. Developing automatic analysis methods for the ACR phantom test would improve the detection of any scan malfunction, and would increase accuracy, its cost- effectiveness and objectivity [9]. Automatic image quality assessment has previously been studied on Positron Emission Tomography (PET) image quality [10]. Nowik et al. [11] also presented before a fully automatic QA process for CT scanners. DiFilippo [12] proposed automated procedure for evaluating gamma camera image quality by computing Contrast-to-Noise Ratio (CNR).
Previous studies have presented various solutions for ACR automatic QA of MRI with different aspects. Aldokhail [13] proposed an automated method for Signal to Noise Ratio (SNR) analysis using model-based noise determination. Panych et al. [14] demonstrated that the automatic analysis of geometry measurement was more accurate and consistent than manual analysis. Sewonu et al. [15] proposed to automate two measurements, which are geometric accuracy and slice thickness accuracy. For measuring the slice thickness test, the author used the two thin inclined slabs of signal- producing material which are inserted in the phantom. Ramos et al. [16] proposed to use the Machine Learning to automate the ACR MRI low contrast resolution test.
In previous work, we have shown that we can automate the ACR analysis procedure for three parameters which are low-contrast object detectability, percent signal ghosting, and image intensity uniformity [17]. Pursuing this concept, the purpose of this work was to investigate an automated method for a more accurate assessment of MRI systems performance. In this paper, we specifically focused on three main QC measurements, which are Slice position accuracy, high-contrast spatial resolution and slice thickness accuracy. Secondly, we evaluated the ability of the full pipeline to detect errors in the analysis using the ACR MRI phantom in ten MRI systems.
We summarized the contributions of this work as follows
➣ An evaluation of the performance of the automatic methods, originally developed for ACR phantom images.
➣ A comparison between the manual and the automatic approach and also against international reference values;
➣ A comparison of the time required between the automatic procedure and a typical manual process.
This paper is organized as follows. In the second section, we speak about the theoretical background, the approach taken in automating the ACR accreditation program and the data. In the third section, we present the obtained results. Finally, in the fourth section, we will discuss the results and we will finish by conclusions drawn from this experiment and possible future works.
Materials and Methods
We will present in this section a brief overview of the manual procedure for each parameter. Then, we will detail the steps of the proposed automatic workflow analysis of three parameters. We, finally, describe the used database.
General description
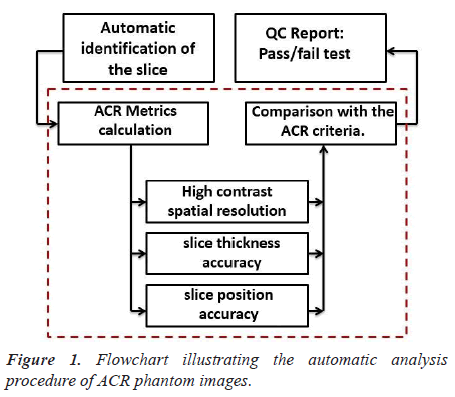
We present the steps of the process to automatically analyze ACR phantom image in Figure 1.
The script was developed to perform the following main steps:
Step1: Automatic slice identification
For all image quality parameters described in this paper, the proposed pipeline permits an automatic identification of the slice. The DICOM headers provide most parameters needed to process images and to compute metrics.
Step 2: ACR Metrics calculation
The parameters that were evaluated in this paper are highcontrast spatial resolution, slice thickness accuracy, and slice position accuracy.
Step 3: QC report
The obtained image quality parameters were compared with the ACR recommended acceptance criteria and the results are saved in an excel file. This step provides an efficient tool for following the stability of MRI scanners.
ACR Metrics calculation
The purpose of this section is to provide detailed information regarding the three tests that are part of our image QC pipeline.
High Contrast Spatial Resolution (HCSR) test
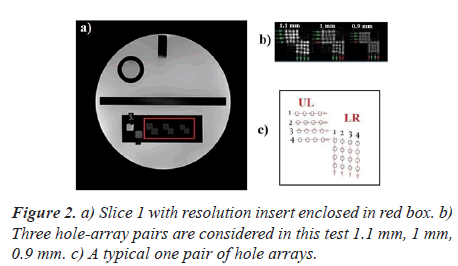
Manual procedure analysis: The High Contrast Spatial Resolution test determines the ability of an imaging system to resolve small high-contrast objects within proximity of each other. For this test, the three whole array pairs in slice 1 are evaluated [5].
Figure 2 shows the first of the eleven T1-weighted axial slices of the ACR phantom.
An illustration of a typical one pair of hole arrays is, also, shown in Figure 2.
Each typical one pair of hole arrays (Figure 2C) comprises a Lower Right (LR) hole array and an Upper Left (UL) hole array. The LR array contains four columns of four holes each. The UL array contains four rows of four holes each. The hole diameters are 1.1, 1.0, and 9 mm for the left pair, center pair, and right pair of arrays respectively. As recommended by the ACR manual, the operator evaluates the visibility of each hole individually. A pair is considered visible if all the four holes can be detected. For each direction, the measured resolution should be 1.0 mm or better.
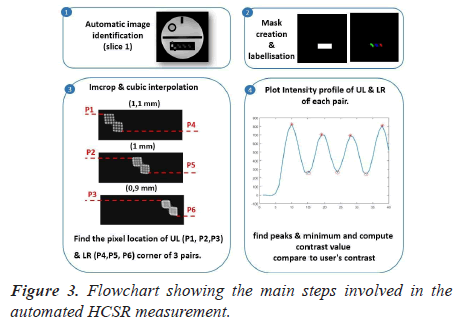
Automatic analysis pipeline: The extraction of this visual metric is highly tedious. We describe the proposed pipeline in detail, as well as the choices that we have made in its development. The automated analysis procedure is illustrated in Figure 3.
The following steps were carried out to perform the automatic assessment of the HCSR test. The first step consists of creating a binary mask containing the three pairs of holes’ arrays. One of the main problems related to the HCSR test lies in the lack of efficient automatic segmentation techniques for extracting the HCSR region. Thus, we proposed to manually create the rectangular Region Of Interest (ROI) with all images composing the dataset. Then, we compute the mean of coordinates of the ROI. The main advantage of this solution is that it can deal with different images matrix. In figure 3-panel 3, the calculation of the mask based on the ROI selection is shown.
Then, an iterative thresholding [18] procedure was used to binarize the cropped region to maximize the number of detected holes.
The code determinate line profiles across all objects shown in figure 3 panel 4 and searches peaks in the profile using ‘‘findpeaker function. Finally, HCSR was determined by measuring the numbers of peaks in the intensity profile.
Slice thickness accuracy test
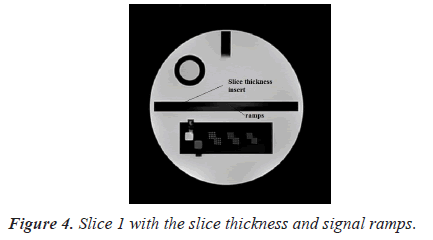
Manual procedure analysis: To assess slice thickness, two ramps are included in slice 1. Figure 4 shows image of slice 1 with the slice thickness insert.
For this test, the following procedure is used to find the lengths of two signal ramps. The observer would adjust the magnification, the intensity window, and the level so that the ramps are distinct. The on-screen measurement tool is then used to determine the lengths of the ramps [5].
The determined lengths of top and bottom ramps are converted to mm and then used in the following formula to determine the slice thickness.
Slice thickness=0.2 ((top*bottom))/((top+bottom))
Where "top" and "bottom" are the measured lengths of the top and bottom signal ramps
The measured slice thickness should be 5 mm ± 0.7 mm for this test to be passed.
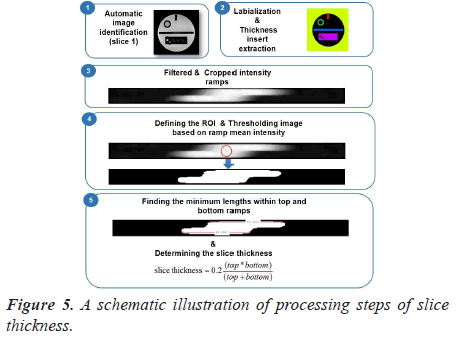
Automatic analysis pipeline: To make the image analysis more objective, we developed an automated ACR quality assurance procedure. The complete workflow used in our implementation is presented in Figure 5.
The steps of the developed image analysis pipeline are as follows: the first step of this automated test is to apply the labeling algorithm and to crop the thickness insert. Then, the cropped image is resized using bicubic interpolation to allow for sub-voxel accuracy in measurements.
The resized crop image is then binarized using automatic thresholding based on ramp mean intensity. In fact, elliptical ROI was placed, as shown in Figure 5-panel 4 and the mean pixels value was computed.
Finally, the length of each ramp is determined. This is done by finding all the lengths within the top and bottom ROIs and calculates the best result. The determined lengths of the top and bottom ramps are converted to mm and then used in the formula for determining the slice thickness.
Slice position accuracy
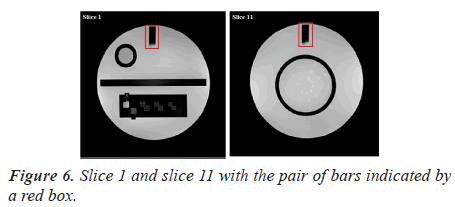
Manual procedure analysis: In the position accuracy test, slices 1 and 11 are considered to determine if the slices positions are as they were prescribed. When these slices are positioned accurately, the bars will be of equal length (Figure 6).
The slice position error is obtained by measuring the bars length difference between the right and left of two vertical black bars [5]. As defined by the ACR, the absolute bar length difference should be equal to ± 5 mm or less.
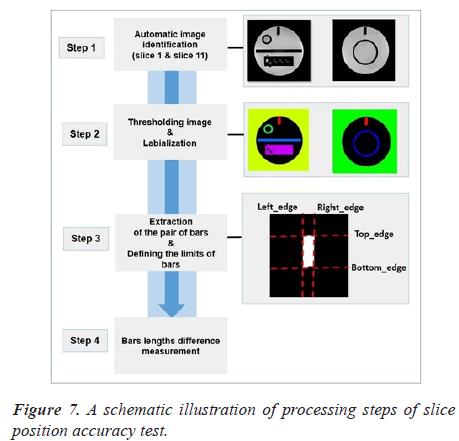
Automatic analysis pipeline: We used the following procedure for each image (slice 1 and slice 11) (Figure 7).
As a first step of the analysis pipeline, the pair of bars were extracted from the original image with the binarisation and labeling algorithms. We draw attention that the most crucial part of the algorithm is image segmentation. We automatically segment the bars from slice 1 and 11 using Fuzzy C-Means (FCM) technique [18]. The next step in the procedure is to define the bars limits.
The final two lengths used for calculation was the mean of all lengths in each wedge.
MRI scanners
To validate the accuracy of the proposed automated methods, and to what degree they differed from the manual analysis, we have used a database of ten MRI scanners from two vendors (Siemens and GE), two magnetic fields strength (1.5T and 3.0T) and two-matrix size (Table 1).
| MRI system | Matrix | B0 | System MR |
|---|---|---|---|
| 1 | 512 × 512 | 3 T | Siemens Trio |
| 2 | 512 × 512 | 3 T | Siemens Verio |
| 3 | 256 × 256 | 1.5 T | GE Signa Excite |
| 4 | 512 × 512 | 3 T | Siemens Verio |
| 5 | 512 × 512 | 3 T | Siemens Trio |
| 6 | 256 × 256 | 3 T | Siemens Verio |
| 7 | 512 × 512 | 1.5 T | Siemens Espree |
| 8 | 512 × 512 | 1.5 T | Siemens Aera |
| 9 | 256 × 256 | 3 T | GE Signa HDxt |
| 10 | 256 × 256 | 1.5 T | GE Signa Excite |
Table 1. MRI System information.
For the analysis of ACR phantom data, we used the script implemented in MATLAB. The accuracy of the procedures is demonstrated by comparing manually obtained results against the Automated Measurements (AM). The obtained image quality measurements were also compared with the recommended values provided by the ACR. Three experienced technologists interpreted the phantom images according to ACR criteria.
Afterward, all data sets are evaluated using the Pearson test. Correlation was estimated using Pearson’s correlation Coefficient (R) with significant correlation indicated by P-value smaller than 0.05.
Results
All ACR MRI quality control tests were performed successfully and were shown to function correctly. We will present in this section the obtained results for each test.
High-Contrast spatial resolution test
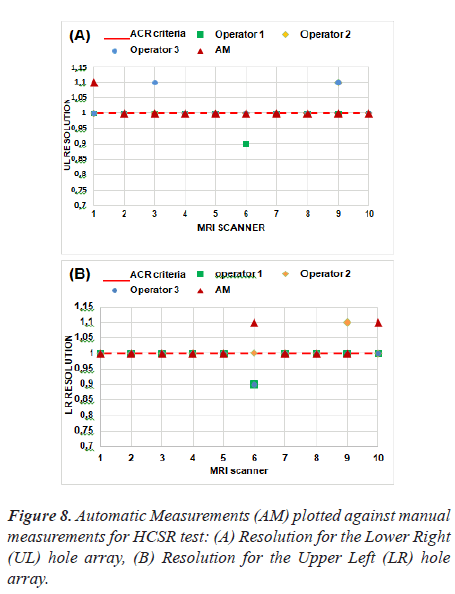
Figure 8 represent the results of the proposed method as applied to ten MRI scanners.
The tolerance of this test is shown with a red dash line. Based on these results, we note that five MRI systems have a spatial resolution of 1 mm for Upper-Left (UL) hole arrays and 1 mm for Lower-Right (LR) hole arrays for slice 1 image and passed the spatial resolution test.
Thus, we find that the automatic method differs from the manual method in MRI 1 for UL pairs, likewise, MRI 6 and MRI 10 for LR pairs. This test is subjective and the results could differ depending on the operator's choice of the display window and visual perception.
The correlation was calculated between the three operators and the automatic procedure using Pearson's test and the obtained result did not show a significant difference. As expected, the correlation between the manual method and the automatic method represents an average negative correlation. Pearson's R correlation for automated values is -0.5. The P value is less (P-value = 0.02) than the significance level of 0.05, indicating an agreement between the two measurements.
The automatic analysis of the ACR phantom test assures that the image quality is always assessed in the same way and in short time. In fact, the processing time decrease from 1 min for the manual method to 12 s for the automatic approach.
Developing an automated ACR quality assurance procedure is expected to avoid inter-observer and intraobserver variability and to potentially allow more consistent and beneficial assessment of image quality.
Slice thickness test
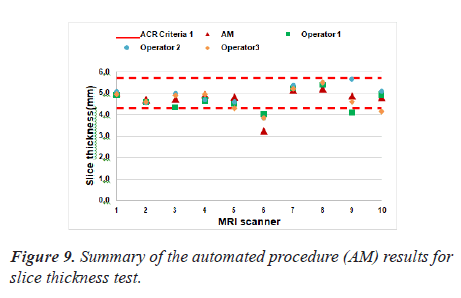
The developed algorithm has been efficiently applied. Figure 9 represented the values for measured slice thicknesses where the red dash line indicate the ACR
There was one exception: MRI scanner 6 failed the slice thickness accuracy test in both manual and automatic assessment.
The Pearson’s correlation coefficient was 0.87 that indicates how strongly the two measurements are linearly related. There was a good correlation between the manually calculated and automated results performed by both operators for the estimation of slice thickness accuracy. The P value was 9.72 × 10⁻⁴ (lower than the significance level which is 0.05).
Finally, it should be noted that the time required for quality control is often an important consideration. The manual procedure described here requires between 45 s and 1 min per MRI system depending on the quality of the scan and the experience of the user. In contrast, the automated measurement is obtained in less than one second (0.34 s) on a 1.7 GHz processor system with 4 GB of memory.
Overall, the automated method enables reliable quantitative evaluation of MRI scanner performance with the ACR phantom.
Slice position accuracy test
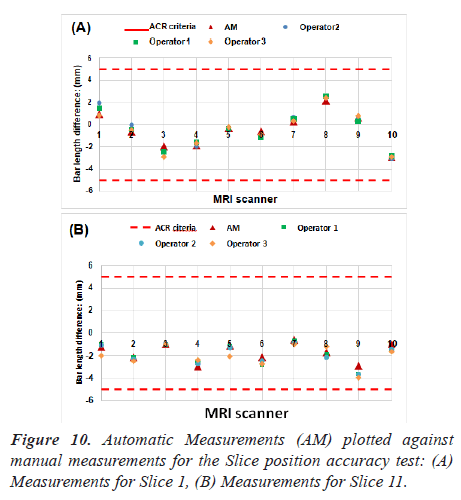
As explained in the previous section, the bar length difference in two slices was measured. Figure 10 lists the measurements for the ten MRI systems. Red dash lines on Figure 10 represent the maximum difference of bar lengths that is allowed.
All the scanners passed the slice position accuracy test when comparing the results and the ACR recommended limitations. As can be seen in Figure 10, no significant difference was found in automatic and manual measurements.
Quantitative analysis showed that the values obtained using our methods were in high agreement with manual analysis. The correlation coefficient (R-value) between the two measurements was 0.98 (the p-value is equal to 3.56 × 10⁻⁷ for slice 1. While for slice 11, the value of R represents 0.92 (P = 1.06 × 10⁻⁴).
By other hand, automated procedures achieve favourable results maintaining the balance between quality and a less processing time. It is important, therefore, that the processing time was decrease from 25 s (manual method) to 4.82 s (automatic method) which has made the analysis faster and more objective.
Discussion
In this study, we presented and validated a pipeline for the fully automatic quality control of ACR phantom data. The overarching aim is to allow quantitative evaluation of ACR phantom images quality as well as accurate and precise analysis.
All measurements were carried out on ten MRI systems and all automatically calculated values were checked with manual image analysis tools to assure the functionality of the proposed approach. Manual QC results from trained MRI readers are also used as a gold standard for comparison.
When comparing the results and the recommended values provided by ACR quality assurance manual, the majority of the MRI imagers operated at the level fulfilling the ACR recommended acceptance criteria.
Out of ten MRI scanners five passed all the ACR MRI quality assurance tests. One MRI scanner (MRI 6) did not pass the slice thickness test and failed to reach the ACR recommended values. Five of them did not pass the HCSR test. All MRI systems passed the slice position accuracy test.
Excellent agreement was achieved in all measurements except for HCSR test. An interesting finding was that automatic measurements were more reproducible for HCSR test compared to visual assessment. It has been shown to yield similar evaluations as the assessment determined manually by experts.
The results of the Pearson test showed that there was no significant difference between the automatic analysis and the manual operations.
These results prove that our automatic analysis tool can efficiently replace manual processing. An interesting finding was that the total analysis time was decreased for all ACR tests. This is significantly shorter than the time needed for manual analysis.
Conclusion
Averaged over all phantom measurements, the automated measurement shows a good agreement with the manual measurement. Our analysis showed that high-contrast spatial resolution, slice thickness, and Slice position accuracy provides unbiased and meaningful evaluation of image quality. The proposed pipeline was performed successfully in all cases.
Future work will include thorough evaluation and improvement of current routines and development of additional image quality tests.
Acknowledgments
The authors would like to express their sincere thanks to Pr. Panych, Lawrence Patrick who provided the database.
References
- Price RR, Axel L, Morgan T, Newman R, Perman W, Schneiders N. Quality assurance methods and phantoms for magnetic resonance imaging: report of AAPM nuclear magnetic resonance Task Group No. 1. Med Phys 1990; 17: 287?295.
- Keenan KE, Ainslie M, Barker AJ. Quantitative Magnetic Resonance Imaging Phantoms: A Review and the Need for a System Phantom. Magn Reson Med 2018; 79: 48?61.
- ACR. Site Scanning Instructions for Use of the Large MR Phantom for the ACR MRI Accreditation Program. Reston 2008.
- MRI quality control manual. American College of Radiology. Reston 2000.
- ACR. Phantom Test Guidance for the ACR MRI Accreditation Program. Reston 2005.
- Chen CC, Wan YL, Wai YY, Liu HL. Quality Assurance of Clinical MRI Scanners Using ACR MRI Phantom. Preliminary Results Journal of Digital Imaging 2004; 17: 279-284.
- Gardner EA, Ellis JH, Hyde RJ, Aisen AM, Quint DJ, Carson PL. Detection of degradation of magnetic resonance (MR) images: Comparison of an automated MR image-quality analysis system with trained human observers. Acad Radiol 1995; 2: 277-281.
- Firbank MJ. A comparison of two methods for measuring the signal to noise ratio on MR images. Phys Med Bio 1999; 44: 261?264.
- Etman HM, Mokhtar A, Abd-Elhamid MI, Ahmed MT, El-Diasty T. The effect of quality control on the function of Magnetic Resonance Imaging (MRI), using American College of Radiology (ACR) phantom. Egypt J Radiol Nuc Med 2017; 48: 153-160.
- DiFilippo PF, Patel M, Patel S. Automated quantitative analysis of ACR PET phantom images. J Nuc Med Tech 2019; 47: 249-254.
- Nowik P, Bujila R, Poludniowski G, Fransson A. Quality control of CT systems by automated monitoring of key performance indicators: a two-year study. J Appl Clin Med Phys 2015; 16: 254-265.
- DiFilippo FP. Technical Note: Automated quantitative analysis of planar scintigraphic resolution with the ACR SPECT phantom. Med Phys 2018; 45: 1118-1122.
- Aldokhail AM. Automated Signal to Noise Ratio Analysis for Magnetic Resonance Imaging Using a Noise Distribution Model. 2016.
- Panych LP, Chiou JY, Qin L, Kimbrell VL, Bussolari L, Mulkern RV. On replacing the manual measurement of ACR phantom images performed by MRI technologists with an automated measurement approach. J Magn Reson Imaging 2016; 43: 843-852.
- Sewonu A, Hossu G, Felblinger J, Anxionnat R, Pasquier C. An automatic MRI quality control procedure: Multisite reports for slice thickness and geometric accuracy. IRBM 2013; 34: 300?305.
- Ramos JE, Kim HY. Automation of the ACR MRI Low-Contrast Resolution Test Using Machine Learning. Congress on Image and Signal Processing. Bio Med Eng Info 2018.
- Ben Alaya I, Mars M. Automatic Analysis of ACR Phantom Images in MRI. Curr Med Imag 2020; 16: 892-901.
- Khandelwal M, Shirsagar S, Rawat P. MRI image segmentation using thresholding with 3-class C-means clustering. Proceedings of the 2nd International Conference on Inventive Systems and Control (ICISC).
