Research Article - Journal of Fisheries Research (2022) Volume 6, Issue 3
Determination of tuna spawning areas off the Ivory Coast: Contribution of satellite imagery.
Jean-Baptiste Kassi*, Yannick Koko Gnahoua, Jacques Andre Tiemele
Department of Marine Science, University Center for Research and Application in Remote Sensing (CURAT), Felix Houphouet-Boigny University, Abidjan, Ivory Coast
- *Corresponding Author:
- Jean-Baptiste Kassi
Department of Marine Science
University Center for Research and Application in Remote Sensing (CURAT)
Felix Houphouet-Boigny University, Abidjan, Ivory Coast
E-mail: ahonjb.kassi@curat-edu.org
Received: 26-Apr-2022, Manuscript No. AAJFR-22-61923; Editor assigned: 27-Apr-2022, PreQC No. AAJFR-22-61923(PQ); Reviewed: 18-May-2022, QC No. AAJFR-22-61923; Published: 25-May-2022, DOI: 10.35841/aajfr-6.3.112
Citation: Kassi JB. Determination of tuna spawning areas off the Ivory Coast: Contribution of satellite imagery. J Fish Res. 2022;6(3):112
Abstract
Tuna is one of the pelagic species whose landing on the Ivorian continental shelf is spectacular. However, given the threats facing this species, we have conducted this study in order to contribute to the safeguarding and sustainable management of this threatened fish species. The study is based on the analysis of oceanic parameters that determine the potential spawning areas of tunas in Ivory Coast. To do this, remote sensing data from MODIS, SMOS and ERA Interim sensors have been used to estimate the temperature, the sea surface salinity and the seawater turbulence. Tuna stock data from the Aquaculture and Fisheries Department of Côte d'Ivoire were used. The methodology used is a multi-criteria analysis based on the three oceanic parameters of sea surface turbulence, temperature and salinity, which allowed to highlight the potential spawning areas of tunas as a function of the seasons of the year. The results showed that the preferred periods for tuna spawning cover from December to June with areas of low turbulence, salinity between (34 and 35 psu) and temperatures above 26°C between latitudes 0° and 3°N.
Keywords
Spawning area, Temperature, Turbulence, Salinity, Remote sensing, Tuna.
Introduction
The oceans occupy two thirds of the earth's surface and support more than 200 million men and women. Like all oceans and gulfs, the Gulf of Guinea (GG) is an important source of animal protein (marine catch of more than 630,315 tons in recent decades and an immense biophysical resource (increased concentrations of chlorophyll pigments linked to upwelling [1]. Ivory Coast, a coastal country in the Gulf of Guinea, is the leading African producer of canned tuna and the second largest exporter of tuna to the European Union [2]. However, overfishing poses a threat to this fishery resource, which led Professor Jacques Datte of the Laboratory of Nutrition and Pharmacology at the University of Felix Houphouet-Boigny and Executive Secretary of the Administration Committee of the Franc Regim (CARF), to state in 2018 during a conference on solutions for the tuna sector in Ivory Coast that the problem is that in tuna fishing, it fishes, both juveniles and adult fish. This will consequently lead to a deficit of this resource [3]. It is in this perspective that this study was initiated in order to analyze the oceanic parameters that determine the potential spawning areas of the tuna. The main objective is therefore to map the potential spawning areas of tunas from oceanic variables in the Ivorian marine environment.
Location of the study area
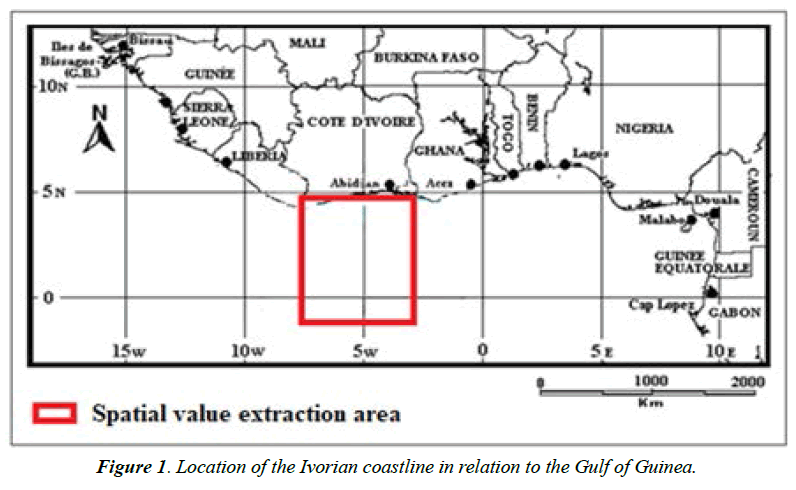
The Ivorian coastline is part of the large marine ecosystem of the Gulf of Guinea (GG) current that runs from Guinea Bissau to Angola Figure 1. This coastline, located in West Africa, represents only a part of the Gulf of Guinea (GG) precisely in the Central West African Upwelling (CWAU) region. It is delimited by the Cape of Palms (border with Liberia) to the west, and the Cape of Three Points (in Ghana) to the east. The Ivorian coastline extends over 566 kilometers with a variable width of less than 5 kilometers on the crystalline and metamorphic basement in the western part to nearly 50 kilometers in the east on the clayey sands and sandstones of the terminal continental [4].
Materials and Methods
Data used
In this study, the Soil Moisture and Ocean Salinity (SMOS) sensor data from the European Space Agency and MODIS Aqua data from 2013 to 2018 were used. The SMOS sensor will be used to measure the sea surface salinity (SSM). The MODIS sensor will be used to measure the ocean color and therefore estimate the sea surface temperature while allowing to observe the cold water upwelling. The wind data (ERA Interim from 2013 to 2018) is a dataset that will be important to characterize the mixing index of the water column (turbulence).
Data on fishing statistics from the Fisheries Department of the Ministry of Animal and Fisheries resources were also used.
Methodology
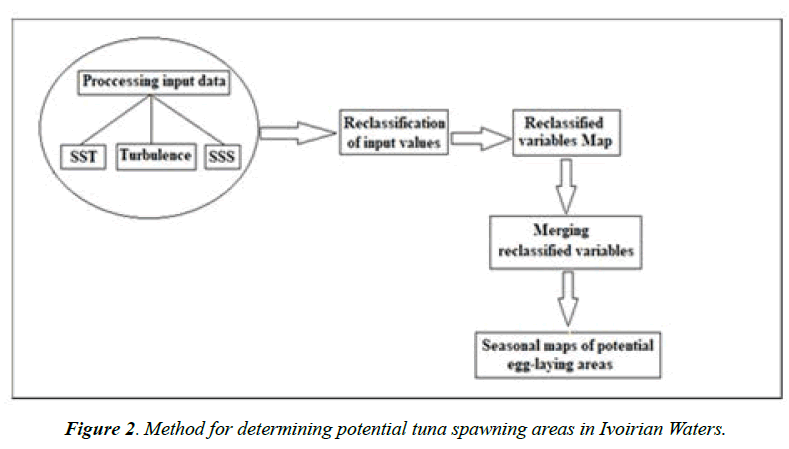
In the present study, the aim is to determine the potential spawning areas for tunas for a better management of this pelagic species. A multi-criteria analysis developed from three oceanic parameters (SST, SSS and turbulence) allows us to achieve this. Indeed, according to the favorable areas for spawning of bigeye tuna (Patudo) would be delimited by temperatures above 26°C in the Atlantic Ocean [5].
Wind intensity and turbulence are also important factors in the reproduction of pelagic species. If the turbulence is weak (low winds), the concentration of larvae is ensured but the enrichment in plankton does not occur, which leads to a high mortality of the larvae due to a lack of food; on the other hand, strong turbulence (strong winds) is able to promote this enrichment but in this case the larvae will be rapidly dispersed, also causing a high mortality [6]. Sea surface temperature and wind intensity are not the only parameters that condition the optimal areas for tuna spawning. For example showed that Skipjack tuna tend to spawn in desalinated surface waters, overcoming waters with maximum salinity. The present study will focus on the spawning areas and periods of the Tuna as the general modality of reproduction to be defined. In practice, three conditions have been defined in the elaboration of the maps of spawning areas [7].
For sea surface temperature: Favorable areas are defined by a SST>26°C. That is, relatively warm areas.
For sea surface salinity: Favorable areas for spawning have salinity between 34 and 35 psu [8].
Spawning-friendly areas where the mixing index of the water column is lower. The values of the selected variables were reclassified into three classes (low, medium, high) based on the defined ranges. The resulting maps of the reclassified variables will be merged to obtain the maps of potential Tuna spawning areas. Figure 2 summarizes the methodology for the determination of potential spawning areas according to these oceanic variables (SST, Salinity and Turbulence).
Results
Analysis of variables
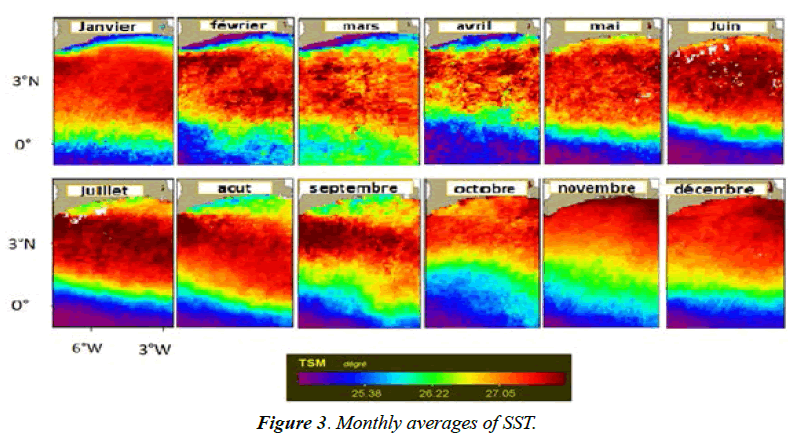
Monthly averages of SST: In general, three trends can be observed in the evolution of sea surface temperature. From January to April and then from July to September, the Figure 3 watch low SST values are observed at the coast, which increase towards the open sea. From May to June and from October to December: high SST values can be observed at the coast, which decrease as one moves towards the open sea; SST is low around 0°N and around -1°N of Latitude for all months. Indeed, the maximum values are found in the months of March to May and November to December with a peak of 29.3°C in April. The lowest SST value is observed in August (25.4°C) pendant la great cold season.
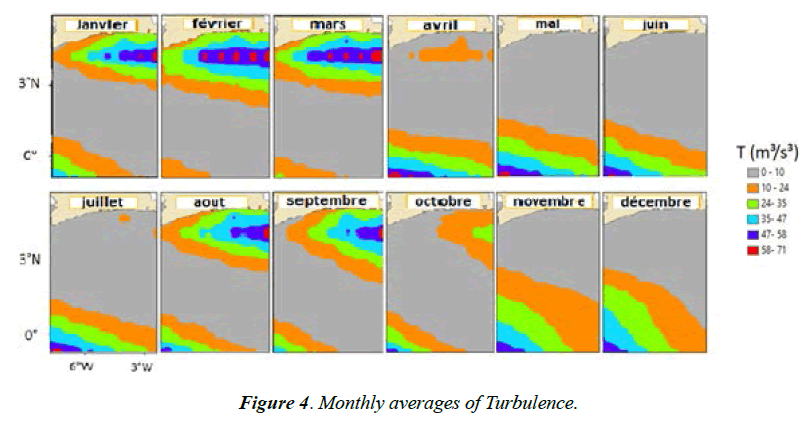
Monthly average Turbulence (water column stability): The analysis of Figure 4 allows us to have a general knowledge of the stability of the Ivorian water column from 2013 to 2018. For the months of January to March and August to September: we observe a high turbulence of about 58 to 71 m3/s3 around Latitude 4°N. This turbulence decreases to 10 m3/s3 at 1°N latitude before increasing progressively towards 1°S latitude in the order of 24-47 m3/s3. From April to July and from November to December, turbulence generally increases from the coast to the open sea, from 10 to 58 m3/s3. There is an alternation of low and high turbulence values in the study area. The high values indicate the presence of peaty waters that negatively influence the recruitment of pelagic species.
Monthly average sea surface salinity
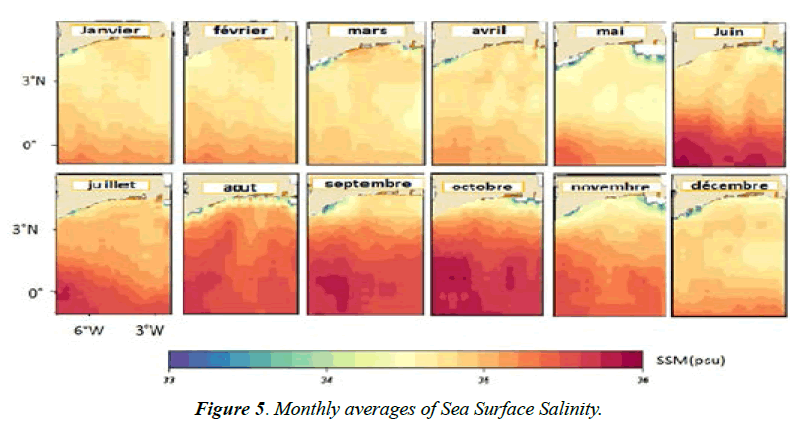
The analysis of seasonal variability shows a low salinity at the coast which increases towards the open sea. The period from December to March records is an average salinity from 34 to35 psu on the ivoriancoastline. From June onwards, more or less significant values of SSM are noted in Ivorian waters and offshore, with an average around 36psu. The Great Cold Season shows a high salinity during the year in the study area Figure 5.
Analysis of potential spawning areas
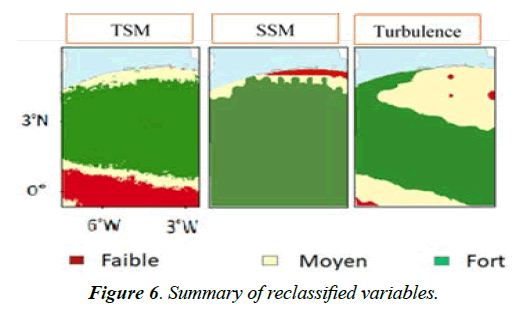
The analysis of the synthesis of the reclassified variables allows the discrimination of areas with low, medium and high spawning potential for tunas according to each variable, according to the predefined intervals Figure 6. The high potentialities occupy the largest areas for all variables and are generally located between latitudes 1 and 4°N. The areas not favorable for tuna reproduction are located around 0° latitude for sea surface temperature and at the coast between longitudes 3 and 5°W for salinity. The area located between latitudes 3 and 5°N and longitudes 2 and 5°W are moderately favorable for spawning and scattered with small spots of low potentiality in relation to the turbulence of the sea.
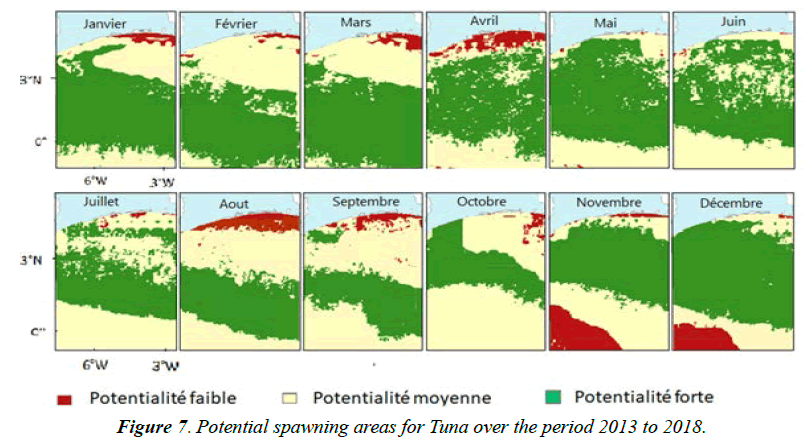
Figure 7 presents the potential spawning areas for tunas according to the seasonal variability of sea surface temperature, sea surface salinity and the water column stability index over the study period (2013 to 2018). In general, there is a decrease in the area of high spawning potential from January to October in Ivorian waters and offshore. The period from January to June as well as December month have the largest areas of high spawning potential. These areas are mainly located between latitudes 0 and 3°N. The smallest areas are observed during the great cold season and from October to November. This could be explained by the low SST values and the salinity which is around 36psu during this period. The Ivorian coast appears to be a not favorable area for reproduction during the period from January to April and July to September and also in November.
Discussion
According to the results, the favorable areas for tuna reproduction are located mainly from the coast to the 0° latitude in the period from January to March and also in the months of May and December. This follows from the observation of the relatively high surface areas of high potential during these periods. These results are in agreement with those of Travassos for whom the main spawning period for bigeye tuna (Patudo) in the Atlantic Ocean is the first quarter of the year during which the catches of tuna are also high [5]. The areas with high spawning potential shrink during the long cold season. Indeed, the sea surface temperatures are relatively low during this period. This corresponds to areas less favorable for spawning from the point of view of sea surface temperature are relatively low during this period. This corresponds to areas that are less favorable for spawning from a sea surface temperature perspective (SST<26°C). Consistent with this hypothesis, Travassos P believes that the most important role in the spatiotemporal distribution of tuna spawning activity is played by surface temperature. The areas of the ocean characterized by salinity between 34 and 35 psu correspond to the favorable areas for tuna spawning activities. In this study, the first quarter is the optimal period for tuna spawning. This is in line with our logic because the MST values of the ocean during this period are in the order of 34 to 35 psu Donguy established a relationship between the position of the 35 psu isohaline and significant catches of Skipjack in the western Pacific [8]. Since tunas make periodic migrations to satisfy their vital needs (nutrition, reproduction, growth), they probably move to areas with high spawning potential to reproduce. Areas of low turbulence in the ocean are favorable for spawning.
These areas coincide with areas of high SST (SST > 26°C) and during the first quarter of the year between latitudes 0 and 3°N. These areas have high spawning potential according to the map of tuna spawning areas. These results are in agreement with the 7th Report of the review of the fisheries and aquaculture industry in the COMHAFAT area which designates the first quarter of the year as the main spawning period for tuna.
Conclusion
The main objective of this study conducted in Ivorian waters and offshore is to determine the periods and potential areas of tuna spawning over the period 2013 to 2018. To do this, we used some oceanic parameters obtained from satellite imagery. The satellite imagery provided a better understanding of the optimal conditions for tuna spawning. Thus, all the periods of the year present areas with high spawning potential at more or less different locations in the study area. The periods of the year during which the high spawning potential is distributed over almost all the Ivorian waters and the open sea are from January to June and also in December.
It should therefore be remembered that remote sensing and geographic information systems are important tools for the development of a sustainable fishing activity.
References
- Marsac F. Changements hydroclimatiques observés dans l’Atlantique depuis les années 50 et impacts sur quelques stocks de thons et leur exploitation. Communication présentée au Comité Permanent pour la Recherche et les Statistiques, ICCAT. Rec Doc Scient. 1998;49(4):(SCRS/98/113),25 .
- Walter M, Matsumoto Robert A, Andrew E, et al. Synopsis of Biological Data on Skipjack Tuna, Katsuwonus pelamis. 1984;1-99.
- FAO. The state of food and agriculture. 1992;1-280: 0081-4539.
- Le Loeuff P, Marchal E, Amon KJB, et al. Environnement et ressources aquatiques de Côte d'Ivoire : 1. Le milieu marin. ORSTOM. 1993;15-22:2-7099-1134-5.
- Anoh KP, Pottier P. Geography of the coast of Ivory Coast: elements of reflection for an integrated management policy. CNRS-LETG UMR 6554 et IGT: Nantes – Abidjan. 2008;325.
- Travassos P. La pêche du Thon Obèse (Thunnus Obesus) et les conditions hydroclimatiques dans l’océan Atlantique intertropical. Collect Vol Sci Papers ICCAT, 2001;52 (2):499-527.
- Donguy JR, Bour W, Galenon P, et al. The oceanographic conditions of the skipjack (Katsuwonus pelamis) fishery in the Western Pacific. Cah ORSTOM Ser Oceanogr. 1978;17(3-4):309-217.
- Failler P, El Ayoubi H, Konan A. Industrie des pêches et de l'aquaculture en Côte d’Ivoire. Rapport n°7 de la revue de l'industrie des pêches et de l'aquaculture dans la zone de la COMHAFAT. 2014;99.
