Research Article - Biomedical Research (2017) Volume 28, Issue 19
Determination of thermodynamic acidity constants of phosphocreatine and its rate constants of hydrolysis reaction by pressure-assisted capillary zone electrophoresis
1Laboratory of Pharmaceutical Analysis, Shanghai Institute of Materia Medica, Chinese Academy of Sciences, 555 Zuchongzhi Road, Zhangjiang Hi-Tech Park, Shanghai, PR China
2University of Chinese Academy of Sciences, No.19A Yuquan Road, Beijing, PR China
- *Corresponding Author:
- Lifeng Chen
Laboratory of Pharmaceutical Analysis
Shanghai Institute of Materia Medica
Chinese Academy of Sciences
University of Chinese Academy of Sciences, PR China
Accepted on August 28, 2017
Abstract
Purpose: A pressure-assisted capillary zone electrophoresis method (pCE) was developed to determine the thermodynamic acidity constants (pKa) of phosphocreatine and rate constant of its hydrolysis reaction under acidic conditions.
Materials and Methods: Performed in an uncoated fused-silica capillary under separation voltage of 18 kV and 50 mbar of external pressure applied simultaneously.
Results: The running temperature was controlled at 25°C. The thermodynamic pKa values were calculated using the effective mobility (μeff) of the analyte against pH values of Background Electrolytes (BGEs) ranging from 1.7 to 12.1 with constant ionic strength of 25 mM. The hydrolysis kinetic studies under acidic conditions were conducted and the corresponding rate constants obtained with the pH range of between 2.0 to 7.0.
Conclusions: It could be found that the pCE method was convenient and more applicable to accurately determine the pKa values with degradant coexisted.
Keywords
Capillary zone electrophoresis, Pressure-assisted, pKa, Hydrolysis kinetics, Phosphocreatine.
Introduction
It was estimated that 95 percent of drug molecules have at least one ionizable group [1]. The acid dissociation constant, usually expressed as pKa, is a key parameter to describe ionization properties of the molecular [2]. Usually, the ionized form is water soluble, while the neutral form is more lipophilic with higher membrane permeability. Thus, the properties of solubility, lipophilicity and permeability are pKa-dependent and the knowledge of pKa is important for understanding the behaviors of the Absorption, Distribution, Metabolism and Excretion (ADME) for the drugs in vivo [3].
It is generally regarded that potentiometric method is a “golden” standard method for pKa value determination which is calculated from the change in the shape of the titration curve monitored by a pH electrode [4-6]. However, it suffers several drawbacks, such as being time consuming, requiring relatively large amounts of pure and stable substances. In last decades, Capillary Zone Electrophoresis (CE) has been developed as an attractive method for pKa determination [7-10]. The method relies on the measurements of effective mobility (μeff) of an ionizable analyte in a series of Background Electrolyte (BGE) buffer solutions with variable pH at a constant Ionic strength (I) and the pKa value(s) of the analyte can then be obtained by fitting the μeff against the pH value of BGE buffer solution. Compared with that of the standard potentiometric method, CE method offers several advantages, such as it requires a negligible consumption of the analyte at low concentration, only migration times are needed for the calibration, possible impurities do not disturb the precise of the measurements. Thus, CE method is an efficient trouble-shooting method for pKa values determination for the drug compounds with the difficulties of quantity supply or impurities coexisted which are originated from synthesis process or degradation reaction during the analytical process. Since there is still a major problem for CE determination at low pH buffer (pH<4) as Electroosmotic Flow (EOF) is diminished, external pressureassisted CE (pCE) has been developed for its generic screening purpose [11-14].
Phosphocreatine sodium has been applied as pharmacological myocardial protection in cardiovascular surgery, which would be in the form of phosphocreatine (PC, Figure 1a) in vivo to serve as an energy supplier, stabilize cellular membranes and decrease the production of lysophosphoglycerides in hypoxic hearts [15,16]. The pKa values of PC have been reported from different laboratories using potentiometric titration with some differences from each other [17-19]. Since the hydrolysis degradation reaction would occur under the acid conditions with pH lower than 5 [17], it could be assumed the coexisted degradants would propose the challenge for the reproducible pKa values from laboratory to laboratory. In this work, a pressure-assisted capillary zone electrophoresis (pCE) was developed to overcome the challenge. Furthermore, kinetics studies were conducted using the pCE method to assess the influencing effects of the pKa measurements due to the hydrolytic degradation occurring under the pH range of 2.0 to 7.0 with the ionic strength controlled at 25 mM.

Figure 1: The chemical structures of (a) phosphocreatine (PC) and (b) Creatine.
Experimental Material and Methods
Phosphocreatine sodium, sodium hydroxide, sodium chloride, acetic acid, tris (hydroxymethyl) aminomethane (Tris), boric acid, phosphoric acid, formic acid, quinine sulfate and Dimethyl Sulfoxide (DMSO) were of analytical reagent grade supplied by Sinopharm Chemical Reagent Co., Ltd. (Shanghai, China). 3-(Cyclohexylamino)-1-Propanesulfonic Acid (CAPS) was obtained from J&K Scientific Ltd. (Beijing, China). Creatine was obtained from National Institutes for Food and Drug Control of China (Beijing, China). Water was purified by a Milli-Q plus system Millipore AS (Bedford, MA, USA) with a resistivity of 18.2 MΩ cm.
For pKa determination, 4 mM PC solution was freshly prepared in water with DMSO added as an EOF marker with its concentration controlled at 0.1% (v/v). The pCE methods were performed using the BGEs with the pH ranging from 1.7 to 12.1 with the ionic strength controlled at 25 mM which were prepared by mixing stock solutions as described in Table 1. All the measurements were performed in triplicate.
| pH range | Buffer name | Stock solution | Ionic strength (M) |
|---|---|---|---|
| 1.7-2.9 | Phosphate | 0.5 M H3PO4 | 0.025 |
| 0.5 M Tris | |||
| 2.9-3.9 | Formate | 0.5 M HCOOH | 0.025 |
| 0.5 M Tris | |||
| 4.3-5.5 | Acetate | 0.5 M CH3COOH | 0.025 |
| 0.5 M Tris | |||
| 6.0-7.5 | Phosphate | 0.5 M H3PO4 | 0.025 |
| 0.5 M NaOH | |||
| 7.5-9.5 | Borate | 0.2 M H3BO3 | 0.025 |
| 0.5 M NaOH | |||
| 10.3-11.3 | CAPS | 0.5 M CAPS | 0.025 |
| 0.5 M NaOH | |||
| 11.8-12.1 | Sodium hydroxide | 0.5 M NaOH | 0.025 |
| 0.5 M NaCl |
Table 1. Background electrolytes preparation.
For the kinetic studies of hydrolytic degradation, 4 mM PC solutions added with 0.2 mM quinine as an internal standard for the quantitative calibration were prepared in the buffer solutions as described in Table 1 with the pH ranging between 2.0 to 7.0 and the same ionic strength as that for pKa determination. The hydrolytic degradation of PC was monitored at different time intervals using the pCE method with 25 mM phosphate buffer solution (pH 7.5) as the running BGE. 10 mM creatine standard solution was prepared in water to verify the corresponding degradation product of the hydrolysis reaction.
Instrumentation
The CE measurements were operated on an Agilent CE 1600A (Agilent Technologies, Waldbronn, Germany) equipped with a diode array UV/Vis detector (DAD) and the wavelength 210 nm. An uncoated fused-silica capillary column (Yongnian Optical Fiber Corporation, Hebei, China) of 50 μm (I.D.) × 375 μm (O.D.) with 30 cm total length and 21.5 cm effective length was used for the determination. Before the first use, the capillary was rinsed with 0.1 M sodium hydroxide for 20 min, followed by water for 20 min. Sample injections were operated in hydrodynamic mode at 50 mbar. The capillary was rinsed under 940 mbar pressure with 0.1 M NaOH for 3 min, water for 2 min and BGE for 5 min, successively. Between two times of running, the capillary was washed with 0.1 M NaOH for 2 min, water for 2 min and equilibrated by flushing with the running electrolyte for 5 min. The background electrolyte was replaced every 10 runs. The separation voltage of 18 kV was applied with the electric current ranged between 17 to 40 μA, simultaneously added with 50 mbar of external pressure upon the capillary.
Julabo F40-HC refrigerated and heating circulator (Julabo Inc., Seelbach, Germany) was used to control the temperature for the kinetic hydrolysis reaction studies. The pH values of the BGEs and the buffer solutions were measured using a Sartorius PB-10 pH meter (Beijing, China) at 25°C with the stability of the pH value being confirmed. The values of pKa and kobsd of the analyte were calculated with the aid of the Origin software (version 8.0, Northampton, MA, USA).
Results and Discussion
Optimization of operation parameters in pCE experiments
In acidic running conditions (pH<4), the internal surface of the fused-silica capillary is neutral or weakly negatively charged. The Electroosmotic Flow (EOF) would be decreased with the decreasing pH of BGE buffer, thus causing long migration time for DMSO, the indicator of EOF and the analyte of PC, as well. In order to shorten the migration time and mitigate the degree of hydrolysis of the analyte of PC under acidic conditions, it was found that external pressure was helpful to overcome the concerned problems. The peak shapes were not affected by the pressure-induced parabolic flow and the external pressure of 50 mbar was optimal for the balance between the separation profile and the peak resolution. In this study, the analysis time for a single electrophoretic operation was less than 5 min.
As ideal electrophoretic running buffer concentration is a compromise between buffering capacity and Joule heating. In this study, ionic strength was controlled at 25 mM for the running buffer solutions. Ohm's law was verified with linear relationships between current and voltage and there was no excessive Joule heating generated during the electrophoresis process.
Since the hydrolytic degradation occur under acidic running conditions, the signal response of the analyte of PC would decrease. In order to make sure the signal of the analyte of PC could be detected at all running pH conditions, the injection time was accordingly optimized based on the different pH of the running BGEs, with 6 s under pH<6.0 and 3 s under pH>6.0, respectively.
Determination of pKa values by the pCE method
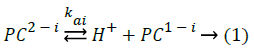
For this triacidic monobasic compound, each dissociation step can be described as Equation 1, i=1, 2, 3, 4, respectively.
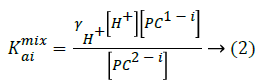
The mixed dissociation constants (Kaimix) [20-22] are given as Equation 2
In this pCE experiments, the mixed pKa values can be calculated by analyzing the electrophoretic mobility (μeff) of the analyte against the different pH values of BGE [23], described as Equation 3.
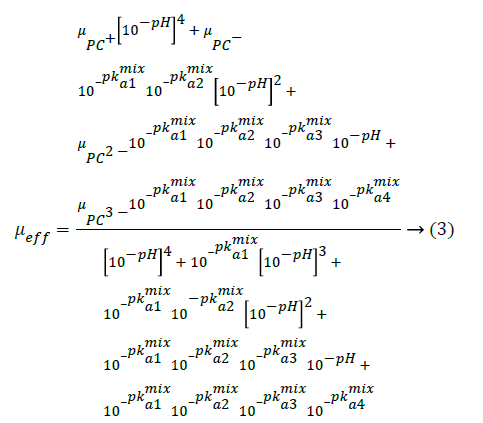
where μPC+, μPC-, μPC2-, μPC3- were the effective mobility of the corresponding protonated forms, respectively. μeff can be calculated from migration time of the investigated PC analyte (tm) and DMSO (tEOF), the marker of Electroosmotic Flow (EOF) [24], shown as Equation 4.
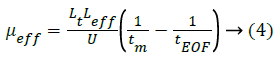
where Lt (m) was the total capillary length, Leff (m) was the effective capillary length, U was the applied voltage (V).
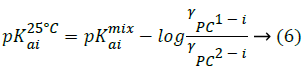
The thermodynamic acid dissociation constants (K25°Cai) were obtained with the correction of the buffer ionic strength at I=0 M according to the following Equations 5-7 [25].
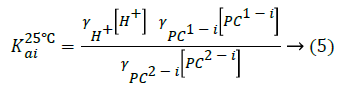
Substituting Equation 2 into Equation 5 gives:
For ionic strength below 0.2 M, activity coefficients for ions at 25°C can be calculated by Debye-Huckel theory.
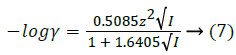
where γ was activity coefficient, z was the charge number of ions. For neutral form, the activity coefficient was assumed to be unity. All terms in brackets were molar concentrations.
Typical electropherograms were shown as Figure 2 under the developed pCE running conditions. It can be found that an impurity was detected under pH 1.7 and it was confirmed to be creatine (Figure 1b) by comparing the migration time with that of the standard solution of creatine. However, the existing impurity would not disturb the determination of the pKa values of the PC analyte. According to Equation 3, the pKa values were simulated using the measured data of μeff of the PC analyte (Figure 3). In this study, pKa1 for the first degree of the dissociation of phosphate was estimated to be less than 1.70 because of the intrinsic limitation of the CE performance at low pH of BGE condition. The other three thermodynamic pKa values were listed in Table 2.

Figure 2: Typical electropherograms at different pH running conditions. The pCE condition is described in section 2.2 and the BGEs information is given in Table 1. 1: EOF marker (DMSO); 2: Phosphocreatine (PC); 3: hydrolysis degradant (Creatine).

Figure 3: Fitted sigmoidal curve with the effective electrophoretic mobilities of Phosphocreatine (PC) against the pH values of BGEs.
| This study by pCEa | Literature values by potentiometrya | |||
|---|---|---|---|---|
| Dissociable group |  |
Meyerhof et al. [17] | Goldberg et al. [18] | Szyfman et al.b [19] |
| First H of P moiety (pKa1) | <1.70 | <1.9 | / | 1.86 ± 0.09 |
| Carboxy group (pKa2/sub>) | 2.78 ± 0.02 | 2.7 | 3.04 | 2.12 ± 0.02 |
| Second H of P moiety (pKa3) | 4.50 ± 0.06 | 4.5 | 5.07 | 4.24 |
| Guanidine (pKa4) | 11.51 ± 0.13 | 11.2 | 10.6 | 11.04 |
aAll the measurements were performed at 25°C. bThe pKa values were determined under I=0.1 M.
Table 2. pKa values determined by pCE method and the comparison with the literature values.
| pH | Regression equation | Correlation coefficient | kobsd (10-3/min-1) |
|---|---|---|---|
| 2 | ln (c/c0)=-0.0091t-0.0123 | 0.9962 | 9.1±0.05 |
| 3 | ln (c/c0)=-0.0089t-0.0510 | 0.9978 | 8.9±0.04 |
| 4 | ln (c/c0)=-0.0078t-0.0055 | 0.9993 | 7.8±0.02 |
| 5 | ln (c/c0)=-0.0027t+0.0015 | 0.9999 | 2.7±0.03 |
| 6 | ln (c/c0)=-0.0004t-0.0015 | 0.999 | 0.4±0.01 |
| 7 | ln (c/c0)=-0.0004t+0.0004 | 0.9991 | 0.4±0.01 |
Table 3. The hydrolysis kinetic study of regression analysis and the observed first order rate constants at 25°C.
Determination of hydrolysis rate constants by the pCE method
In order to assess how the properties of pH-dependent hydrolysis influence on pKa measurements of PC analyte, it is necessary to conduct kinetic hydrolysis study under acidic pH conditions with the same ionic strength as that of pKa determination. The typical separation profiles at pH 2.0 at different hydrolysis time were depicted in Figure 4 where the peak area of PC decreased with the hydrolysis time while the peak area of hydrolysis degradant increased correspondingly. The peak area of quinine as the internal standard for the quantitative calibration was almost unchanged suggesting the robust of the pCE running operation. It was assumed that in this hydrolysis reaction, the hydrolysis rate under a given pH only depended on the concentration of PC, thus the hydrolysis of PC would follow pseudo-first order kinetic and the rate constant (kobsd) could be described as Equation 8.
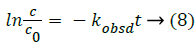

Figure 4: Electropherograms at different hydrolysis time for phosphocreatine hydrolyzed at pH 2.0. The pCE condition was described in section 2.2, the BGE of phosphate buffer solution (pH 7.5) given in Table 1. 1: Internal standard substance (quinine); 2: Hydrolysate (Creatine); 3: Phosphocreatine (PC).
where kobsd was the observed first order rate constant. c0 was the initial concentration of PC, c was the concentration of PC at a hydrolysis time t, APC,0, Aquinine,0 were initial peak areas of PC and quinine, the internal standard for the quantitative calibration at a given pH, respectively. APC, Aquinine were peak areas of PC and quinine at a hydrolysis time t at a given pH, respectively.
According to Equation 8, good pseudo-first order hydrolysis kinetics of PC under acidic conditions was obtained (Figure 5). The corresponding kobsd values at different pH were listed in Table 3. In this study, the kobsd values were approximately half less than those of the reported values at the corresponding pH conditions for the another purpose of assessing the phosphorylation reaction of PC in vivo [17], which could be attributed to the lower temperature and lower ionic strength involved on the hydrolysis reactions. It could be confirmed that the analyte of PC possesses the characteristics of pH-dependent hydrolysis property under the conditions of pKa measurements. The hydrolysis reaction at pH lower than 4.0 was much faster, while as pH increased to 5.0, the hydrolysis rate decreased significantly. The hydrolysis degradation would obviously affect the actual concentration of the analyte of PC, well explaining the variance of published pKa values using the same potentiometric method at different laboratories. As pH increased further to be 6.0 or 7.0, the stability of the analyte could be observed with an almost constant concentration level for the analyte of PC during the hydrolysis process concerned, which further suggesting the rational for its injection administration in clinical practice.

Figure 5: Fitted kinetic hydrolysis curves of phosphocreatine with pH range of 2.0 to 7.0.
Conclusions
In this study, an optimized pCE method was developed for the determination of pKa values of phosphocreatine and characterizing its pH-dependent hydrolysis properties, well explaining the variances from different laboratories using the same potentiometric method. It should be more practical using the developed pCE method for accurate pKa measurements for phosphocreatine overcoming the challenge accompanied with the hydrolysis degradation under acidic conditions.
References
- Kerns EH, Di L. Drug-like properties: concepts, structure design and methods: from ADME to toxicity optimization (1st Ed.). Elsevier Oxford 2008; 48-55.
- Craig CR, Stitzel RE. Modern pharmacology (3rd Ed.). Little, Brown and Company, London 1990; 21-92.
- Babic S, Horvat AJM, Pavlovic DM, Kastelan-Macan M. Determination of pKa values of active pharmaceutical ingredients. TrAC Trends Anal Chem 2007; 26: 1043-1061.
- Albert A, Serjeant EP. The determination of ionization constant. Chapman and Hall London 1984.
- Avdeef A, Box KJ, Comer JEA, Gilges M, Hadley M, Hibbert C, Patterson W, Tam KY. PH-metric log P 11 pKa determination of water-insoluble drugs in organic solvent-water mixtures. J Pharm Biomed Anal 1999; 20: 631-641.
- Martinez V, Maguregui MI, Jimenez RM, Alonso RM. Determination of the pKa values of ß-blockers by automated potentiometric titrations. J Pharm Biomed Anal 2000; 23: 459-468.
- Poole SK, Patel S, Dehring K, Workman H, Poole CF. Determination of acid dissociation constants by capillary electrophoresis. J Chromatogr A 2004; 1037: 445-454.
- Zevatskii YE, Samoilov DV, McHedlov-Petrosyan NO. Contemporary methods for the experimental determination of dissociation constants of organic acids in solutions. Russ J Gen Chem 2009; 79: 1859-1889.
- Reijenga J, van Hoof A, van Loon A, Teunissen B. Development of methods for the determination of pKa values. Anal Chem Insights 2013; 8: 53-71.
- Nowak P, Wozniakiewicz M, Koscielniak P. Application of capillary electrophoresis in determination of acid dissociation constant values. J Chromatogr A 2015; 1377: 1-12.
- Jia ZJ, Ramstad T, Zhong M. Medium-throughput pKa screening of pharmaceuticals by pressure-assisted capillary electrophoresis. Electrophoresis 2001; 22: 1112-1118.
- Wan H, Holmen A, Nagard M, Lindberg W. Rapid screening of pKa values of pharmaceuticals by pressure-assisted capillary electrophoresis combined with short-end injection. J Chromatogr A 2002; 979: 369-377.
- Wang JL, Xu XJ, Chen DY. Determination of pKa values of a triptolide derivative and its impurities by pressure-assisted capillary electrophoresis. J Pharm Biomed Anal 2014; 88: 22-26.
- Konasova R, Dytrtova JJ, Kasicka V. Determination of acid dissociation constants of triazole fungicides by pressure assisted capillary electrophoresis. J Chromatogr A 2015; 1408: 243-249.
- Wallimann T, Wyss M, Brdiczka D, Nicolay K, Eppenberger HM. Intracellular compartmentation, structure and function of creatine kinase isoenzymes in tissues with high and fluctuating energy demands: the phosphocreatine circuit for cellular energy homeostasis. Biochem J 1992; 281: 21-40.
- Strumia E, Pelliccia F, Dambrosio G. Creatine phosphate: pharmacological and clinical perspectives. Adv Ther 2012; 29: 99-123.
- Wang JL, Xu XJ, Chen DY. Determination of pKa values of a triptolide derivative and its impurities by pressure-assisted capillary electrophoresis. J Pharm Biomed Anal 2014; 88: 22-26.
- Goldberg RN, Lang BE, Lo C, Ross DJ, Tewari YB. Thermodynamics of the hydrolysis reactions of a-D-galactose 1-phosphate, sn-glycerol 3-phosphate, 4-nitrophenyl phosphate, phosphocreatine, and 3-phospho-D-glycerate. J Chem Thermodyn 2009; 41: 654-665.
- Szyfman NW, Tenorio T, Ribeiro TS, Felcman J, Merce ALR. Synthesis of novel binary and ternary Zn2+ complexes with putrescine and phosphocreatine and the metal complexes study in aqueous solution. J Mol Struct 2014; 1074: 467-474.
- Vcelakova K, Zuskova I, Kenndler E, Gas B. Determination of cationic mobilities and pKa values of 22 amino acids by capillary zone electrophoresis. Electrophoresis 2004; 25: 309-317.
- Solínova V, Kasicka V, Koval D, Cesnek M, Holy A. Determination of acid–base dissociation constants of amino- and guanidinopurine nucleotide analogs and related compounds by capillary zone electrophoresis, Electrophoresis 2006; 27: 1006-1019.
- Aolaanovaj V, Kaajiaka V. Determination of acidity constants and ionic mobilities of polyprotic peptide hormones by CZE. Electrophoresis 2013; 34: 2655-2665.
- Toshio T, Daichi I, Hitoshi M. Analysis of acid dissociation equilibrium of bupropion by capillary zone electrophoresis after the heat-degradation. Chromatography 2016; 37: 105-109.
- Takayanagi T, Tabara A, Kaneta T. Determination of Acid dissociation constant of degradable tetrabromophenolphthalein ethyl ester by capillary zone electrophoresis. Anal Sci 2013; 29: 547-552.
- Lipka E, Folly-Klan M, Charton J, Vaccher MP, Bonte JP, Vaccher C. Determination of pKa values of benzimidazole derivatives from mobility obtained by capillary electrophoresis. Pharm Biomed Anal 2010; 53: 1267-1271.