Research Article - Biomedical Research (2018) Volume 29, Issue 9
Detection of diabetic retinopathy using computational model of human visual system
Masoud Khazaee Fadafen*, Nasser Mehrshad and Seyyed Mohammad Razavi
Department of Electrical and Computer Engineering, University of Birjand, Birjand, Iran
- *Corresponding Author:
- Masoud Khazaee Fadafen
Department of Electrical and Computer Engineering
University of Birjand, Birjand, Iran
Accepted date: April 03, 2018
DOI: 10.4066/biomedicalresearch.29-18-551
Visit for more related articles at Biomedical ResearchAbstract
Background: Diabetic retinopathy is one of the main causes of blindness and the most important complication of diabetes. The accurate analysis of retinal images is important in diagnosing this disease. In this study, a powerful and accurate algorithm for diagnosis of diabetic retinopathy, inspired by the human visual system, is presented based on the rapid sensitivity of the human visual system to intensity, direction and color.
Materials and Methods: In this study, DIARETDB1 database containing selected images for diagnosis of diabetic retinopathy has been used. The Matlab R2013a software is used in Windows 7 with 2.5 GHz processor and 4 GHz RAM memory to implement various algorithms for images saliency maps.
Results: The proposed method and four models of the existing methods on the DIARETDB1 database were tested, the results of which were based on visual comparison of the results, drawing the ROC curve and calculating the AUC of the models, showed the optimal performance of the proposed algorithm in comparison with other algorithms. The AUC of the proposed method was 0.9012, which in comparison with other methods is the highest value, indicating the proper function of this method in determining the correctness of image saliencies.
Conclusion: The positive results from the proposed algorithm, which are based on image processing techniques and inspired by the human visual system, suggest that using this method can help ophthalmologists to diagnose fast, accurate, and reliable diabetic retinopathy.
Keywords
Diabetic retinopathy, Human visual system, Image processing, Retinal images, Simple cell computational model
Introduction
Diabetic Retinopathy (DR) is a general term used to express vascular problems in the retina of the diabetic patients. The retina is actually the end of the eye, the image of objects around the environment passing through the pupil, the cornea, and the space inside the eye, is sent to the brain as a comprehension message so that we can see it. Diabetic retinopathy is one of the main causes of blindness and the complications of diabetes [1]. Since vision is gradually reduced in most cases, early diagnosis of diabetes can increase the chance of preventing blindness and blurred vision [2]. Today, FUNDUS images are widely used to check the status of the retina and its related diseases. By examining these images, doctors can detect eye diseases such as cataracts, black water, and diabetes, and control their progression. Therefore, examination of retinal vascular properties by using image processing techniques can increase the speed, accuracy and reliability of the diagnosis and treatment process, and, on the other hand, reduce the cost of treatment. Several methods for diagnosis of diabetic retinopathy are presented using image processing techniques.
Abbadi et al. presented an automatic method for detecting lesions and exudates in the retina image [3]. In this study, texture analysis technique was used to calculate the texture based on the histogram of intensity. In their pre-processing step, they used the green channel to better detect optic discs and exudates. After removing the optic disc, they extracted the exudates with a real threshold according to their shape and diameter. The results of applying the proposed method on standard database data have promising results. Zhang et al. used two-dimensional Gabor filters for segmentation [4]. Of the two different values for σ, a large amount was used for larger vessels and a smaller value for smaller vessels. In this study, a hysteresis threshold was used to diagnose all types of vessels. The proposed method was tested on the DRIVE database and acceptable results. Youssef et al. proposed a new technique for vascular detection [5]. In this study, an edge detection algorithm was used to create an initial segmentation on the images, and then a feature-based algorithm was used to detect more precisely the blood vessels. This algorithm takes features such as brightness, width and direction for the purpose of segmentation from the characteristics of the blood vessels. The blood vessels were extracted and the optic disc was deduced from each other on an illustrated image of an exudate. Finally, extracted exudates were reconstructed using morphological operators; the results of this method were acceptable. In this research, a powerful and accurate algorithm for diagnosis of diabetic retinopathy inspired by the human visual system is presented based on the rapid sensitivity of the human eye system to intensity, direction and color.
Materials and Methods
In this study, DIARETDB1 database containing selected images for diagnosis of diabetic retinopathy has been used [6]. The Matlab R2013a software is used in Windows 7 with 2.5 GHz processor and 4 GHz RAM memory to implement various algorithms for images saliency maps. The proposed algorithm, which includes the simple computational model of the simple cell of the visual cortex in three scales and six directions, is simulated with four other models for extracting the properties of the database images in the MATLAB software environment, and the results obtained for drawing the ROC (Receiver Operating Characteristic) and AUC (Area under Curve) was used.
Computational model of simple cell and complex cell of the human visual cortex [7]
Complete implementation of computational model of Human Visual System (HVS) through its physiology for applications of image processing is not possible due to much complexity. So the computational models have been developed from various aspects of HVS through psych vision observations or sequential processing of visual information in various layers of visual cortex. An important achievement which was obtained in the neuronal physiology field in the visual systems of monkeys and cats in 1960 was most of neurons in the primary visual cortex response to line or edge in a specified direction and in a certain location of visibility [8-10]. There are two types of sensitive cell in the visual cortex, those cells which are sensitive to polarity of contrast of lines and edges called simple cells and that cells which are not sensitive to this polarity called complex cells. Properties of local gather of the simple cell can be modeled with a family of two-dimensional Gabor functions. Equation (1) indicates the receptive field (strike response) of the cell hλ,σ,θ,φ (x, y), 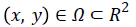 that its center is in origin [8]. In the equation λ is a consonant value and called ratio of local effect. The parameter indicates the level of ellipticity of the receptive field. Standard deviation (σ) specifies the Gaussian factor of size of the receptive field. λ is wavelength and its reverse indicates local frequency of cosine factor. Ratio of σ/λ specifies bandwidth of local frequency. θ specifies preferential direction. (θ ?(0, π)). φ is a phase compensation that specifies polarity of Sλ,σ,θ,φ (x, y) to origin (φ ?π). For φ=0 and φ=π it is polar (pair) and for φ=-π/2 and φ=π/2 is non-polar (odd) and also it is non-polar for all other values of φ.
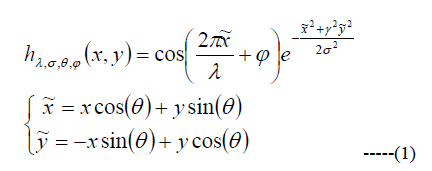
Response of Sλ,σ,θ,φ (x, y) simple cell with receptive field function of hλ,σ,θ,φ (x, y), to the input image with illumination distribution of i (x, y) is computed by the following equation:
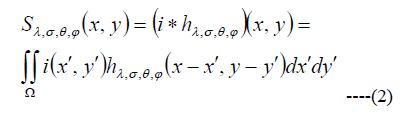
The complex cell model combines response of a pair of simple cell with phase difference of 90 degrees [10]. Results of polar and anti-polar pairs  are combined as following in complex cell models Cλ,σ,θ,φ (x, y) (Gabor energy).
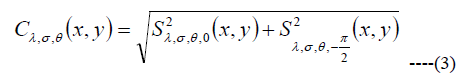
It can be shown that Gabor energy is equal to square root of the local power spectrum in direction and given band pass local frequency [9].
Findings
Given that the direction is a powerful stimulant that human visual system responses to that and causes to determination of the directional saliency map of object in this stage through computational model of simple cell of the human visual system explained in part 1-3 and through equations (1) and (3), the related Gabor filters are applied in six directions and Three scales σ=3.0632…, 4.5920…., 6.1208 (λ=σ/0.56, γ=1). The general process steps of this algorithm are shown in Figure 1.

Figure 1: The proposed algorithm.
Discussion
The proposed method on the DIARETDB1 database, which contains 89 selected images for diagnosis of diabetic retinopathy, was tested and compared with four models of the methods used in detection saliency map. Proposed algorithm while maintaining vascular main information based on the visual comparison of results, the ROC curve and calculated AUC values are more favourable than other methods.
Dupas et al. conducted two potential analyzes of FUNDUS images on diabetic patients [11]. In this study, automatic detection of micro-aneurysms and exudates on a small database with manually identified lesions on them were tested. This method did not have high accuracy, but reduced the amount of time consumed when data was high.
Shojaei et al. used a dataset containing 150 retinal images from the Imaging Center database of Khatam Al Anbia Ophthalmology Hospital [2]. 70% of the images used as educational images and 30% as test images. In this study, Gaussian filters and violet transforms were used to improve the images and to isolate the vessels with high intensity. Then, based on some criteria, for example, the density of the vessels, the position of the optic disc was determined, with their extraction, areas containing exudate were identified and finally the classification of the images was done. The proposed algorithm in this study was of low complexity and its computational burden was low.
Ketki et al. proposed automatic detection of diabetic retinopathy using image processing and data mining techniques [12]. In this research, algorithms such as sobel edge detection, K-Nearest Neighbor (KNN), histogram thresholding and classification were used using data mining techniques such as decision tree. Using this method reduces the time needed for diagnosis and analysis of physicians, and, on the other hand, reduces the cost of identification and allows early diagnosis of retinal diseases.
Anupama et al. suggested the automatic detection of diabetic retinopathy using entropy thresholds [13]. In this method, the negative effects of light texture of retinal images were reduced by using cluster segmentation by image processing methods, and then to ignore dark textures from one multi-dimensional linear operator was used. In this algorithm, the Gabor filter is designed with the threshold of local entropy for extraction of blood vessels in normal and abnormal conditions. The results of this algorithm were satisfactory.
Monzurul et al. proposed the automatic detection of diabetic retinopathy using the BOW (Bag of Words) method [14]. In an image, each part in a region contains a descriptor that creates a point in the property space. Points of Interest are detected using (SURF) the Speeded Up Robust Features and SURF features are extracted from the images. These attributes are assigned to clusters using the K-means clustering algorithm. The centers of the clusters show the words; these words form the whole BOW (vocabulary). All the specified attributes in the image are assigned to the nearest word (the center of the cluster), and thus the image is represented by a histogram, each bin indicating the frequency of a word in the dictionary (BOW). The histogram is encoded into a one-dimensional feature, and then given to the SVM classifier. This algorithm has a high computational load.
In recent years, researchers have proposed algorithms such as image enhancement, segmentation and feature extraction, morphology and classification operators, as well as systems for automatically identifying diabetic retinopathy characteristics [15-22]. However, there is still a need to further improve the accuracy of the diagnosis.
Conclusion
The proposed method on the DIARETDB1 database, which includes 89 selected images for the diagnosis of diabetic retinopathy, was tested and with four models of methods available for recognizing saliencies including IT Itti's, frequency tuned method (FT) model, the spectral residual approach (SR) model, the SDSP model: a novel saliency detection method by combining simple prior has been compared [23-26]. The performance of these detection models is shown in Figure 2. As we see in Figure 2, in the visual comparison of results. The proposed method, while retaining the main image information (vessels), highlights the image points in comparison to the other four models with better quality. To evaluate the performance of the proposed method with other methods using Ground truth images, the ROC curve (Figure 3) and the AUC calculation were used. Given the AUC values calculated in Table 1, this parameter has the highest value in the proposed method. The results of the visual comparison, the ROC curve and the calculated AUC values indicate the desired performance of the proposed method compared to other methods.

Figure 2: The visual comparison of the results of the proposed method with four IT, FT, SDSP, and SR methods.
| Model | IT | SR | FT | SDSP | OUR |
|---|---|---|---|---|---|
| AUC | 0.7919 | 0.564 | 0.8512 | 0.8845 | 0.9012 |
Table 1: Compare the AUC of the models on the DIARETDB1 database.

Figure 3: Compare the ROC curves of models on the DIARETDB1 database.
Considering that the most effective treatment for diabetic retinopathy is early diagnosis through regular, accurate, and automatic observation of retina images through ophthalmologists and, on the other hand, retina images usually have a bit of clarity, which makes it difficult to analyze images for professionals. The positive results from the proposed algorithm, which are based on image processing techniques and inspired by the human visual system, suggest that using this technique can help ophthalmologists to diagnose fast, accurate, and reliable diabetic retinopathy. This model can also be used to improve other medical images such as MRI, CT and etc.
References
- Singh N, Tripathi RC. Automated early detection of diabetic retinopathy using image analysis techniques. Int J Computer Appl 2010; 8: 18-23 .
- Shojaeipour A, Nordin MJ, Hadavi N. Using image processing methods for diagnosis diabetic retinopathy. Robotics Manufacturing Automation (ROMA), 2014 IEEE International Symposium on IEEE 2014 .
- El Abbadi NK, Al-Saadi EH. Automatic detection of exudates in retinal images. Int J Comp Sci Issues (IJCSI) 2013; 10.
- Zhang L, Li Q, You J, Zhang D. A modified matched filter with double-sided thresholding for screening proliferative diabetic retinopathy. IEEE Transactions on Information Technology in Biomedicine 2009; 13: 528-534 .
- Youssef D, Solouma NH. Accurate detection of blood vessels improves the detection of exudates in color fundus images. Computer Methods Programs Biomed 2012; 108: 1052-1061 .
- Kauppi T, Kalesnykiene V, Kamarainen JK, Lensu L, Sorri I, Raninen A. The DIARETDB1 diabetic retinopathy database and evaluation protocol. BMVC 2007 .
- Chaji N, Ghassemian H. Texture-gradient-based contour detection. EURASIP J Appl Signal Processing 2006; 5-10.
- Grigorescu C, Petkov N, Westenberg MA. Contour detection based on nonclassical receptive field inhibition. IEEE Transactions on Image Processing 2003; 12: 729-739 .
- Grigorescu SE, Petkov N, Kruizinga P. Comparison of texture features based on Gabor filters. IEEE Transactions on Image Processing 2002; 11: 1160-1167 .
- Petkov N, Westenberg MA. Suppression of contour perception by band-limited noise and its relation to non-classical receptive field inhibition. Biol Cybernetics 2003; 88: 236-246 .
- Dupas B, Walter T, Erginay A, Ordonez R, Deb-Joardar N, Gain P. Evaluation of automated fundus photograph analysis algorithms for detecting microaneurysms, haemorrhages and exudates, and of a computer-assisted diagnostic system for grading diabetic retinopathy. Diabetes Metab 2010; 36: 213-220 .
- Argade KS, Deshmukh KA, Narkhede MM, Sonawane NN, Jore S. Automatic detection of diabetic retinopathy using image processing and data mining techniques. Green Computing and Internet of Things (ICGCIoT) International Conference on 2015 .
- Anupama B, Ramakrishna D. Automativ diabetic retinopathy detection using entropy thresholding. International Journal of Electronics and Communication Engineering 2017; 78-82 .
- Islam M, Dinh AV, Wahid KA. Automated diabetic retinopathy detection sing bag of words approach. J Biomed Sci Eng 2017; 10: 86 .
- Yasmin M, Sharif M, Masood S, Raza M, Mohsin S. Brain image enhancement-A survey. World Appl Sci J 2012; 17: 1192-1204 .
- Sharif M, Raza M, Mohsin S, Shah JH. Microscopic feature extraction method. Int J Adv Networking Applications 2013; 4: 1700 .
- Sri RM, Rao K. Novel image processing techniques to detect lesions using lab view. India Conference (INDICON) 2011 .
- Bulsara V, Bothra S, Sharma P, Rao K. Low cost medical image processing system for rural/semi urban healthcare. Recent Advances in Intelligent Computational Systems (RAICS) 2011.
- Larsen M, Godt J, Larsen N, Lund-Andersen H, Sjølie AK, Agardh E. Automated detection of fundus photographic red lesions in diabetic retinopathy. Invest Ophthalmol Visual Sci 2003; 44: 61.
- Usher D, Dumskyj M, Himaga M, Williamson TH, Nussey S, Boyce J. Automated detection of diabetic retinopathy in digital retinal images: a tool for diabetic retinopathy screening. Diabetic Med 2004; 21: 84-90.
- Xiaohui Z, Chutatape A. Detection and classification of bright lesions in color fundus images. Image Processing 2004.
- Saranya M, Selvarani AG. Fundus image screening for diabetic retinopathy. Indian J Sci Technol 2016; 9.
- Itti L, Koch C, Niebur E. A model of saliency-based visual attention for rapid scene analysis. IEEE Transactions on Pattern Analysis and Machine Intelligence 1998; 20: 1254-1259 .
- Achanta R, Hemami S, Estrada F, Susstrunk S. Frequency-tuned salient region detection. Computer Vision and Pattern Recognition 2009 .
- Hou X, Zhang L. Saliency detection: A spectral residual approach. Computer Vision and Pattern Recognition 2007.
- Zhang L, Gu Z, Li H. SDSP: A novel saliency detection method by combining simple priors. Image Processing (ICIP) 2013 .