Research Article - Research and Reports on Genetics (2018) Volume 2, Issue 1
Derivation of economic weights of milk components as selection criteria for genetic improvement of dairy animals.
Gwaza DS1*, Mohammed G2, Addas PA11Department of Animal Breeding and Physiology, University of Agriculture, Makurdi, Nigeria
2Faculty of Agriculture, Federal University, Gashua, Yobe State, Nigeria
- *Corresponding Author:
- Gwaza DS
Department of Animal Breeding and Physiology
University of Agriculture
Nigeria
Tel: 234445332045
E-mail: gwazadeeve@yahoo.com
Accepted Date: January 16, 2018
Citation: Gwaza DS, Mohammed G, Addas PA. Derivation of economic weights of milk components as selection criteria for genetic improvement of dairy animals. J Res Rep Genet. 2018;2(1):7-13
Abstract
Economic weights of milk yield, protein and fat percent for Holstein Friesian Bunaji crossbreds and Holstein Friesian dairy cows in North Central Nigeria were studied. Economic data collected were Fixed cost (N/year), feed cost (N/year), calf price (N/calf) and milk price (N/litre) Technical data were fertility (calving/per year/cow), prolificacy, longevity (year), milk yield (kg/cow in flock), fat and protein yield (kg/lactation) and fat and protein contents (%) from two government (National Veterinary Research Institute Vom and Agricultural Services and Training Centre, Jos) and two commercial private farms (Farm Fresh Jos and Nagari Farm, Keffi). Profit equations were used to predict the economic weights of primary components of milk (fat, protein and carrier). The values obtained were 163.15, 234.94, 147.05, 226.10, 261.05, 334.42, 242.42, 314.84, -4.42, -4.42, -4.42, -2.84, respectively. Results indicated that economic values for protein were higher in all the farms than any other components of milk. For carrier economic weights were negative in all the farms because an increase in carrier production without changes in fat and protein composition leads to an increase in energy demands, holding the sale price of milk constant. Given the economic importance of protein component of the milk, it should be given higher weight during selection for breeding program.
Keywords
Bunaji, Economic-weight, Holstein-Friesian, Profit-equation.
Introduction
Economic values of traits are necessary to determine the relative importance of the traits in the breeding objective. Economic value of milk, fat and protein production was first calculated for the Estonian cattle population in 1997 [1,2] and of some functional traits in 2002 [3]. Annual genetic responses in milk, fat and protein yield were estimated to be 57.4 kg, 1.98 kg and 1.67 kg, respectively [4]. The increase in prices of inputs for agricultural enterprises had not been balance by the prices of the output. According to Groen et al. [5] milk production is restricted to lactation periods, and as such decrease in milk prices can be supported by functional traits, such as reproductive traits. These might have a greater impact on the profit of dairy farmers, and should therefore, be given attention in breeding programmes. Banga et al. [6] reported that breed had no effect on economic values of milk components. This according to the author was so because change in profit per unit increase of a milk component is determine by the payment price per unit of that component and the cost of the extra feed required to produce it. There are also ethical reasons and consumer preferences. These had become important to be considered in a breeding program [5,7]. The inclusion of functional traits in breeding programmes objectives will have a major impact on the expected selection response of the functional traits [8].
Two approaches had being used to derive economic values, the normative approach and the positive approach. The normative approach, which studies the behavior of a bio-economic model or profit function to changes in underlying parameters and assumptions, is most frequently used [9,10]. Deriving economic values for different perspectives would give different answers. The positive approach, base on analysis of field data, is seldom use to derive economic values especially in developing countries, because of instability of product prices. The evaluation of economic value uses current prices, while breeding is oriented towards the future at which evaluated prices may not be attainable [5,10]. However, using projected future prices to calculate cow profitability could eliminate this drawback.
The profit function (normative approach) which should consider the cost of all components [11,12] always had a challenge. This is because cost of some components are not known, may be farm specific, prices of some components may vary from one farm to another, either affected by seasons, highly unstable or unpredictable, especially under the low capacity of the developing countries for processing, preservation and value addition. Another challenge of the profit function may either be poor recording of reproductive traits or poor reproductive performance.
Given the challenges of the use of historical or current price for deriving profit function in a breeding program oriented for the future at which the price may deviate from historical value, this study used average values from sales of milk component over years for four farms. The study also included reproductive capacity records of the herds. The use of the average values of prices of economic traits will reduce the deviation between the historical price and that oriented for the future by breeding objective. The objectives of this study were to derive economic weights and profit equations for the major components of milk in Holstein Friesian Bunaji crossbreds and the Holstein Friesian cows.
Materials and Methods
Location of the study
The study was carried out in two towns of Nigeria, Jos and Keffi of Plateau and Nasarawa states, respectively. Two commercial farms (Farm fresh Jos and Nagari farm Keffi) and two government farms (National Veterinary Research Institute, Vom and Agricultural Services and Training Centre, Jos) were chosen for the study. Plateau State is situated in the tropical zone, has a near temperate climate with an average temperature range of 18 to 22°C. Harmattan winds cause the coldest weather between December and February. The warmest temperatures usually occur in the dry season (March and April). The mean annual rainfall varies from 131.75 cm (52 in) in the southern part to 146 cm (57 in) on the Plateau. The peak rainfall occured during the wet season (July to August). Nasarawa State lies within the guinea Savannah region of Nigeria and has tropical climate with moderate rainfall (annual mean rainfall of 1311:75 cm) with average annual temperature of 28.4°C. Nasarawa state had plain lands and hills measuring up to 300 ft above the sea level at some points.
Animals and management
Animals were reared under semi -intensive system on natural and established pasture for grazing. Concentrate feed was provided as supplements. Routine medication and vaccination were administered. Animals were milk twice a day (morning and evening) in all the farms. Calves were allowed to suckle their dam for few days, after which they were separated and bucket-fed with whole milk in the morning and evening.
Experimental procedure and parameters that were measure
Data used for the study were extracted from records kept for Bunaji Holstein Friesian crossbred and Holstein Friesian cows from 2010 to 2015. Reproductive traits like, fertility (calving/ year per cow), longevity (lactation no.) average no. of cow per farm, no of cows in milk, milk yield (kg/cow in flock), protein and fat yield (kg/lactation) were measured. Economic parameters measured were milk price (₦/year), feed cost (₦/ year), fixed cost (₦/year) and calf price (₦/calf).
Data analysis
Estimation of base price of milk: Base milk price were obtained from milk sales to the public. The final milk price paid to the farmers was taken as the reference market value. This value was expressed in Naira (₦) per hectograde of (milk) dry useful matter (i.e., the sum of fat and protein contents expressed as percentages divided by 100). Base milk price was set by using the following equation:
 (1)
(1)
Where
Milk Pricebase=base milk price
Milk Priceref=final milk price paid to the farmer
Income (I) from milk sales was calculated as:
Imilk (₦/cow per year)=milk yield×milk pricebase (2)
Where Imilk=income from sales of whole milk
Milk Pricebase=base milk price.
When fat and protein yields were used instead of whole milk equation (2) was modified to
Imilk (₦/cow per year)=Milk Priceref×(fat yield+protein yield) (3)
Where
Milk Priceref=final milk price paid to the farmer
Fat and protein content were estimated using the following equation
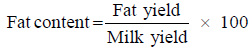 (4a)
(4a)
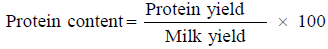 (4b)
(4b)
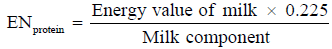
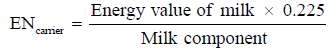
Estimation of expenses associated with milk production: Expenses associated with milk production were calculated using the energy needs necessary to produce each the components of milk, fat, protein, and carrier [13]. Energy needs to produce milk is equal to the amount of energy present in milk [14]. Energy content of milk was splited into each of milk components: fat, protein, and volume. For dairy cattle, Wilmink [15] and Colleau [14] reported that the energy necessary to produce 1 kg of milk was distributed in proportions of 55, 22.5, and 22.5% to produce fat, protein and volume respectively.
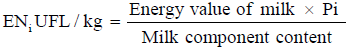 (5)
(5)
Where
EN=the energy needs (UFL) to produce 1 kg of milk
I=represents milk components (fat , protein and carrier) and
Pi=the proportion of the total energy necessary to produce each of the components of milk.
Therefore
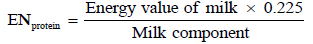 (6)
(6)
 (7)
(7)
 (8)
(8)
Where
ENfat=energy necessary to produce fat component
ENprotein=energy necessary to produce protein component
ENcarrier=energy necessary to produce each of the component.
Estimation of feed cost: Feed cost associated with milk production was estimated using the relationship between total energy content of feed, energy requirement of the flock for milk production and total expenses associated with feedstuff. Using this relationship feed cost was translated into unit cost per unit energy content of feed. The price per unit energy of feed (UFL) was calculated as shown in eqn. (9)
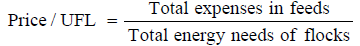 (9)
(9)
Where
UFL=unit energy content of feed.
Expenses associated with milk sales: Expenses from milk sales was estimated as shown in eqn. (11)
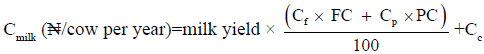 (11)
(11)
Where,
Cf , Cp and Cc=the reference expenses associated with fat, protein, and carrier production
FC and PC=fat content and PC protein content respectively.
When fat and protein yields were used instead of contents equation 10 was moderated as follows:
Cmilk(₦/cow per year)=CF × FY+CP×PY+CC×CY (12)
Where
FY=fat yield
PY=protein yield
CY=carrier yield
Estimation of profits from milk and milk components: Economic weights were calculated using profit functions [16-18] where profit (P) is defined as the difference between incomes (I) and costs (C): P=I−C. Therefore, the total profit obtained from milk production as a function of milk fat, protein and carrier yields were derived from eqns. (3) and (11) as follows:
Pmilk (₦/cow per year)=MilkPriceref×(FY+PY)–(CF×FY+CP×PY+CC×CY) (13)
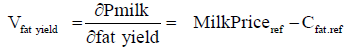
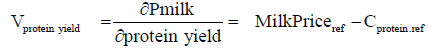
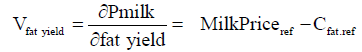
Derivation of economic weights using profit equation: Economic value of a trait expresses to what extent the economic efficiency of production is improved at the moment of one unit increase of the genetic superiority for a trait [10]. In other words, the economic weight of trait defines the contribution to change in profit per unit change in the expression of the trait, given no change in the expression of the other traits. Economic value of a trait is therefore the partial derivative of the profit function in respect to that trait holding the other traits at constant levels. The economic weight of Fat, Protein and Carrier components of milk were derived using profit function as indicated in equations 14, 15 and 16, respectively.
 (14)
(14)
Where
Vfat yield=the economic value of fat
∂Pmilk=the partial derivative of the profit function fat
∂fat yield
MilkPriceref=reference milk price
C fat.ref=the cost of fat production.
 (15)
(15)
Where
Vprotein yield=the economic value of pprotein
∂Pmilk=the partial derivative of the profit function protein
∂protein yield
MilkPriceref=reference milk price
C protein.ref=the cost of protein production.
 (16)
(16)
Where
Vcarrier yield=the economic value of carreir
∂Pmilk=the partial derivative of the profit function fat
∂carrier yield
MilkPriceref=reference milk price
Ccarrier.ref=the cost of carrier production.
Results
Economics of production of the farms
Tables 1 and 2 showed the economics of prodution from the four farms (ASTC, Farm fresh, NVRI and Nagari). There was significant difference (P<0.05) in fixed cost (₦/year), feed cost (₦/year), milk price (N/litre) and calf price (₦/calf) between farms. Milk and calf price in Farm fresh (₦414.00/litre and ₦42,400/calf) and Nagari (₦396.00/litre and ₦16,800/calf) are higher than government own farms; ASTC (₦340.00/litre and ₦28,000/calf,) and NVRI (₦360.00/litre and ₦12,600/calf). Significant difference (P<0.05) also exist in fertility (calving/ year/cow) between ASTC and Farm fresh (0.74 ± 0.03b and 0.86 ± 0.03a ). No significant different (P>0.05) in lactation number (longevity) between the farms.
Table 1. Technical and economic data of Holstein Friesian cattle from ASTC, Jos (Government) and Farm Fresh, Jos (Private).
| Indicators | ASTC, Jos (Government) | Farm Fresh, Jos (Private) |
|---|---|---|
| Average number of cows | 46.44 ± 0.89b | 210.75 ± 2.40a |
| Number of cows in milk | 40.14 ± 0.91b | 178.12 ± 4.10a |
| Fertility (calving/year per cow) | 0.74 ± 0.03b | 0.86 ± 0.03a |
| Longevity (Lactation no.) | 4.00 ± 0.32a | 4.80 ± 0.20a |
| Milk yield (L/day/cow/ in flock) | 14.50 ± 0.15a | 13.38 ± 0.15b |
| Fixed cost (₦/year) | 677,060.00 ± 22,726.18b | 3,008,300.00 ± 89,060.45a |
| Feed cost ((₦/year) | 910,070.00 ± 21,488.06b | 4,007,800.00 ± 92138.11a |
| Milk price ((₦/L) | 340.00 ± 4.47b | 414.00 ± 9.80a |
| Calf price ((₦/calf) | 28,000.00 ± 1581.14b | 42,400.00 ± 1939.07a |
a,bMeans within the same rows with different superscripts are significantly different (P<0.05).
Table 2. Technical and economic data of Holstein Friesian * Bunaji Crosses from NVRI, Jos (Government) and Nagari Farm, Keffi (Private).
| Indicators | NVR1, Jos (Government) | Nagari Farm, Keffi (Private) |
|---|---|---|
| Average number of cows | 36.05 ± 1.70a | 37.17 ± 1.70a |
| Number of cows in milk | 12.57 ± 0.66b | 20.46 ± 0.42a |
| Fertility (calving/year per cow) | 0.79 ± 0.04a | 0.83 ± 0.03a |
| Longevity (Lactation no.) | 3.40 ± 0.24a | 4.00 ± 0.32a |
| Milk yield (L/day/cow in flock) | 4.50 ± 0.07a | 4.43 ± 0.04a |
| Fixed cost (₦/year) | 208,810.00 ± 12051.01a | 206,690.00 ± 4177.86a |
| Feed cost ((₦/year) | 282,860.00 ± 14938.65a | 286,420.00 ± 5897.65a |
| Milk price ((₦/L) | 316.00 ± 5.10b | 396 ± 9.27a |
| Calf price ((₦/calf), | 12,600.00 ± 871.78b | 16,800.00 ± 583.10a |
a,bMeans within the same rows with different superscripts are significantly different (P<0 .05).
Milk yield and composition
Milk yield and composition of Holstein Frisian is shown in Table 3. Milk yeild was highes on ASTC farm (4422.01 kg) compared to farm fresh (4079.60 kg). There was significant different (P<0.05) between fat yield (kg/lactation) (278.14 ± 2.31 and 253.74 ± 4.04) and protein yield (kg/lactation) (254.71 ± 2.89 and 232.95 ± 3. 46). No significant different (P>0.05) occurred between fat content (6.29 ± 0.08 and 6.21 ± 0.14%) and protein content (5.76 ± 0.09 and 5.71 ± 0.13). Milk yield and composition of Holstein Friesian and Bunaji crossbreds is shown in Table 4. The results showed that there was no significant difference (P>0.05) between milk yield in NVRI (1373.80 ± 5.77) and Nagari (1352.30 ± 5.77). Significant difference (P<0.05) existed between fat yield (kg/lactation) and protein yield (kg/lactation).
Table 3. Milk yield and composition of Holstein Friesian from ASTC, Jos (Government) and Farm Fresh, Jos (Private).
| Indicators | ASTC, Jos (Government) | Farm Fresh, Jos (Private) |
|---|---|---|
| Milk yield (kg/lactation)* | 4422.01 ± 11.55a | 4079.60 ± 5.77b |
| Fat yield (kg/lactation) | 278.14 ± 2.31a | 253.74 ± 4.04b |
| Protein yield (kg/lactation) | 254.71 ± 2.89a | 232.95 ± 3.46b |
| Fat content (%) | 6.29 ± 0.08a | 6.21 ± 0.14a |
| Protein content (%) | 5.76 ± 0.09a | 5.71 ± 0.13a |
*Calculated based on 305-day milk production.
a,b=Means within the same rows with different superscripts are significantly different (P<0.05).
Table 4. Milk yield and composition of Holstein Friesian Bunaji crossbreds cows from NVRI, Jos (Government) and Nagari Farm, Keffi (Private).
| Indicators | NVRI, Jos (Government) | Nagari Farm, Keffi (Private) |
|---|---|---|
| Milk yield (kg/lactation)* | 1373.80 ± 5.77a | 1352.30 ± 5.77a |
| Fat yield (kg/lactation) | 90.40 ± 2.31a | 51.31 ± 1.15b |
| Protein yield (kg/lactation) | 84.90 ± 0.58a | 47.33 ± 1.73b |
| Fat content (%) | 6.58 ± 0.06a | 4.09 ± 0.08b |
| Protein content (%) | 6.18 ± 0.04a | 3.50 ± 0.03b |
*Calculated based on 305-day milk production.
a,b=Means within the same rows with different superscripts are significantly different (P<0.05).
Expenses associated with milk production
Table 5 and 6 showed expenses (₦/kg) associated with the production of milk components (Fat, protein and carrier). The results indicated that expenses of 176.85, 179.06, 168.95, 169.90 (₦/kg) were associated with the production of milk. Fat had the highest cost across the farms when compared to expenses of the other milk components. Farm fresh recorded cost highest (N179.06 per kg). However, Table 7 showed the economic weight of the milk components while protein component of the milk had the highest values ₦261.05, ₦334.42, ₦242.42 and ₦314.84 in all the farms. Also, carrier had negative values -4.42, -4.42, -4.42 and -2.84 in all the farms.
Table 5. Expenses (₦/kg) associated with the production of milk fat, protein and carrier of cows.
| Farms | Fat | Protein | Carrier |
|---|---|---|---|
| ASTC, Jos | 176.85 | 78.95 | 4.42 |
| Farm Fresh, Jos | 179.06 | 79.58 | 4.42 |
| NVRI, Jos | 168.95 | 73.58 | 4.42 |
| Nagari Farm, Keffi | 169.90 | 81.16 | 2.84 |
Average cost of 1 UFL was put at ₦31.58
Table 6. Income, cost and profit (₦/cow/year) associated with milk production in the farms.
| Farms | Income | Cost | Profit |
|---|---|---|---|
| ASTC, Jos | 181,169.00 | 69,302.88 | 111,866.12 |
| Farm Fresh, Jos | 201,489.66 | 63,977.26 | 137,512.40 |
| NVRI, Jos | 55,394.80 | 21,524.44 | 33,870.36 |
| Nagari Farm, Keffi | 39,061.44 | 12,561.71 | 26,499.73 |
Table 7. Economic weights (N) for primary components of milk fat, protein and carrier of cows.
| Farms | Fat | Protein | Carrier |
|---|---|---|---|
| ASTC, Jos | 163.15 | 261.05 | -4.42 |
| Farm Fresh, Jos | 234.94 | 334.42 | -4.42 |
| NVRI, Jos | 147.05 | 242.42 | -4.42 |
| Nagari Farm, Keffi | 226.10 | 314.84 | -2.84 |
Income and profit (₦/cow/year) associated with milk production in the farms
Income and profit associated with milk production in all the farms are presented in Table 6. Farm fresh had the highest income (₦201, 489.66) per cow per year and profit (₦ 137,512.40) per cow per year followed by ASTC farm with income of (₦181,169.00) and profit of (₦111, 866.12). Nagari farm had the least income and profit (₦39,061.44) and profit of (₦26,499.73) per cow per year.
Economic weights (₦) of fat, protein and carrier components of milk
The economic weights associated with fat, protein and carrier contents are presented in Table 7. Protein had the highest economic weight in all the farms, with Farm fish recording the highest value. This was followed by the economic value of fat. Carrier content of milk recorded a deficit value.
The profit equations that delivered the economic weights of fat, protein and carrier components of milk from the farms are presented below.
For fat content: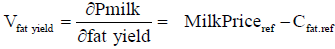
Where
Vfat yield=the economic value of fat
∂Pmilk=the partial derivative of the profit function for fat
∂fat yield
MilkPriceref=reference milk price
Cfat.ref=the cost of fat production.
For protein content:
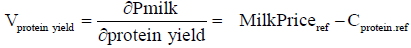
Where
Vprotein yield=the economic value of pprotein
∂Pmilk=the partial derivative of the profit function for protein
∂protein yield
MilkPriceref=reference milk price
Cprotein.ref=the cost of protein production.
For carrier content:
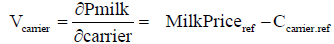
Where
Vcarrier yield=the economic value of carrier
∂Pmilk=the partial derivative of the profit function for carrier
∂carrier yield
MilkPriceref=reference milk price
Ccarrier.ref=the cost of carrier production.
Discussion
Technical and economic data
The significant difference (P<0.05) in fixed cost (₦/year), feed cost (₦/year), milk price (₦/litre) and calf price (₦/calf) between farms observed in the present study could be attributed to variation in total number of cows, cows in milk between the farms in the study area. The milk and calf price trend observed in this study between private commercial and government owned farms conforms to expectation because government owned farms are mainly for training and research purposes and not for profit making. Fertility (calving interval) depends more on physiological, management and nutritional status of the cow. The range obtained in this study was close to the average of 390 ± 3.2 days for Friesian and Bunaji crosses reported by Malau et al. [19] Also, it falls within the range of 342-402 days reported in Black Pied cows in Nigeria [20] 383-393 days reported in Friesian-Bunaji cows [21] and 394.6 days in Sahiwal cows [22].
The highest number of lactation obtained in this study (4.80 ± 0.20a) was below sixth lactation number reported by Afridi [23] and Malau et al. [19] Feed cost was the highest cost in the variable costs and among all the costs in the study. This agreed with Bahareh et al. [24] who observed that feed cost accounted to 77% of the total variable cost on his findings of economic weights of milk production traits in buffalo herds in Iran.
Milk yield and composition
The Holstein Friesian milk yield obtained was lower than the study of Krupova et al. [25] who reported the yield of 7691 kg for Holstein Friesian but higher than the work of Afridi [23] who reported the average yield of Holstein Friesian to be 3771.74 liters and maximum of 3870.34 liters. Other researchers Basu and Cheema [26,27] have reported milk yield of Holstein Friesian cows in tropical and subtropical countries like Romania, India, Pakistan and Chile. The milk yield reported ranges from 3911 to 5229 kg which is within the range of the present study. The results of milk yield of Holstein Friesian cross with White Fulani shown in Table 4 was below the findings of Malau et al. [19] who reported averaged 1,988 ± 108.1 kg for Holstein Friesian cross with White Fulani (Bunaji). The results exceeded the 880 and 837 kg reported for Bunaji at Agege and Vom [28,29] respectively. Buvanendran et al. [21] reported mean milk yield of 1,684 kg in FI FriesianxBunaji cows at Shika while Sohael and Laseinde [29,30] reported average milk yields of 1,692 and 1,329 kg for the same breed at Vom and Agege respectively.
Income, cost and profit (₦/cow/year) associated with milk production in the farms
Farm fresh had the highest income and profit per cow per year and least cost of production closely followed by ASTC farm having the same breed (Holstein Friesian). Nagari Farm Keffi had the least income and profit margin. The trend observed in the study was anticipated because stocking rate, management practice, breed and nutrition will influence cow performance as reported by Afridi [23].
Economic weight (₦/cow/year) of fat, protein and carrier components of milk
Fat had the highest cost of production in all the farms compared to the cost of production of protein. The economic weight of protein was highest in all the farms compared to that for fat. The value obtained in this study agreed with the findings of Bahareh et al. [24] who reported economic weights of milk production traits for Buffalo herds as $0.66, $ 0.80, $ 0.70, $ 0.73 and $ 7.53, $ 20.70, $ 10.34, $ 16.35 and $ 67.52, $ 102.93, $ 61.78, $ 117.85 for milk yield, fat and protein percent, respectively in four cities of Ahwaz, Dezful, Shoshtar and Dahst-Azadegan in South west Iran. The results were similar with the work of Ramon et al. [18] who reported that production of protein was more profitable than any other components of the milk. Cardoso et al. [31] also reported average economic values of (R$) for milk yield, protein yield and fat yield to be 0.51, 6.41 and 1.94, [32-43] respectively in their study of economic values for milk production and quality traits in south and southeast regions of Brazil.
Conclusion
Expenses associated with the production of milk fat were high compared to that required for the production of milk protein. The incomes associated with the sales of milk fat were also lower than that associated with the sales of milk protein. Higher profits were obtained in all the farms from milk protein components than fat and milk carrier. Milk protein therefore had higher economic weight than milk fat and carrier. The differences among economic values for protein, fat and carrier across the farms involved in the present work indicated that, it is possible to use economic weights obtained for protein, fat and carrier production in breeding programs for genetic improvement. The economic weights found for the studied traits indicated that major weight should be given to protein percent in relation to fat and carrier. Protein economic weights were consistently the highest in all the farms while values for carrier were negative in all the farms. Any of the three models can be used in predicting milk yield over time. However, cubic regression model was the best in predicting milk yield of individual lactating cow over time. The results found in the study provide background information on milk production traits that should be considered during selection for optimum breeding objective for Holstein and Holstein Friesian crosses with White Fulani Cow in selected farms in Plateau and Nasarawa States.
Recommendation
The economic values of protein percent had more economic weight than fat and carrier percent. Dairy farmers should give more attention to protein percent in their selection criteria for breeding.
References
- Parna E, Saveli O. Economic value of milk components in cattle breeding. Proc. 3rd BABC. 1997;15-8.
- Parna E, Saveli O. Selection on the major components of milk to maximize profit in dairy herds. Proc. of the 6th World Congress on Genetics Applied to Livestock Production, Australia, Armidale. 1998;25:399-402.
- Parna E, Saveli O. Economic weights for production and functional traits of Estonian Holstein population. Proc of the 7th World Congress on Genetics Applied to Livestock Production, Montpellier, France. 2002;29:323-6.
- Parna E, Meier A. The economic value of the genetic selection of Estonian holstein. Agrarian science. 2001;12(2):100-10.
- Groen Ab.F, Steine T, Colleau JJ, et al. Economic values in dairy cattle breeding, with special reference to functional traits. Report of an EAAP-working group. EAAP Meeting. 1996;50(5):1-21.
- Banga CB, Neser FWC, Vander JW, et al. Economic values for dairy production traits under different milk payment systems in South Africa. South African J Anim Sci. 2009; 39(sup 1): 112-5.
- Dempfle L. Consideration of fertility and udder health in cattle breeding. Züchtungskunde. 1992;64:447-57.
- Fewson D, Niebel E. Consideration of Indirect Characteristics in Breeding Plans for Bovine Cattle. Züchtungskunde. 1986;58: 4-20.
- Gibson JP. Selection on the major components of milk: alternative methods of deriving economic values J Dairy Sci. 1989a;72(12):3176-89.
- Groen AF. Cattle breeding goals and production circumstances. Ph.D. Thesis, Department of Animal Breeding, Wageningen Agricultural University, The Netherlands, 1989; pp: 176.
- Pearson RE, Miller RH. Economic definition of total performance, breeding goals, and breeding values for dairy cattle. J Dairy Sci. 1981;64(5):857- 69.
- Johan AM. Use of profit equations to determine relative economic value of dairy cattle herd life and production from field data. J Dairy Sci. 1991;74(3):1101-7.
- Gibson JP. The effect of pricing systems, economic weights, and population parameters on economic response to selection on milk components. J Dairy Sci. 1989b;72(12):3314-26.
- Colleau JJ, Regaldo D, Gastinel PL. Adaptation of the French Dairy Selection Index (INEL) to the quota context. INRA Prod. Animal. 1994;7:151-67.
- Wilmink JBM. Selection on fat and protein to maximize profit in dairy herds. Livest Prod Sci. 1988;20(4):299-316.
- Ponzoni RW. A profit equation for the definition of the breeding objective of Australian Merino sheep. J Anim Breed Genet. 1986;103(1-5):342-57.
- Goddard ME. Consensus and debate in the definition of breeding objectives. J Dairy Sci. 1998; 81(Suppl. 2): 6-18.
- Ramon M, Legarra A, Ugarte E, et al. Economic weights for major milk constituents of Manchega dairy ewes. J Dairy Sci. 2010;93(7):3303-9.
- Malau-Aduli AEO, Abubaker BY, Ehoche OW, et al. Studies on milk production and growth of Friesian x Bunaji crosses. 1996;9(5):503-8.
- Sada I, Hoffmeisterova R. Evaluation of lactations in Black Pied dairy cows in Nigeria. Tropical and Subtropical Agriculture. 1990;23:95-106.
- Buvanendran V, Olayiwole MB, Piotrowska KI, et al. A comparison of milk production traits in Friesian X White Fulani crossbred cattle. Animal Production. 198;32:165-70.
- Taunk AK, Loharkare SV, Zinjarde RM, et al. A study on the incidence of calving in relation to calving interval and lactation yield in Sahiwal cows. Livestock Adviser. 1990;15:20-4.
- Afridi RJ. Productive performance of Holstein Friesian cattle in North West Frontier Province (NWFP) of Pakistan. 1999.
- Bahareh TD, Ardeshir NJ, Mokhtat AA, et al. Economic Weight of Milk Production Traits for Buffallo Herds in the Southwest Iran using Profit Equation. World Appl Sci J. 2011;15(11):1604-13.
- Krupova Z, Huba J, Dano J, et al. Economic weights of production and functional traits in dairy cattle under a direct subsidy regime. Animal Production Research centre Nitra, Slovak Republic. 2009;54(6):249-59.
- Basu SB, Gupta K. Milk production in relation to age and season in Indian dairy cattle. International dairy congress, National dairy research institute, Karnal, India. Anim Breed Abst. 1974;44:3084.
- Cheema AA. Reproductive performance of Holstein-Friesian cows kept at Quetta, MSc. Thesis Department Animal Reproduction. Faculty of Veterinary Science, University of Agriculture Faisalabad, Pakistan. 1985.
- Dettmers A, Laseinde-Olotu B. Performance of crossbred and purebred cattle in selected Nigerian dairies. Proceedings of the first national seminar on dairy development, Vom, Nigeria.1978;90-103.
- Sohael AS. Milk production potentials of cattle on the Jos Plateau. Nigerian Livestock Farmer.1984;4:13-14.
- Laseinde B. Milk production of various cattle breeds. Ph. D. Thesis. University of Ibadan, Nigeria.1979.
- Cardoso VL, Lima MLP, Nogueira JR, et al. Economic values for milk production and quality traits in south and southeast regions of Brazil. 2014;43(12):636-642.
- Ahmed MI, El-Zubeir IE. Res J Agric Biol Sci. 2007;3:902-906.
- Ayako U. Relationship among milk density, composition and temperature. M.Sc. thesis, University of Guelph. 1999;129.
- Dandare SU, Ezeonwumelu IJ, Abubakar MG. Comparative analysis of nutrient composition of milk from different breeds of cows. Eur J Appl Engin Sci Res. 2014;3:33-6.
- Gibson JP. Economic weights and index selection of milk production traits when multiple production quotas apply. Anim Sci. 1989c;49(2):171-81.
- Goff HD, Hill AR. Chemistry and physics. In: Hui YH editor. "Daky Science and Technology Handbook. Volume Y, Chapter 1. VCH Publishers, Inc., New York. 1993.
- Mirzadeh K, Masoudi A, Chaji M, et al. J Anim Vet Adv. 2010;9(11):1582-3.
- Nickerson SC. Milk production: factors affecting milk composition. In: Milk quality, Aspan, HF editor. 1st Edition, Chapman and Hall, Glasgow, Scotland, UK. 1999; 3-23.
- Pala A, Sahin S. Effects of short period frequent milking on milk yield in two East Friesian crosses: Tahirova and Sonmez sheep. Arch Anim Breeding. 2011; 54(5):515-24.
- Perez CC, Buzlletti, Barria PN, et al. Milk yield characters in Holstein Friesian cows in the metropolitan region of Chile. 1985.
- Smith C, James JW, Brascamp EW. On the derivation of economic weights in livestock improvement. Anim Sci. 1986;43(3):545-51.
- Zeleke ZM. Non-genetic factors affecting milk yield and composition of traditionally managed camel (camelusdromedaries) in Eastern Ethiopia. Livestock Res Rur Dev. 2007;19(6):1-6.
- Groen AF. Economic values in cattle breeding. I. Influence of production circumstances in situation without output limitations. Livestock Prod Sci. 1989; 22(1):1-16.