Research Article - Research and Reports in Gynecology and Obstetrics (2017) Research and Reports in Gynecology and Obstetrics (Special Issue 3-2017)
Computerized diagnosis of fetal heart rate.
Kazuo Maeda*Department of Obstetrics and Gynecology, Tottori University Medical School, Yonago, Japan
- *Corresponding Author:
- Kazuo Maeda
3-125 Nadamachi
Yonago
Tottorikenn
Japan
Tel: 81-859-22-6856
E-mail: maedak@mocha.ocn.ne.jp
Accepted Date: July 31, 2017
Citation: Maeda K. Computerized diagnosis of fetal heart rate. Res Rep Gynaecol Obstet. 2017;1(3):10-15
Abstract
Aims: Objective analysis and evaluation of fetal heart rate (FHR) with continuous, sleepless and restless computer action. Methods: The first step was composed of HP 2100A minicomputer, paper-tape puncher and reader for FHR, Teletype keyboard and printer, author?s own program with BASIC interpreter. The second one was MT140 micro computerized simple FHR data printer for single pregnant woman, then the 4th one was central-computerized time-sharing parallel working computer for multiple deliveries, composed of expert system, artificial neural network computer and FHR frequency spectrum analyzer to diagnose sinusoidal FHR and the loss of variability, with rapid and direct pathologic FHR reporting system to attendant physician. The 2nd to 4th ones were TOITU product. Results: FHR data were analyzed and printed FHR continuously, the 4th one resulted significantly reduced perinatal mortality and the loss of cerebral palsy, confirming the effect of direct reporting system. Conclusion: Computerized FHR monitoring system is not only automatically analyze FHR changes, but also clinically improved perinatal medicine.
Keywords
Fetal heart rate, Computer analysis, Neural network, Frequency spectrum, Centralization, Warning signs, Direct information
Introduction
Fetal monitoring performed by the cardiotocography (CTG) was effective by continuous visual monitoring of obstetric staffs, which was subjective and troublesome, developing inter-observer differences. Maeda created objective FHR score which was objective and possible to be computerized for further improvement. Maeda developed the first mini computerized automated FHR analysis with objective pattern classification [1,2], Dawes analyzed beat-to-beat interval difference which was abnormal if it was less than 4 mS [3-6], while it was claimed because the sauce FHR data was ultrasonic Doppler autocorrelation.
The FHR and ST changes were studied with scalp lead FECG, but needle electrode was canceled by possible mother-fetus viral infection, instead external Doppler autocorrelation FHR was commonly introduced as its variability was similar to direct FECG.
The external technique to study FHR was introduced into the long term FHR variability in computerized diagnosis [1,2]. Also the ultrasound Doppler fetal movement signal made it possible to study fetal actocardiogram (ACG), where even fetal brain function was discussed [7].
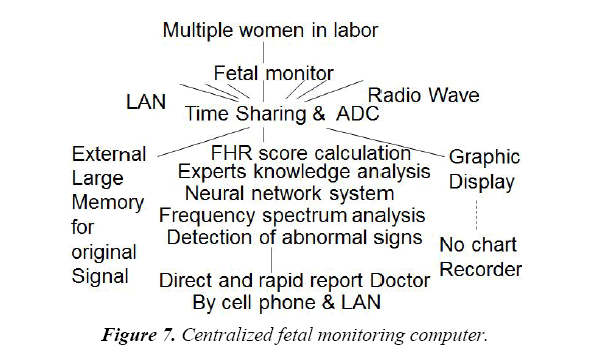
The possibility of computerized fetal monitoring was created in single parturient woman by minicomputer and microcomputer, and then changed central computerized analysis of multiple fetuses using the time-sharing computer system [8].
Pathologic FHR changes detected by computer analysis were primarily informed paper written report, but it was changed to direct report to attending doctor by LAN or telephone mail. The direct report will promote the therapeuic process to cure the asphyxic fetus and then reduce the mortality and brain damages [9].
As the continuous fetal monitoring at bedside was time consuming and subjective, computerized fetal monitoring was introduced by Maeda [1,2,8-12], Dawes [3-6], SisPorto system [13] and many researchers after 1980 [14-17].
Methods
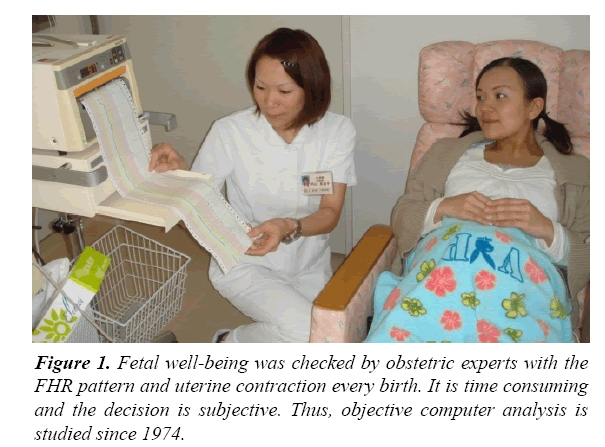
The purpose of FHR monitoring was to prevent fetal death in the past, while it also aims to prevent cerebral palsy caused by fetal brain damage. It was achieved in the early period of FHR monitoring in Japan as shown in Figure 1, while it was disappointing in Dublin RCT by scalp needle electrode FHR monitoring in the electronic fetal monitoring (EFM), as cerebral palsy did not reduce. It may be caused by the purpose of EFM, which was to prevent intrapartum fetal death, while the fetus was not monitored in pregnancy in the EFM. Also there may be mother-fetal viral infection through the needle electrode. They were the reason why external monitoring was mandatory, as has done in Japan, by the FHR recording by fetal heart tone or ultrasonic Doppler autocorrelation method.
Maeda designed and TOITU provided Asia-first fetal monitor with fetal heart tone in 1964, where the FHR was monitored individually by obstetric staffs as in Figure 1, then perinatal mortality and cerebral palsy were reduced. Autocorrelation FHR meter was introduced in 1975, then ultrasonic Doppler fetal actocardigram for the FHR and fetal movement was created by Maeda in 1984 [18].
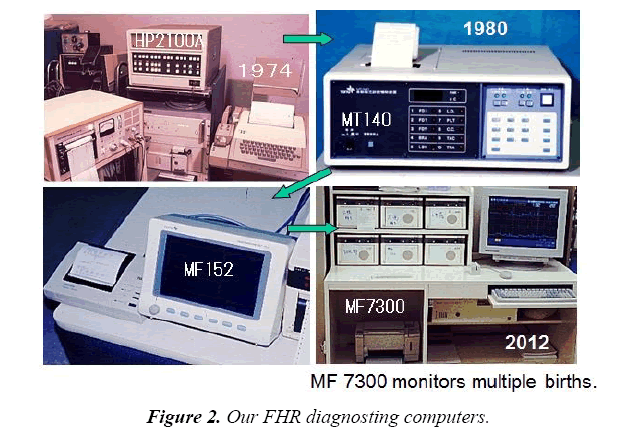
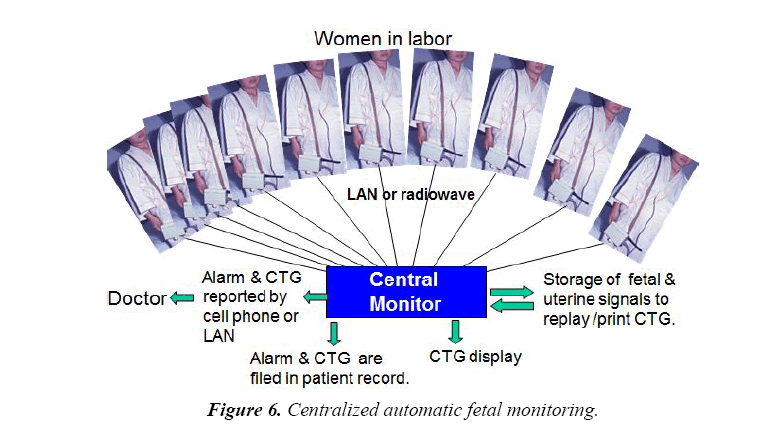
Japanese Education Ministry granted Maeda to develop computerized fetal monitoring with HP 2100A mini-computer, paper tape puncher-reader, and Teletype keyboard/printer 1974, where an expert’s system of FHR analyzer was programmed with HP technical BASIC language for single fetus by Maeda reporting it to MEDINFO 80 [1]. TOITU MT 140 microcomputer system and MF152 system were provided for single fetus, and then MT 7400 central computerized fetal monitoring system was provided (TOITU, Tokyo, Japan) as shown in Figure 2.
Specifications of TOITU MF7400 central computer
It was parallel servers running for the system down (fault tolerance system). Time sharing of 50 channels. It incorporates 1 GB working memory in the RAM module, Dual core Intel Xeon processor E5205 (1.86 GHz), Microsoft Windows server 2003 R2. External 350 GB hard disc drive, hard copy printer, display panels, control desks, telemetry transmitter and receiver, cellular phone, etc. are combined with the computer.
Numeric analysis of FHR patterns
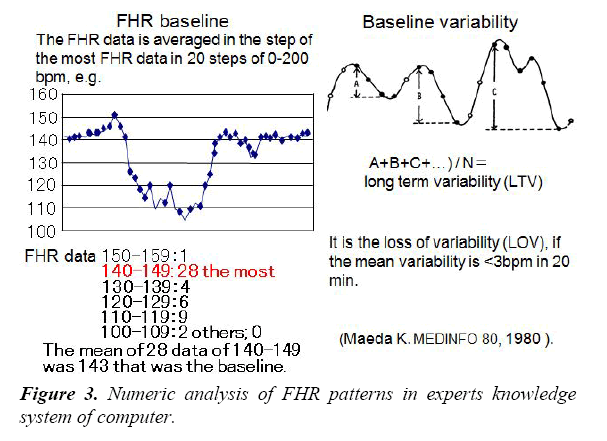
As common FHR patterns were subjective and unable to be analysed by computer, they were numerized in Maedas program, and analysed in 5 min [2].
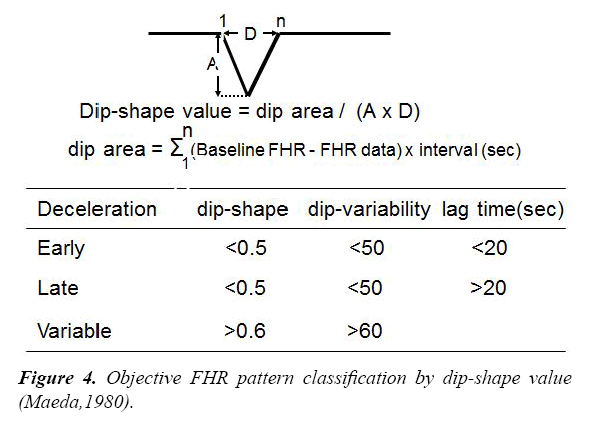
FHR baseline was determined averaging FHRs in the most FHR data step, and long term variability was the sum of sequential FHR increases (Figures 3 and 4).
Numerization of decelerations
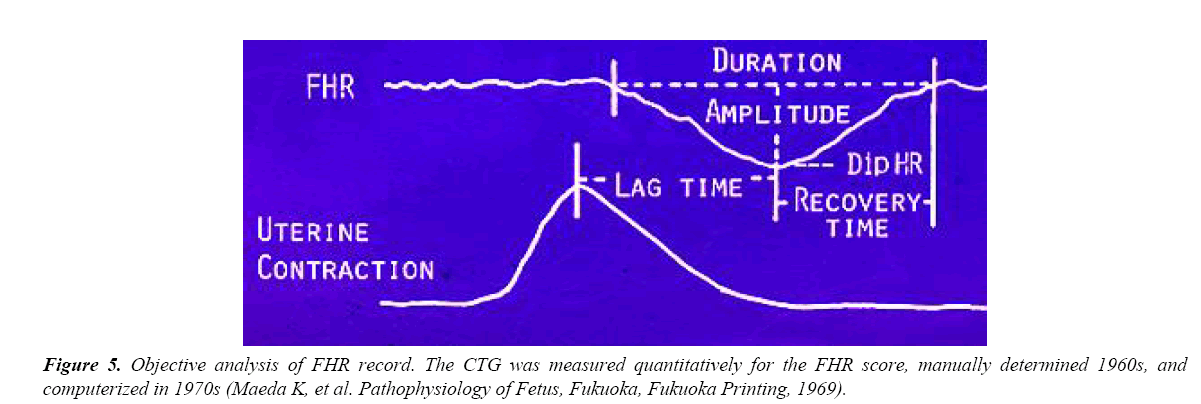
Early deceleration (ED) and late deceleration (LD) was “V” shaped, while variable deceleration (VD) was “U” shaped in visual impression, where the patterns were numerated using “Dip-shape value” as in Figure 4. “Dip shape” was the dip area, which was the sum of FHRs in the dip multiplied by 2 s, divided by the area determined by the product of Amplitude x Duration in Figure 4, where the dip-shape value was less than 0.5 in ED and LD, and larger than 0.6 in VD. The dip variability was larger in VD than ED and LD, thus they were differentiated by computer, Furthermore, The lag time between contraction peak and deceleration dip was larger than 20 sec in LD.
Determination of FHR scores to diagnose fetal outcome
As the FHR pattern was changed to numeric values as shown in Figure 5, which was analyzed by computer, FHR traces were tried to be diagnosed by FHR score (Table 1). Neonatal outcome was damaged by high FHR score as in Table 2.
Table 1. FHR score.
| FHR Signs | 1 min Apgar<7 (%) | Abnormality score |
|---|---|---|
| FHR baseline 110-130bpm or 160-180 bpm | 27.5 | 1 |
| less than 110bpm or more than 180 | 75 | 3 |
| Deceleration Duration more than 60 sec | 71.4 | 3 |
| Nadir FHR less than 100 bpm | 37.1 | 2 |
| Amplitude more than 50 bpm | 50 | 2 |
| Recovery time more than 40 sec | 63.2 | 3 |
| Lag time more than 40 sec | 71.4 | 3 |
| Deceleration of no accompanied acceleration | 44.7 | 2 |
| W-shaped deceleration | 100 | 4 |
FHR score is abnormal when it is 10 or more, and severely abnormal if it is 20 or more. (Maeda K et al. Pathophysiology of Fetus, 1969)
FHR score is 5 min sum of abnormality scores, i.e. it is an index of abnormal FHR. The data were studied in non-interventional labors in 1960s.
Table 2. Apgar score and UApH correlated with FHR score.
| The largest FHR score (X) in the 1st stage of labor correlated 1 min Apgar score (Y) and umbilical arterial blood pH (Z), i.e. |
| Y=9.361-0.335X, R2=0.84, p<0.05 |
| Z=7.31-0.01X, R2=0.85, p=0.024. |
| If FHR score =10, then Apgar=6, mild asphyxia |
| =15, Apgar=4, asphyxia, pH=7.07, acidosis, |
| =20, Apgar=3, severe asphyxia, fetal damage. |
| Early delivery is indicated if FHR score is15 or more. |
| FHR & Apgar scores are calculated in our fetal monitoring computer, and results are directly informed doctor. |
Artificial neural network analysis
The neural network computer software was trained by 8 FHR parameters and their outcomes. The 8 FHR parameters were; 1) Baseline FHR, 2) Variability amplitude, 3) Pathological sinusoidal FHR, 4) Number of decelerations, 5) Duration, 6) Amplitude, 7) Lag time, 8) Recovery time to baseline. Neural computer was trained for 10,000 times by 8 FHR data and outcomes to prepare trained neural network, which outputs correct outcome [9] (Table 3).
Table 3. Artificial NeuralNetwork Computer.
| Probabilities to be pathologic, normal and intermediate outcome are reported, after training with 25 sets of 8 FHR parameters in known outcome cases. |
| FHR data of new cases were input into trained neural network to compare the 3 probabilities and FHR score, where the results coincided to FHR score. |
| Thus, the neural network is installed in central FHR diagnosis system to reconfirm FHR score. |
FFT frequency spectrum of FHR baseline
La was the area under the power spectrum in 0.031-0.1 Hz.
Ta was the area under the whole power spectrum.
PPSD was the peak power spectrum density [11,12].
Results and Discussion
Troublesome visual analysis of cardiotocogram was discarded
Obstetric staff had to diagnose FHR record sitting bedside in the labor for more than 10 hours in the visual FHR diagnosis in the past. The heavy work was discarded when computer was introduced in FHR monitoring, improving other clinical works to make outcome of patients better at delivery.
Any error caused by subjective misreading of FHR trace did not occur in objective computerized FHR diagnosis, because new technique does not use FHR pattern classification.
Simplification of analyzing technique utilized by computer made the FHR diagnosis more simple and fast than the past visual analysis of FHR curve.
Fetal outcome was predicted by the FHR score, hypoxia index, A/B ratio and frequency spectrum in the computer analysis.
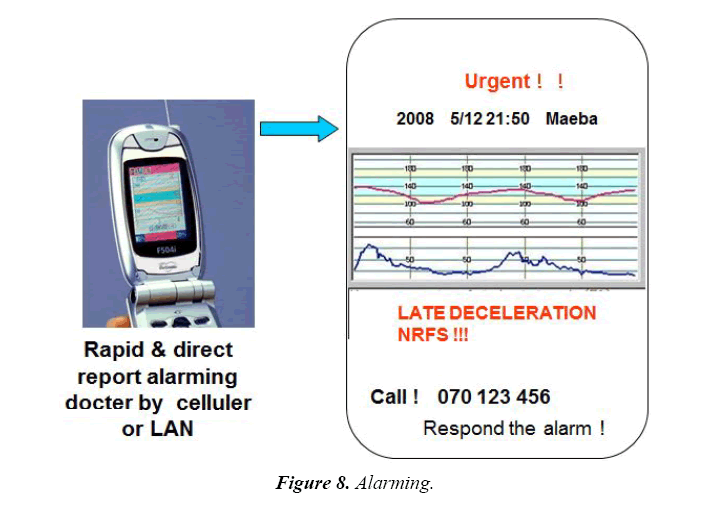
Apgar score, umbilical arterial pH and Base Excess closely correlated to the maximal FHR score in the 1st stage of labor (Table 2), i.e., fetal outcome was predicted by the FHR score in the 1st stage of labor determined by the computer promoting the prompt treatment immediately after the detection of high FHR score reported by the computer, which significantly improve fetal outcome as shown in Figures 6-8 [10].
The 3 outcome probabilities were obtained by the analysis of new 8 FHR data by trained neural network computer [9]
1. Probability (%) to be normal neonate
2. Probability (%) to be suspicious outcome
3. Probability (%) to be pathological outcome
The 3 neural network probabilities were coincided with the FHR scores obtained in the same fetuses [9].
Frequency spectrum of FHR diagnosed fetal severe changes
Pathologic sinusoidal FHR, which was severe fetal anemia close to fetal death, was diagnosed by the FHR frequency spectrum analysis of FHR, when the La/Ta ratio was 30% or more and at the same time PPSD was 300 bpm2/Hz or more.
In addition, the loss of FHR baseline variability was diagnosed when La/Ta ratio was less than 15%, and at the same time, the PPSD was less than 60 bpm2/Hz [11,12] (Table 4).
Table 4. Frequency spectrum of FHR baseline.
| 1.Diagnosis of pathologic sinusoidal FHR |
| Although Actocardiogram separated physiologic sinusoidal FHR from pathologic one using fetal movement, It was pathologic one, if La/Ta ratio was larger than 39%, and also the peak power spectrum density (PPSD) was larger than 300 bpm2/Hz, while the values were smaller than the levels in physiologic sinusoidal FHR. |
| 2. Diagnosis of the loss of FHR variability |
| The loss of variability is decided if its amplitude is<1 bpm. Also it is the loss of variability, if the La/Ta <15% and PPSD<60 bpm2/Hz in the frequency spectrum, thus, the software was installed in our central computer system, |
Direct and rapid FHR changes alarming attendant doctors
Alarming reports, which was directly and rapidly sent to doctors from computer by cellular phone (Figure 8), LAN etc., are as follows promoting prompt therapy;
Apgar score was instantly calculated from FHR score using regression equation (Table 2) [10].
Acute bradycardia and its duration results high hypoxia index which is the duration of bradycardia (min) × 100 divided by FHR nadir (bpm) were instantly calculated and reported the doctor to promote suitable treatment.
Loss of variability, reduced variability and loss of acceleration are signs of fetal brain damage, which are reported to the doctor.
A/B ratio <1.0, where A is the duration of FHR acceleration and B is the duration of fetal movement burst, and lower than 1.0 A/B ratio predicts low Apgar score lower than 7, is reported to the doctor.
NRFS (fetal distress) is also reported to the doctor.
Technical error: large noise or probe detachment is announced to the doctor [8] (Tables 5 and 6).
Table 5. Direct and rapid report of abnormal FHR alarms doctor to promote fetal treatment.
| The alarms are: |
|---|
| Bradycardia<110 bpm #, tachycardia>180 bpm |
| Reduced variability <5 bpm #, |
| The loss of acceleration # |
| Shorter acceleration than fetal movement burst duration |
| Severe variable decelerations # |
| Late decelerations# |
| Frequently repeated decelerations # |
| Prolonged deceleration>2 min # |
| FHR score >10 # |
| Hypoxia index |
| Pathologic sinusoidal FHR # |
| Neural network pathologic outcome probability >30 % |
| Dropped probe #: NRFS |
Table 6. Effect of computerized monitoring with rapid and direct reporting system.
| Perinatal mortality significantly reduced and there was no cerebral palsy in the update computer. The results were better than the centralized monitoring computer without direct reporting system ( Utsu M, Mikatahara hospital, 2012) |
Clinical improvements
FHR monitoring was highly improved to reduce perinatal mortality, which significantly reduced and also cerebral palsy was zero in computerized monitoring associated with rapid and direct warning system, when compared to previous compared system [8].
Conclusion
Central computerized FHR monitoring with direct and rapid warning system is recommendable to significantly improve fetal outcome.
Acknowledgments
Japanese Educational Ministry granted Maeda HP minicomputer 1974. Sincere gratitude to the co-working of Prof, Noguchi Y, National Defence Academy, Mr. Nagasawa T., TOITU Ltd, and researchers in Department of Obstetrics and Gynecology, Tottori University Medical School.
Disclosure
Japan Educational Ministry Grant 1974.
References
- Maeda K, Arima T, Tatsumura M, et al. Computer-aided fetal heart rate analysis and automatic fetal-distress diagnosis during labor and pregnancy utilizing external technique in fetal monitoring. In: Lindberg, Kaihara (eds). North-Holland Publishing Company. 1980;1214-8.
- Maeda K. Computerized automatic diagnosis of fetal distress with use of external monitoring technique. Computer diagnostics in maternal medicine, symposium. Scientific contributions of Friedrich Schiller Universitaet Jena. 1981;28-49.
- Dawes GS, Redman CW. Automated analysis of the FHR: evaluation? Am J Obstet Gynecol. 1992;167(6):1912-4.
- Patinson R, Dawes G, Jennings J, et al. Umbilical artery resistance index as a screening test for fetal well-being, Prospective revealed evaluation. Obstet Gynecol. 1991;78(3):353-8.
- Pello LC, Dawes GS, Smith J, et al. Screening of the fetal heart rate in early labour. Br J Obstet Gynaecol. 1988;95(11):1128-36.
- Henson G, Dawes GS, Redman CW. Chracterization of the reduced heart rate variation in growth retarded fetuses. Br J Obstet Gynaecol. 1984;91(8):751-5.
- Maeda K. Modalities of fetal evaluation to detect fetal compromise prior to the development of significant neurological damage. J Obstet Gynaecol Res. 2014;40(10): 2089-94.
- Maeda K, Utsu M, Noguchi Y, et al. Central computerized automatic fetal heart rate diagnosis with a rapid and direct alarm system. The Open Med Dev J. 2012;4(1):28-33.
- Maeda K, Utsu M, Makio A, et al. Neural network computer analysis of fetal heart rate. J Matern Fetal Investig. 1998;8:163-71.
- Maeda K, Noguchi Y, Matsumoto F, et al. Quantitative fetal heart rate evaluation without pattern classification: FHR score and artificial neural network analysis. In: Kurjak, Chervenak (eds). Textboook of Perinatal Medicine. Informa, London. 2006;1487-95.
- Maeda K, Nagasawa T. Automatic computerized diagnosis of fetal sinusoidal heart rate. Fetal Diag Ther. 2005;20(5):328-34.
- Maeda K, Nagasawa T. Loss of FHR variability diagnosed by frequency analysis. J Perinat Med. 2010;38(2):197-201.
- Ayres-de Campos D, Bernardes J, Garrido A, et al. SisPorto 2.0: A program for automated analysis of cardiotoctocograms. J Matern Fetal Med. 2000;9(5):311-8.
- Roemer VMN, Walden R. Fetal heart rate patterns during delivry complicated by hypoxia and acidosis-a computer-aided analysis. Z Geburtshilfe Neonatol. 2013;217(1):28-34.
- Amoim-Costa C, Costa Santos C, Ayres-de-Campos D, et al. Longitudinal evaluation of computerized cardiotocographc parameters throughout pregnancy in normal fetuses: A prospective cohort study. Acta Obstet Gynecol Scand. 2016;95(10):1143-1152.
- Romano M, Bifulco P, Ruffo M, et al. Software for computerized analysis of cardiotocographic traces. Comput Methods Programs Biomed. 2016;124;121-137.
- Doret M, Spika J, Chudacek, et al. Fractal analysis and hurst parameter for intrapartum fetal heart rate variability analysis: A versatile alternative to frequency bands and LF/HF ratio. PLoS One. 2015;10(8):e0136661.
- Maeda K. Invention of ultrasonic Doppler fetal actocardiograph and continuous recording of fetal movements. JOGR. 2016;42(1)5-10.
