Research Article - Biomedical Research (2018) Volume 29, Issue 10
Computerized colony classification of induced pluripotent stem cells using Gaussian naive Bayes model on phase contrast images
Muthu Subash Kavitha and Byeong-Cheol Ahn*
Department of Nuclear Medicine, School of Medicine, Kyungpook National University, Daegu, Korea
- *Corresponding Author:
- Byeong-Cheol Ahn
Department of Nuclear Medicine
School of Medicine
Kyungpook National University Hospital, Korea
E-mail: abc2000@knu.ac.kr
Accepted on April 06, 2018
DOI: 10.4066/biomedicalresearch.29-17-2725
Visit for more related articles at Biomedical ResearchAbstract
This study aims to develop a computerized software tool that automatically separates the colony contour region of induced pluripotent stem cells (iPSCs) and classifies the health conditions of the colonies using the Gaussian naïve Bayes (GNB) model. The occluded colony regions were automatically segmented based on the phase contrast images using image processing techniques to obtain quantitative morphological features for classification. The sequential forward selection method was utilized to extract optimized features for the identification of colony conditions. The GNB model was adapted to validate the individual colony features and their combinations using a five-fold cross validation method for classification. Furthermore, the classification performance of GNB was compared with that of the knearest neighbor (k-NN) method. The classification performance of the combination of features using the GNB approach presented the highest sensitivity (91.4%), specificity (88.2%), and accuracy (90.8%) for the classification of the colonies of iPSCs. Furthermore, compared with the k-NN classifier (14.3%), GNB showed lower misclassification rate (9.2%) in classification. Based on experimental results, we concluded that the proposed automated colony region segmentation and classification based on the combination of features using GNB model is precise and cost-effective for the classification of health conditions of iPSC colonies.
Keywords
Induced pluripotent stem cells, Colony contour, Classification, Morphology, Gaussian naïve Bayes.
Introduction
Induced pluripotent stem cells (iPSCs) are pluripotent stem cells generated from adult cells by reprogramming [1]. It is important to analyze the quality of iPSCs for further experiments such as drug development, tissue engineering, and transplantation in medicine. Hence, the estimation of the status of iPSCs using an automated software technique is very useful for their quality assessment, which is essential for the biological experimental or clinical applications [2]. The conventional methods of subjective analysis of colony conditions suffered from the drawbacks of excessive time consumption and classification errors. Therefore, automatic classification tools are necessary to reduce the workload and increase the classification efficiency and reliability. The automatic segmentation of colony contours based on phase contrast images is difficult owing to image artifacts and occluded colonies. Several non-invasive conventional approaches identified iPSCs based on the local feature measurements of an object using machine learning algorithms [3,4]. However, the morphological parameters of a colony are considered to be one of the most important criteria to continuously evaluate the health conditions of an iPSC colony [5]. Healthy stem cells are observed to be compact and round cells, whereas unhealthy stem cells appear different. Furthermore, it is highly feasible to construct an efficient computer model for analyzing the colony qualities based on the quantitative morphological features obtained from the representative iPSC colony images specified by experts [6]. The classification of iPSCs based on intensity histogram feature sets using a support vector machine exhibited low performance accuracy in the selection of colonies. Hence, separating an iPSC colony contour automatically and subsequently classifying colonies could improve the classification accuracy [7]. The purpose of this study was to develop a computerized software tool that segments an iPSC colony contour based on phase contrast microscopy images and classifies the health conditions of the colony using a less complex Gaussian naïve Bayes (GNB) model. The quantitative morphological features extracted from healthy and unhealthy iPSC colonies were used to determine the conditions of the colonies. Furthermore, the competitive performance of the GNB was compared to that of the k-nearest neighbor (k-NN) classifier based on individual features and their combinations using a five-fold cross validation.
Materials and Methods
Dataset
The proposed study was tested with 46 iPSCs, which comprised 20 healthy and 26 unhealthy colony images. All the images were prepared under the 100X objective of a phase contrast microscope (Leica DM IL LED) with a resolution of 2048 × 1536 pixels. The iPSCs were purchased from American Type Culture Collection (ATCC) and cultured on gelatincoated tissue culture dishes (100 mm in size) seeded with inactive murine embryonic fibroblast feeder cells. TrypLETM (ThermoFisher) was added for the passing of iPSCs, and iPSC colonies were gently detached from the culture dishes by tapping. The harvested iPSCs were seeded on new dishes with 5 × 10⁴ cells each. The iPSCs analyzed in this study were not stained or genetically modified.
Quantitative measurements of iPSC colony features
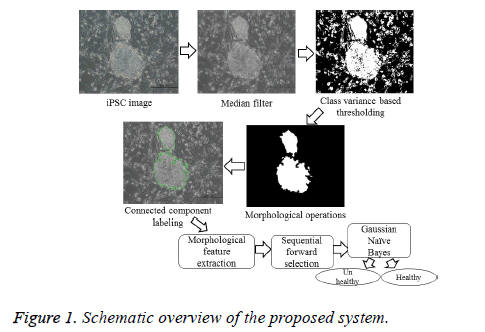
The various steps included in the determination of the health conditions of an iPSC colony are illustrated in the schematic overview as shown in Figure 1. The image quality was improved via non-linear median filtering of pixel size 9 × 9. Segmentation was carried out based on the criterion functions equivalent to the class variance proposed by [8], which is suitable for the images with regions of equal or unequal variances. It computes the optimal threshold that maximizes the likelihood of the conditional distribution of a population mixture model consisting of two normal distributions with different means and a common variance, represented by

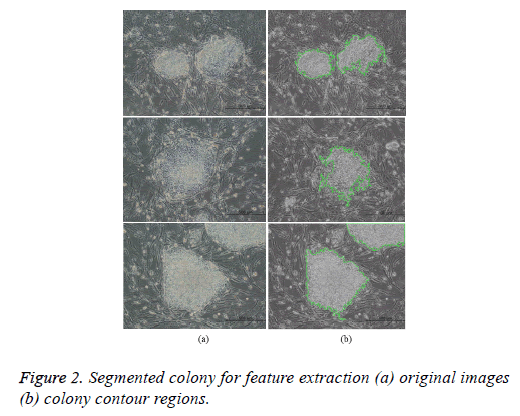
where t is the optimal threshold, v is the variance, and pjis the probability of the jth class. The segmented image is subsequently subjected to morphological closing, erosion, hole filling, and size filtering operations. Finally, region labeling was employed to derive the quantitative morphological features of the colony contour regions for estimating the colony quality (Figure 2). The labeling algorithm processes the pixels from top to bottom and left to right in order to recognize the connected pixel regions. It assigns labels to each pixel until the label of a pixel no longer changes. After labeling is completed, it is easy to derive the quantitative morphological features of the colony regions. In this study, we have estimated 11 morphological features: area, perimeter, eccentricity, Euler number, solidity, extent, compactness, mean intensity, equivalent diameter, and major and minor axis lengths.
Sequential forward selection for optimized colony features
In this study, we have utilized the sequential forward selection technique (SFS) to evaluate the optimized features for high classification performance [9]. In order to achieve a maximum criterion function, a subset of f features is defined by iteratively adding one feature at a time to an empty set. The maximum criterion function is satisfied if the feature exhibits the best classifier performance when it is added to the feature set. In each iteration, the feature to be added to the feature set is selected among the remaining features that have not been included in the feature set. Hence, the newly generated feature set yields lower classification error than the inclusion of any other feature. Subsequently, a subset of f features is created until the termination criterion is satisfied. It is defined as

Gaussian naïve Bayes classification
The GNB classifier has been demonstrated to be one of the most effective and useful supervised machine learning algorithms for classification tasks in medical image analysis [10,11]. In comparison with other machine learning methods, the GNB classifier has the advantages of learning interior relationships by including the prior knowledge using probabilistic theory [12,13]. Moreover, the GNB classifier works well even with a very small amount of training data. It constructs a function to be optimized under a “naïve” assumption that all the parameters in a dataset are independent. Hence, it considers that the presence of a characteristic explaining a certain class is independent of the presence of any other characteristic. However, the GNB classifier assumes the likelihood of the features to be Gaussian as follows:

where mi a dependent feature, n is a class variable, and the parameters σn and μn are calculated using maximum likelihood. The GNB classifier estimates the probability distribution of iPSC colony images conditioned on the quality of the colony.
Statistical analysis
The optimized features of the colonies were used both individually and as combinations of features in the GNB model with k-fold cross validation to train and test the classifiers. The performance measures applied in this study were sensitivity, specificity, and accuracy. The sensitivity measure can differentiate the unhealthy colonies correctly. It can be stated as

where TP is true positive and FN is false negative. The specificity measure can estimate the healthy colonies correctly. It is defined as

where TN is true negative and FP is false positive. The accuracy measure can differentiate between the healthy and unhealthy colonies correctly. Mathematically, it can be stated as

The classification performance of the GNB approach is compared with that of the k-NN classifier method [14]. In k- NN, Euclidean distance measures were computed between the test features and all the training features with k nearest neighbors (k=3). In the k-fold cross-validation method, the data set was randomly separated into k equal subsets. Subsequently, k-1 subsets were used as training sets, and the other subsets were used as test sets. This experiment was continued for all the different choices of k subsets, and the sum average of the accuracy was evaluated. The application of GNB and k-NN classifier models for the classification of iPSC colonies was implemented using Scikit-learn toolkit in Python [15].
Results and Discussion
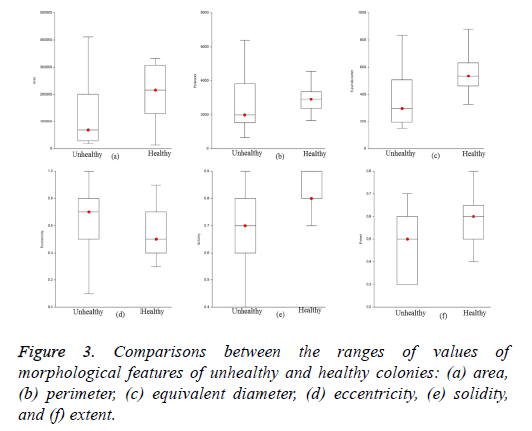
The optimized morphological features of the iPSC colony evaluated using the SFS method were area, perimeter, equivalent diameter, eccentricity, solidity, and extent based on the maximum criterion value. The ranges of values of the estimated optimized features for healthy and unhealthy colonies are visualized in Figure 3. The ranges of values of area, perimeter, equivalent diameter, solidity, and extent of healthy colonies were higher than those of unhealthy colonies. However, the ranges of values of eccentricity of healthy colonies were low compared to those of unhealthy colonies. The optimized features of the colonies were evaluated using GNB and k- NN with five-fold cross validation to train and test the classifiers. We used 28 training and 18 testing datasets for the evaluation of classifiers adopted in this study.
The classification performance of the machine learning classifiers based on individual morphological features and their combinations using five-fold cross validation were used in this study and presented in Tables 1-3. The feature “area” exhibited the highest performance accuracy in classifying colonies among the individual features in both GNB and k-NN (Table 1). The feature “solidity” exhibited the highest performance accuracy with GNB but exhibited lower classification performance with k-NN for classifying colonies. The other remaining individual features evaluated using the two classifiers yielded moderate or low classification performances.
| Features | Sensitivity (%) | Specificity (%) | Accuracy (%) |
|---|---|---|---|
| Naïve Bayes classifier | |||
| Area | 85.7 | 72.2 | 80.4 |
| Perimeter | 71.4 | 61.1 | 67.4 |
| Equivalent Diameter | 78.6 | 72.2 | 76.1 |
| Eccentricity | 75.0 | 61.1 | 69.6 |
| Solidity | 82.1 | 77.8 | 80.4 |
| Extent | 75.0 | 66.7 | 71.7 |
| k-NN classifier | |||
| Area | 89.3 | 71.7 | 82.6 |
| Perimeter | 67.9 | 61.1 | 65.2 |
| Equivalent Diameter | 71.4 | 66.7 | 69.6 |
| Eccentricity | 64.3 | 55.6 | 60.8 |
| Solidity | 71.4 | 66.6 | 69.6 |
| Extent | 78.6 | 61.1 | 69.3 |
Table 1. Results of Gaussian naïve Bayes and k-nearest neighbor classifiers for the classification of the colonies of iPSCs based on individual morphological features using a five-fold cross validation method.
| Fold | Sensitivity (%) | Specificity (%) | Accuracy (%) | Error rate (%) |
|---|---|---|---|---|
| Fold1 | 90.5 | 85.7 | 89.4 | 10.6 |
| Fold 2 | 90.0 | 89.6 | 90.2 | 9.8 |
| Fold 3 | 92.9 | 90.0 | 92.3 | 7.7 |
| Fold 4 | 92.8 | 86.4 | 90.0 | 10.0 |
| Fold 5 | 90.8 | 89.5 | 92.1 | 7.9 |
Table 2. Results of Gaussian naïve Bayes classifier for the classification of the colonies of iPSCs based on the combination of morphological features using a five-fold cross validation method.
| Fold | Sensitivity (%) | Specificity (%) | Accuracy (%) | Error rate (%) |
|---|---|---|---|---|
| Fold1 | 90.5 | 87.7 | 90.1 | 9.9 |
| Fold 2 | 87.2 | 80.0 | 84.1 | 15.9 |
| Fold 3 | 89.9 | 84.5 | 87.0 | 13.0 |
| Fold 4 | 84.8 | 79.4 | 82.7 | 17.3 |
| Fold 5 | 85.9 | 82.5 | 84.5 | 15.5 |
Table 3. Results of k-nearest neighbor classifier for the classification of the colonies of iPSCs based on the combination of morphological features using a five-fold cross validation method.
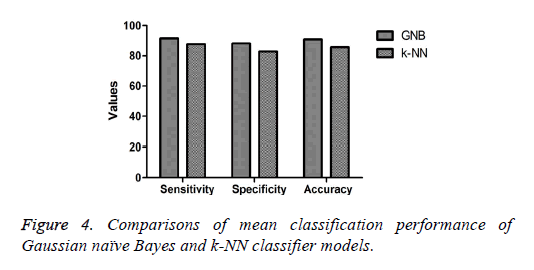
The mean or average classification performance of the GNB classifier in classifying the colonies of iPSCs exhibited the highest sensitivity (91.4%), specificity (88.2%), and accuracy (90.8%) using the combination of features (Table 2). Furthermore, the average misclassification rate or error rate estimated for the GNB approach for classifying the colonies was 9.2%. The average sensitivity, specificity, and accuracy of the k-NN classifier in classifying the colonies of iPSCs based on the combination of features were 87.7%, 82.8%, and 85.7%, respectively (Table 3). The performance measures of the GNB approach were higher compared with those of the k-NN method for classifying the colonies of iPSCs as shown in Figure 4. Furthermore, the average misclassification rate or error rate evaluated for the k-NN classifier (14.3%) was much higher than that of the GNB approach for classifying the colonies of iPSCs.
We developed a computerized software tool that automatically identifies the colony contour regions of iPSCs and extracts the morphological features quantitatively. The use of the GNB approach in classifying the morphological features of the colony conditions delivered acceptable results with a high degree of consistency and reproducibility. One of the major benefits of this computerized system over a manual evaluation is the objectivity of the automated estimation. The proposed system automatically separates the occluded colony regions in the phase contrast images of iPSCs by measuring the morphological features of the colony conditions, which can minimize the computation errors of the conventional evaluation [4,16]. Furthermore, it is crucial to consider the model complexity in a computerized software tool. Hence, the proposed system, which uses a less complex GNB classifier model and its uncertainty estimation based on the probabilities of the outcomes, achieves robust differential classification of iPSC colonies with a higher accuracy (90.8%) than the k-NN classifier approach.
Furthermore, the GNB model can be quickly adapted for the classification of new test samples while k-NN required tuning every time for the classification of new test samples. The competitive performance of GNB as compared to that of the k- NN was also demonstrated in another study that classified living embryonic stem cells based on imaging techniques using machine learning approaches [11]. Furthermore, it was also reported that the combination of features was more accurate than a single feature, which is in accordance with the results of this study for classifying the colony categories of iPSCs [11]. The differentiation of a human iPSC colony reported in the previous study based on various machine learning techniques revealed a low classification performance of slightly more than 63%, which is much lower than that achieved in our study using imaging techniques and GNB for obtaining automated colony contour regions for the classification of categories of colonies [7]. Furthermore, the lower error rate obtained using the GNB approach showed the reliability of the proposed model for classifying the health conditions of colonies.
The limitations of this study are a small number of samples and the limited number of morphological features for the classification of colonies. Further studies with larger number of samples with various features extracted from colony contour regions should be included to validate the proposed model and achieve improved performance. The classification performances achieved with the combination of morphological features by the application of GNB in this study revealed that our proposed computerized software tool is accurate and efficient for classifying the colony categories of iPSCs. Compared with the k-NN classifier method, GNB demonstrated lower misclassification rate, and thus, it could be a more reliable method for the detection of iPSC colonies. Hence, the proposed identification system of automated colony health conditions can be useful to clinicians and it can significantly reduce the classification error owing to subjective measurement.
Acknowledgement
This research was supported by a grant from the Korea Health Technology R&D Project through the Korea Health Industry Development Institute (KHIDI), funded by the Ministry of Health & Welfare, Republic of Korea (grant number: HI15C0001).
References
- Takahashi K, Tanabe K, Ohnuki M, Narita M, Ichisaka T, Tomoda K, Yamanaka S. Induction of pluripotent stem cells from adult human fibroblasts by defined factors. Cell 2007; 131: 861-872.
- Paull D, Sevilla A, Zhou H, Hahn AK, Kim H, Napolitano C, Tsankov A, Shang L, Krumholz K, Jagadeesan P, Woodard CM, Sun B, Vilboux T, Zimmer M, Forero E, Moroziewicz DN, Martinez H, Malicdan MC, Weiss KA, Vensand LB, Dusenberry CR, Polus H, Sy KT, Kahler DJ, Gahl WA, Solomon SL, Chang S, Meissner A, Eggan K, Noggle SA. Automated, high-throughput derivation, characterization and differentiation of induced pluripotent stem cells. Nat Methods 2015; 12: 885-892.
- Nagasaka R, Matsumoto M, Okada M, Sasaki H, Kanie K, Kii H, Uozumi T, Kiyota Y, Honda H, Kato R. Visualization of morphological categories of colonies for monitoring of effect on induced pluripotent stem cell culture status. Regen Therapy 2017; 6: 41-51.
- Joutsijoki H, Haponen M, Rasku J, Aalto-Setälä K, Juhola M. Machine learning approach to automated quality identification of human induced pluripotent stem cell colony images. Comput Math Methods Med 2016; 1-15.
- Casalino L, D'Ambra P, Guarracino MR, Irpino A, Maddalena L, Maiorano F, Minchiotti G, Patriarca EJ. Image analysis and classification for high-throughput screening of embryonic stem cells. In: Zazzu V, Ferraro MB, Guarracino MR, editors. Mathematical Models in Biology. Switzerland; Springer 2015; 17-31.
- Kato R, Matsumoto M, Sasaki H, Joto R, Okada M, Ikeda Y, Kanie K, Suga M, Kinehara M, Yanagihara K, Liu Y, Yamada KU, Fukuda T, Kii H, Uozumi T, Honda H, Kiyota Y, Furue MK. Parametric analysis of colony morphology of non-labelled live human pluripotent stem cells for cell quality control. Sci Rep 2016; 6: 1-12.
- Joutsijoki H, Haponen M, Rasku J, Aalto-Setälä K, Juhola M. Error-correcting output codes in classification of human induced pluripotent stem cell colony images. BioMed Res Int 2016; 1-13.
- Kurita T, Otsu N, Abdelmalek N. Maximum likelihood thresholding based on population mixture models. Pattern Recogn 1992; 25: 1231-1240.
- Peng Y, Wu Z, Jiang J. A novel feature selection approach for biomedical data classification. J Biomed Inform 2010; 43: 15-23.
- Maier O, Schröder C, Forkert ND, Martinetz T, Handels H. Classifiers for ischemic stroke lesion segmentation: A comparison study. PLoS One 2015; 10: 1-16.
- Zahedi A, On V, Lin SC, Bays BC, Omaiye E, Bhanu B, Talbot P. Evaluating cell processes, quality, and biomarkers in pluripotent stem cells using video bioinformatics. PLoS ONE 2016; 11: 1-22.
- Zhang H. The optimality of naïve Bayes. In: Proceedings of the seventeenth International Florida Artificial Intelligence Research Society Conference 2004; 1: 562-567.
- Rish I. An empirical study of the naïve Bayes classifier. In IJCAI: Workshop on empirical methods in artificial intelligence 2001; 3: 41-46.
- Cover TM, Hart PE. Nearest neighbor pattern classification. IEEE Transact Info Theory 1967; 13: 21-27.
- Pedregosa F, Varoquaux G, Gramfort A, Michel V, Thirion B, Grisel O, Blondel M, Prettenhofer P, Weiss R, Dubourg V, Vanderplas J, Passos A, Cournapeau D, Brucher M, Perrot M, Duchesnay É. Scikit-learn: machine learning in Python. J Mach Learn Res 2011; 12: 2825-2830.
- Masuda A, Raytchev B, Kurita T, Imamura T, Suzuki M, Tamaki T, Kaneda K. Automatic detection of good/bad colonies of iPS cells using local features. International workshop on machine learning in medical imaging 2015; 9352: 153-160.


