Research Article - Biomedical Research (2017) Volume 28, Issue 6
Computer-aided diagnosis system for mammogram density measure and classification
Nithya R* and Santhi B
School of Computing, SASTRA University, Thanjavur, Tamil Nadu, India
Accepted date: October 24, 2016
Abstract
This paper presents a computer-aided diagnosis (CAD) system for breast density classification in digital mammogram images. Mammographic density is considered as a strong indicator for developing breast cancer. This proposed method consists of four steps: (i) breast region is segmented from the mammogram images by removing the background and pectoral muscle (ii) segmentation of fatty and dense tissue (iii) percentage of the fatty and dense tissue area is calculated (iv) Classification of breast density. Results of the proposed method evaluated on the Mammographic Image Analysis Society (MIAS) database. The experimental results show that the proposed CAD system can well characterize the breast tissue types in mammogram images
Keywords
Mammogram, Preprocessing, Density classification, Computer aided diagnosis.
Introduction
The most successful imaging method for breast cancer detection is digital mammography. Mammography is a primary screening methodology for early breast cancer detection and other abnormalities [1]. Because of the subjective measure of visual analysis, diagnosis result may differ from radiologist to radiologist. Therefore, a computer-aided system is necessary for mammogram analysis. The interpretation of the mammogram is depends on the density of the breast tissue. One of the major difficulties in detection of breast cancer in the mammogram is that the high-density breast tissue. The common factors that hide the detection of breast lesions by the radiologist are the dense breast tissue. The dense tissue appears as a bright region in the mammogram, whereas fatty tissue appears as a dark region in the mammogram. In mammography images, cancerous tissue appears as a bright region. It is more difficult for the physicians to detect lesions in dense tissue due to both dense tissue and lesions appear as a bright region in the mammogram [2]. It is very important to estimate the dense breast tissue to assess the risk factors. Both visual assessments by radiologists and computerized methods have been used to classify mammographic breast density patterns.
The X-ray mammography is the effective method to evaluate the breast density. Mammography has major difficulties due to dense breast tissue, which obscures the suspicious lesion. Mammogram density is a very important factor for breast cancer diagnosis and it may lead to false negative results in breast cancer detection. Breast cancer detection can be very complex when the suspicious region is invisible because of dense breast tissue. The presence of extreme dense tissue may obscure suspicious lesions. It is difficult to diagnose breast cancer on mammograms because of the dense tissue is involved [3]. Therefore, computer-aided diagnosis system is important to assist radiologists in carrying out a more accurate diagnosis. A quantitative measure of dense tissue region is important to the estimation of breast cancer risk. The measurement of breast density is very important for detecting breast cancer. It is difficult to distinguish between normal, dense and cancerous tissue when the tumor is surrounded by glandular tissues.
Breast density is an essential factor in the mammogram interpretation. Breast Imaging Reporting and Data System (BIRADS) describe the four categories for classifying breast density: (1) fat (2) fibro-glandular tissue (3) extremely dense and (4) heterogeneously dense. Generally, density classes (1) and (2) are classified as low-density classes whereas density classes (3) and (4) are high-density classes [4]. BI-RADS was defined by the American College of Radiology (ACR) for mammogram screening. Visually, fatty, glandular and dense tissues differ through gray level intensities. The pectoral muscle region represents a predominant high density that could interfere the analysis of mammograms. The pectoral muscle removal in mammograms is the important preprocessing step. Its presence within a mammogram can affect the detection of breast cancer. The main obstacle in computer assisted mammogram analysis is the appearance of the pectoral muscle. The pectoral muscle region is similar to the dense region. It is important to remove the pectoral muscle for suspicious lesion identification. In mammography, breast density is calculated as percent density (PD), the percentage of the breast area appears as dense tissue. Measurement of breast density can be done using two methods: subjective and objective. Subjective measurement is the visual assessment of mammographic density patterns by the expert radiologists. A computerized automated method has been used to objective measurement of mammographic density patterns [4]. Several studies have shown that mammographic density classification is useful for breast cancer risk prediction. An important factor for the less sensitivity of mammography is increased breast density.
In this work, a novel approach to automatic breast density classification is proposed. The first step of the proposed method is the preprocessing. In the preprocessing step, the breast boundary and the pectoral muscle are extracted. In the next step, breast region is segmented as the dense and fatty region. Then, the percentage of the fatty and dense tissue area is calculated. Finally, the decision tree is used for classifying the breast density patterns.
Methodology
Dataset
The mammograms used in this study were obtained from the Mini-MIAS database. This database contains 322 images, which were categorized into three classes: fatty, glandular and dense. All of the images are 1024 × 1024 pixels in size. To reduce the computational complexity, the actual size of the mammogram was minimized to 256 × 256. The MIAS database is a public database, made freely available on the internet. One-eighty mammograms were randomly chosen from the MIAS database, being 60 images of fatty, 60 images of glandular and 60 images of dense. The expert radiologist determined the density type contained in the mammogram.
Preprocessing
The mammogram background and the pectoral muscle were excluded in the pre-processing step. Mammograms can be categorized into three distinct regions: background, pectoral muscle and breast region. Accurate segmentation of the breast region from other region is an important step for breast density measurement [5]. The main objective of this pre-processing is to remove these unwanted regions. Breast boundary and pectoral muscle segmentation are an important process in computer-assisted breast cancer detection.
Boundary extraction
The breast boundary was extracted from the surrounding background using an automated breast boundary extraction algorithm. Segmentation of breast region is important for both analysis and enhancement of mammograms for computer-aided breast cancer detection. Breast boundary extraction is a difficult task due to artifacts and noise that are present near the boundary in mammograms. Breast boundary extraction is an important step for removal of the pectoral muscle. By removing the breast boundary, the precision of pectoral muscle segmentation was enhanced and the computation time was reduced. The segmented breast boundary excluded from the background, labels and artifacts. The density was estimated only within the breast region [6]. Breast boundary exists between a high-density region and a low-density region. Breast boundary extraction includes removal of artifacts and labels in digital mammograms.
The proposed method combines the thresholding method and edge flag algorithm. This work uses thresholding approach to segment background of the left breast. Then, the right side of the breast boundary was segmented using edge flag algorithm. The left background of the mammogram, with pixel intensity values close to black, was excluded using the thresholding method. Regions having gray values greater than the threshold are assigned as breast regions and regions having gray values less than the threshold are assigned as background [7].
Algorithm 1: Left breast boundary extraction using threshold method
For each horizontal line
For x=0 (left) to x=max (right)
If x<30 (background) then
x=0
End
End
If x () =0 and x! =0 (left boundary)
Edge=i
End
//segment left background
new image=image (:, edge: max)
Algorithm 2: Right breast boundary extraction using edge flag algorithm
For each horizontal line
For x=0 (left) to x=max (right)
Boundary=FASE
If x=0 (boundary)
Boundary=TRUE
End
If Boundary=TRUE
x=0
End
End
Pectoral muscle segmentation
The pectoral muscle presence is a dominant dense region in the mammograms. The pectoral muscle can affect the mammogram density classification due to their high-density region. So, the removal of the pectoral muscle from the mammogram is essential for computer assisted mammogram analysis. Automatic pectoral muscle identification can reduce the bias of mammogram density classification and estimation [8]. In the majority of cases, pectoral muscles are easy to segment from the surrounding tissue. In some cases, the entire pectoral muscle or parts of pectoral muscle are not visible [9]. The proposed pectoral muscle segmentation method is based on the following properties: (1) The pectoral muscle presents on top left or right corner of the mammogram (2) The pectoral muscle appears as higher intensity region than the surrounding tissue (3) The pectoral muscle forms a triangular shaped region (4) There is a gradual decrease in width of the pectoral muscle from top to bottom and (5) The presence of pectoral muscle next to the vertical straight line in the mammogram image.
Step 1: K-means clustering applied to segment the dense region. The dense region is assigned to pixel intensity value of 255.
Step 2: The pectoral muscle is located next to the vertical straight line. The breast backgrounds have been excluded using breast boundary extraction method. Top left corner of the image is considered as the seed point I (1, 1).
Step 3: Select first three rows, on which the pectoral muscle edge is relatively clear. Let I(x, y) intensity of the pixel at (x, y) position. Let I be a m×n image, with m rows and n columns.
for i=1 to 3 do
for j=1 to n do
If I (i, j) ==255 &&I (i, j+1)! =255 /* Edge of the pectoral muscle region */
I (i, j) =0;
Edge= n;
end if
end for
end for
Step 4: Find the pectoral muscle region, there is a gradual decrease in width of the pectoral muscle from top to bottom.
for i=1 to m
for j=1 to edge
If I (i, j) =255
I (i, j) =0
Edge=Edge-2 /* gradual decrease in the pectoral muscle width */
End if
End for
End for
Segmentation
Segmentation process is employed to dividing an image into distinct regions based on the properties such as brightness, contrast, texture, gray-level and color. The medical image segmentation is useful for identify anatomical structure, suspicious lesion, and measurement of tissue volume [10]. Thresholding was used in order to group the pixels of the digital mammogram into two separate categories: fatty and dense tissue.
Thresholding: Threshold segmentation based on a global property usually intensity of a pixel. Threshold method used to segment the mammogram into distinct regions. Mathematically threshold can be expressed as follows
R (x, y) =1 if I(x, y)>T
R (x, y) =0 if I(x, y)<T
where R (x, y) is the resulting pixel at coordinate (x, y), I (x, y) is the pixel intensity of input image and T is the threshold value. The key parameter in the thresholding segmentation is the choice of the threshold value. Various methods for choosing a threshold value such as automatic thresholding algorithm and user can manually choose a threshold value [10]. In this work, the manual threshold value was used.
Mammogram Density Classification
Mammogram density can be calculated based on the following steps: (1) The breast background and the pectoral muscle are excluded, (2) Group the pixels of the digital mammogram into two separate categories: fatty and dense tissue, (3) Calculate the total dense area, (4) Classification of breast density using decision tree. The total fatty and dense area were estimated using the mammographic percent fatty (PF) and percent density (PD) [11]. The PD and PF can be estimated by
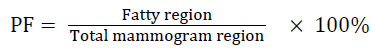 →(1)
→(1)
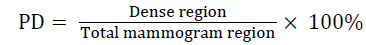 →(2)
→(2)
Decision tree
The decision tree classifier is a supervised learning method. A decision tree is useful for pattern recognition task. It works well on both categorical and numerical data. It consists of branches, nodes, and leaves that indicate the conditions, variables and outcomes, respectively. The decision tree is constructed as a set of decision rules [12]. The decision tree classifiers organized a series of test conditions in a tree structure. This classification generates the output like a binary tree structure. A decision rule used to predict target output based on several inputs. A decision tree is constructed by using the three nodes such as root, internal and leaf. Both root and internal node contain test conditions. Each leaf node has a target class [13]. The construction of tree is described as follows:
• Choose an attribute as a root node and generate a test condition on the attribute. The attribute selection is based on the measures such as information gain and gini index.
• The decision about the each node is either continuing for splitting the node or leaf node.
• The splitting process is repeated until it reaches target class.
• A decision class is assigned to leaf node
In this work, classification and regression tree (CART) was constructed from the percentage of fatty and dense region was calculated. CART works well on both numerical and categorical data [14].
Performance measures
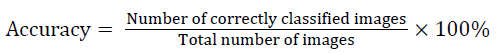
A three-fold cross-validation was used to evaluate the classifier using the calculated percentage of fatty and dense region. The data sample was split into three equal-sized sub sets. In the first fold, two subsets were used for training and one subset was used for testing. This process was repeated for two more times using a different training and testing subset. After the threefold cross validation testing, the performance of the classifier was evaluated by combining the performances of the three test subsets. The performance measures were calculated for each iteration. The average of the three-fold provides the actual classification accuracy, specificity, and sensitivity of the proposed system. These measures are expressed as follows [15,16]:
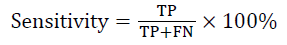
TP: Fatty images that are classified as fatty.
TN: Non-fatty images that are not classified as fatty.
FP: Non-fatty images that are classified as fatty.
FN: Fatty images that are not classified as fatty.
The sensitivity and specificity of fatty images were calculated using above mentioned TP, TN, FP and FN. Similar approach was used for glandular and dense images.
Experimental Results and Discussion
In this work, we used 180 mammogram images from MIAS database. This experiment was performed on 60 fatty, 60 glandular and 60 dense mammograms. The pre-processing techniques were applied to digital mammograms of the database. In pre-processing, mammogram background and pectoral muscle were removed using the proposed breast boundary extraction and pectoral muscle removal methods. The mammogram segmentation was implemented using threshold technique. The mammograms were segmented into two different regions: fatty and dense tissue. The preprocessing and segmentation results of three different densities are shown in Figures 1A-1D. The percentage of fatty and dense tissue area was calculated from the segmented image. The percentages of total fatty and dense area were used in the decision tree to classify the mammogram into fatty, glandular and dense.

Figure 1: Mammogram images. A) Fatty, glandular and dense; B) After the boundary extraction; C) After the pectoral muscle removal; D) Segmentation of fatty and dense tissue.
Total of 180 mammogram images were evaluated using 3-fold cross-validation. In this method, 180 images were randomly grouped into three equal subsets. Each subset contains 80 images. In the first fold, 120 images were used to train the classifier and the remaining 80 images to test the classifier. Similarly, a different subset was used for other two folds. Table 1 shows the confusion matrix for mammogram density classification after three-fold cross validation. The performance measures were calculated using the confusion matrix and shown in Table 2.
| Classes | Fatty | Glandular | Dense | Total |
|---|---|---|---|---|
| Fatty | 59 | 0 | 0 | 59 |
| Glandular | 1 | 59 | 2 | 62 |
| Dense | 0 | 1 | 58 | 59 |
| Total | 60 | 60 | 60 | 180 |
Table 1: Confusion matrix of DT classifier after three-fold cross validation.
| Classes | Sensitivity | Specificity | Accuracy |
|---|---|---|---|
| Fatty | 98.33 | 100 | 98.33 |
| Glandular | 98.33 | 98.33 | 98.33 |
| Dense | 96.67 | 99.17 | 96.66 |
| Average | 97.77 | 98.33 | 97.77 |
Table 2: Performance measures.
Decision tree obtains 98% classification accuracy for mammogram density classification. The reason for choosing the DT classifier is its simple method, low computational cost, and efficient classification performance. To the best of our knowledge, this work is the first of its kind using this method to density classification using mammogram images. The novelty of this work is that, preprocessing and density classification process. The proposed approach reduces the misclassification rate by 2%, with 4 of 160 missed diagnoses.
Conclusion
The CAD system is developed to classify the mammograms into three different densities including fatty, glandular and dense. In this work quantitative measure has been used for mammogram density classification. The proposed approach obtains 98% of the mammogram are correctly classified into three density classes. The proposed methodology obtains good classification accuracy. This CAD system might help radiologists to avoid misdiagnosis.
References
- Liu CC, TsaiCY, Liu J, Yu CY, Yu SS. A pectoral muscle segmentation algorithm for digital mammograms using Otsu thresholding and multiple regression analysis. Comput Math Appl 2012; 64: 1100-1107.
- Subashini TS, Ramalingam V, Palanivel S. Automated assessment of breast tissue density in digital mammograms. Comput Vision Image Understanding 2010; 114: 33-43.
- Vallez N, Bueno G, Deniz O, Dorado J, Seoane JA, Pazos A, Pastor C. Breast density classification to reduce false positives in CAD systems. Comput Method Program Biomed 2014; 113: 569-584.
- Li XZ, Williams S, Bottema MJ. Background intensity independent texture features for assessing breast cancer risk in screening mammograms. Pattern Recogn Lett 2013; 34: 1053-1062.
- Keller BM, Nathan DL, Wang Y, Zheng Y, Gee JC, Conant EF, Kontos D. Estimation of breast percent density in raw and processed full field digital mammography images via adaptive fuzzy c-means clustering and support vector machine segmentation. Med Physics 2012; 39: 4903-4917.
- Zhou C, Chan HP, Petrick N, Helvie MA, Goodsitt MM, Sahiner B, Hadjiiski LM. Computerized image analysis: estimation of breast density on mammograms. Med Physics 2011; 28: 1056-1069.
- Abo-Eleneen ZA, Abdel-Azim G. A novel statistical approach for detection of suspicious regions in digital mammogram. J Egyptian Math Soc 2013; 21: 162-168.
- Camilus KS, Govindan VK, Sathidevi PS. Computer-aided identification of the pectoral muscle in digitized mammograms. J Digital Imaging 2010; 23: 562-580.
- Mustra M, Grgic M, Delac K.Breast density classification using multiple feature selection. Automatika J Control Meas Electron Comput 2012; 53: 362-372.
- Sharma N, Aggarwal LM. Automated medical image segmentation techniques. J Med Phys 2010; 35: 3-14.
- Keller BM, Nathan DL, Wang Y, Zheng Y, Gee JC, Conant EF, Kontos D. Estimation of breast percent density in raw and processed full field digital mammography images via adaptive fuzzy c-means clustering and support vector machine segmentation. Med Physics 2012; 39: 4903-4917.
- Luo ST, Cheng BW. Diagnosing breast masses in digital mammography using feature selection and ensemble methods. J Med Syst 2012; 36: 569-577.
- Nithya R, Santhi B. Decision tree classifiers for mass classification. Int J Signal Imaging Syst Eng 2015; 8: 39-45.
- Nithya R, Santhi B. Computer Aided Diagnosis System for Mammogram Analysis: A Survey. J Med Imaging Health Informat 2015; 5: 1-22.
- Acharya UR, Sree SV, Chattopadhyay S, Suri JS. Automated diagnosis of normal and alcoholic EEG signals. Int J Neural Syst 2012; 22: 1250011.
- Manikandaprabhu P, Karthikeyan T. Unified RF-SVM model based digital radiography classification for Inferior Alveolar Nerve Injury(IANI) identification. Biomedres 2016; 27: 1107-1117.