Short Communication - Journal of Cholesterol and Heart Disease (2017) Volume 1, Issue 1
Association between cholesterol and cardiac parameters.
Rabindra Nath Das*
Department of Statistics, The University of Burdwan, Burdwan, West Bengal, India
- *Corresponding Author:
- Rabindra Nath Das
Department of statistics
The University of Burdwan
Burdwan, West Bengal, India
Tel: +91-9830842436
E-mail: rabin.bwn@gmail.com
Accepted Date: March 10, 2017
Citation: Das RN. Association between cholesterol and cardiac parameters. J Cholest Heart Dis. 2017;1(1):3-7
Keywords
Cardiac parameter, Cardiovascular disease, Joint generalized linear models, High-density lipoprotein, Low-density lipoprotein, Total cholesterol, Very low-density lipoprotein.
Introduction
There is no specific cardiovascular disease (CVD) marker. Generally, total cholesterol (TC) is used as a cardiac disease marker as it is a principal cause of atherosclerosis and heart disease [1-4]. Several studies have shown the association between TC and CVD [5-10]. Recently, the Prospective Studies Collaboration (using meta-analysis) has shown the association between CVD and TC in all ages and in both sexes [11]. Though the association between TC and CVD mortality is observed in all ages and in both sexes [11], but the risk decreases as the age increases, and it is minimal more than age of 80 years [12]. However, there are several contradictions to the association between TC and CVD. Specifically, most of the Japanese epidemiological studies have focused that the high TC is not a risk factor for stroke [13-16].
It is well-known that TC is the sum of low-density lipoprotein (LDL-C), high-density lipoprotein (HDL-C), and very lowdensity lipoprotein (VLDL-C). Triglyceride is not included in TC. TC below 200 (mg/dL) is treated as normal, and more or equal to 200 (mg/dL) is recognized as high. The Centers for Disease Control and Prevention has analyzed data from 2005- 2008, and it has examined incidence, prevalence, treatment, and control of high LDL-C levels [17]. It is observed that approximately 71 million American adults (33.5%) had high LDL-C levels, but only 34 million (48.1%) got treatment, and 23 million (33.2%) had their LDL-C controlled [17]. It is known that TC and CVD are associated in all ages in both the sexes [12], but a high LDL-C level is associated with a higher risk of CVD, while a high level of HDL-C is associated with a lower risk of CVD [18]. The medical practitioners first measure the total cholesterol levels to assess a patient’s cardiac risk. For more specific guidance, the doctors divide the TC level by the HDL-C level. The CVD risk is minimized by having a lower TC level, and a higher proportion of HDL-C level. The ratio of TC to HDL-C should be less than 4 to 1.
It is mentioned as in the above that there may or may not be association between the cholesterol and its components with the cardiac parameters. The present report considers the following hypotheses. Is there any association between the cholesterol and its components with the cardiac parameters? What are the effects of cholesterol and its components on the cardiac parameters? These issues are examined in the current report based on real data analysis.
Background
Most of the earlier research articles have used the statistical techniques such as meta-analysis, simple product moment correlation coefficient, Logistic regression, classical simple & multiple regression analyses, Chi-square test [3,5,7,9,11,17] which are not appropriate for the analysis of positive, heteroscedastic, correlated, non-normally distributed data [19-21]. The physiological continuous random variables such as total cholesterol, low-density lipoprotein, high-density lipoprotein, ratio of TC to HDL-C, blood pressures (basal, systolic, diastolic, maximum), heart rates (basal, peak, maximum), cardiac ejection fractions are mostly heterogeneous, positive, and non-normally distributed [22-24]. Recently, a few articles [6,9,11,22,24] have considered the responses as positive, heteroscedastic and nonnormally distributed, but the associations of TC, LDL-C, HDL-C and the ratio of TC to HDL-C with the cardiac parameters have not clearly focused. Based on the recent articles [6,22,24,25], and along with some new analyses, the present report focuses the associations of TC, LDL-C, HDL-C and the ratio of TC to HDL-C with the cardiac parameters. Most of the earlier research articles have assumed the distribution of the random variables (cholesterol and its components) as Normal. Practically, these random variables are non-Normally distributed [6,24]. Earlier used statistical techniques are mostly based on Normal distribution. The present data sets are positive, and their variances are non-constant, distributions are non-Normal, and the earlier used statistical methods are inappropriate. These issues have motivated us to examine the association between the cholesterol and its components with the cardiac parameters.
Methodology
The responses TC, LDL-C, HDL-C, the ratio of TC to HDL-C and cardiac parameters are positive, heterogeneous and nonnormally distributed. These responses are generally modeled either by the gamma or the Log-normal joint generalized linear models (JGLMs) [20,22]. These two models and the analysis techniques are well described in [20-22]. Using link functions, two models one for the mean and the other for the variance are derived using iteration process. For ready reference, these two models are shortly reproduced herein. For analyzing the positive response yi's, Nelder and Lee [26] have derived a modeling technique, known as the joint generalized linear models (JGLMs) which is as follows.
For the positive response Yi, generally, the log transformation Zi=logYi is used. Assuming the log-normal distribution of Zi a joint modeling of the mean and variance is such that
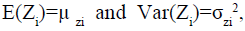
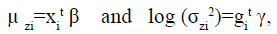
where xit and git are the row vectors for the regression coefficients β and γ in the mean and dispersion model, respectively.
For a positive response yi, if
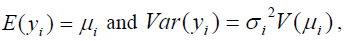
where V (*) is the variance function and  s are the dispersion parameters, and V(μ )=μ2 , then the joint gamma models for the mean and the variance parameters are

where g(*) and xit are GLM link functions for the mean and the variance, respectively; and xit, wit are respectively, the row vectors associated with the mean parameter β and the variance parameter γ. Maximum likelihood (ML) method is used for estimating the mean parameters β, while the restricted ML (REML) is used for estimating the dispersion parameter γ [20].
Materials
The present report has considered two secondary data sets which are given respectively [6,24]. The data descriptions, collection methods, patients population are clearly described in the related papers. For ready reference, the factors/ covariates are described herein.
First data set
The data set contains 366 subjects along with 20 factors/ covariates with all non-missing information (Table 1) [6]. It can be downloaded at http://biostat.mc.vanderbilt.edu/ wiki/ Main/DataSets?CGISESSID=10713f6d891653ddcbb7ddbdd9cf fb79. The factors/ variables of the data set are age, sex (male=1, female=2), total cholesterol (TC), high density lipoprotein (HDL-C), lipid ratio= cholesterol/HDL-C (Ratio), glycosolated hemoglobin (GLYHB), stabilized glucose (STB.GL), subject's height (Height), subject's weight (Weight), body mass index (BMI), frame (1=small, 2=medium, 3=large) (Frame), location (1=Buckingham, 2=Louisa) (Location), first diastolic blood pressure (BP.1d), first systolic blood pressure (BP.1s), second diastolic blood pressure (BP.2d), second systolic blood pressure (BP.2s), subject's hip measurement (Hip), subject's waist measurement (Waist), index of fat distribution (=waist/hips ratio) (IFD), postprandial time when labs were drawn (TIM.PN).
| Response | Associated with | Estimate | Standard error | t-value | P-value | Association type |
|---|---|---|---|---|---|---|
| Mean TC | HDL-C | -0.001 | 0.001 | -0.401 | 0.689 | Insignificant |
| Lipid ratio | -0.004 | 0.001 | -1.39 | 0.165 | Insignificant | |
| HDL-C*ratio | 0.005 | 0.001 | 64.34 | <0.001 | Positive | |
| Variance of TC | BP.1s | -0.001 | 0.021 | -0.04 | 0.968 | Insignificant |
| BP.1d | -0.112 | 0.031 | -3.76 | <0.001 | Negative | |
| BP.1s*BP.1d | 0.001 | 0.001 | 1.73 | 0.084 | Positive | |
| Mean HDL-C | TC | 0.005 | 0.001 | 51.26 | <0.001 | Positive |
| Lipid ratio | -0.219 | 0.003 | -76.43 | <0.001 | Negative | |
| BP.1s | 0.001 | 0.001 | -1.39 | 0.188 | Insignificant | |
| BP.1d | 0.001 | 0.001 | 2.00 | 0.039 | Positive | |
| Variance of HDL-C | BP.1d | 0.008 | 0.006 | 1.903 | 0.058 | Positive |
| Mean Lipid ratio | TC | 0.005 | 0.001 | 55.48 | <0.001 | Positive |
| HDL-C | -0.018 | 0.001 | -81.90 | <0.001 | Negative | |
| Variance of ratio | BP.1d | -0.018 | 0.006 | -3.07 | 0.002 | Negative |
| Mean BP.1d | TC | 0.001 | 0.001 | 1.29 | 0.198 | Insignificant |
| HDL-C | 0.001 | 0.001 | 2.17 | 0.031 | Positive | |
| BP.1s | 0.005 | 0.001 | 15.28 | <0.001 | Positive | |
| Variance of BP.1d | BP.1s | 0.004 | 0.003 | 1.31 | 0.192 | Insignificant |
| Mean BP.1s | TC | 0.001 | 0.001 | 0.94 | 0.348 | Insignificant |
| BP.1.d | 0.001 | 0.001 | 16.12 | <0.001 | Positive |
Table 1: Associations of TC, HDL-C, lipid ration with cardiac parameters (1st data set).
The data set contains total cholesterol (TC), high density lipoprotein (HDL-C), lipid ratio=cholesterol/HDL-C (Ratio), and cardiac parameters such as first diastolic blood pressure (BP.1d), and first systolic blood pressure (BP.1s). Only the analysis of TC is given in [6]. The analyses of HDL-C, lipid ratio, BP.1d, and BP.1s have been derived based on both the log-normal and gamma models. Based on the current analyses and TC analysis from [6], the following associations between TC and its components with the cardiac parameters are reported as follows.
* From [6], TC analysis shows the following associations. The mean TC is separately negatively insignificantly associated with HDL-C (P=0.920) and the lipid ratio (P=0.318), while it is positively significantly associated with the joint interaction effect of HDL-C and lipid ratio (P<0.001). The variance of TC is negatively insignificantly associated with the first systolic blood pressure (BP.1s) (P=0.968), while it is negatively significantly associated with the first diastolic blood pressure (BP.1d) (P<0.001), indicating that the patients with higher BP.1d have lower TC variance. But the joint interaction effect of BP.1s & BP.1d (P=0.084) is positively significantly associated with the TC variance.
*The high density lipoprotein (HDL-C) analysis shows the following associations. The mean HDL-C is positively significantly associated with the TC (P<0.001), and it is inversely significantly associated with the lipid ratio (P<0.001). The mean HDL-C is negatively insignificantly associated with the first systolic blood pressure (BP.1s) (P=0.188), while it is positively significantly associated with the first diastolic blood pressure (BP.1d) (P=0.039). The variance of HDL-C is positively significantly associated with the first diastolic blood pressure (BP.1d) (P=0.058).
*The lipid ratio (TC/HDL-C) analysis shows the following associations. The mean lipid ratio is positively significantly associated with the TC (P<0.001), and it is inversely significantly associated with the HDL-C (P<0.001). The variance of the lipid ratio is negatively significantly associated with the first diastolic blood pressure (BP.1d) (P=0.002).
*The first diastolic blood pressure (BP.1d) analysis shows the following associations. The mean first diastolic blood pressure (BP.1d) is positively insignificantly associated with the TC (P=0.198). It is positively significantly associated with the HDL-C (P=0.031) and the first systolic blood pressure (BP.1s) (P<0.001). The variance of BP.1d is positively insignificantly associated with the BP.1s (P=0.192).
*The first systolic blood pressure (BP.1s) analysis shows the following associations. The mean BP.1s is positively insignificantly associated with the TC (P=0.348), and it is positively significantly associated with the BP.1d (P<0.001). All the above summarized results are given in Table 1.
Second data set
The data set is taken from Modeling of Biochemical Parameters [24]. It contains 64 subjects with 21 factors/ variables which are age, sex, weight, height, body mass index, obesity, lifestyle, dietary habits like eating in outside (no=0, yes=1), smoking habit (no=0, yes=1), types of oil consumption, family blood pressure (no=0, yes=1) (BP), family history (FH) of diabetes mellitus (no=0, yes=1) (DM), hypertension with coronary heart disease (no=0, yes=1) (CHD), history of any drug intake (no=0, yes=1), history of past illness (no=0, yes=1), fasting plasma glucose level (PGL), serum triglyceride (STG), total cholesterol (TC), low density lipoprotein (LDL-C), high density lipoprotein (HDL-C), fasting serum insulin (FI).
Associations
The above data set contains TC, LDL-C, HDL-C, and two cardiac parameters family blood pressure (no=0, yes=1) (BP), hypertension with coronary heart disease (no=0, yes=1) (CHD). The analyses of TC, LDL-C and HDL-C are given in [24]. Family blood pressure and hypertension with coronary heart disease are both categorical characters. The analyses of these two cardiac parameters are not given in Modeling of Biochemical Parameters [24]. Based on the analyses of TC, HDL-C and LDL-C [24], the associations of TC and its components with the two cardiac parameters are presented herein.
*Analysis of total cholesterol (TC) (Table 2) [24] shows that mean TC (or variance of TC) is positively associated with HDL-C (P=0.001). Analysis of LDL-C [24] shows that mean LDL-C is positively associated with TC (P<0.001), while it is negatively associated with the HDL-C (P<0.001). The mean LDL-C is positively associated the coronary heart disease (CHD) (P<0.001), while it is negatively associated with the family blood pressure (BP) (P<0.001). HDL-C analysis does not show any significant association with any cardiac parameter for this data set. All the summarized results for this data set is given in Table 2.
| Response | Associated with | Estimate | Standard error | t-value | P-value | Association type |
|---|---|---|---|---|---|---|
| Mean TC | HDL-C | 0.008 | 0.001 | 3.056 | 0.001 | Positive |
| Serum triglyceride(STG) | 0.002 | 0.001 | 8.80 | <0.001 | Positive | |
| Variance of TC | HDL-C | 0.042 | 0.021 | 2.96 | 0.001 | Positive |
| Mean LDL-C | TC | 0.012 | 0.001 | 19.46 | <0.001 | Positive |
| HDL-C | -0.023 | 0.001 | -11.07 | <0.001 | Negative | |
| coronary heart disease (CHD) | 0.011 | 0.031 | 3.26 | 0.001 | Positive | |
| family blood pressure (BP) | -0.141 | 0.031 | -4.72 | <0.001 | Negative | |
| STG | -0.003 | 0.001 | -10.59 | <0.001 | Negative | |
| Mean STG | TC | 0.012 | 0.001 | 5.46 | <0.001 | Positive |
| Mean STG | HDL-C | -0.011 | 0.011 | -2.14 | 0.024 | Negative |
Table 2: Associations of TC, HDL-C, LDL-C with cardiac parameters (for 2nd set data).
Concluding Remarks
The current report focuses the associations between total cholesterol and its components with some cardiac parameters. Here we have considered TC, HDL-C, LDL-C, lipid ratio (TC/ HDL-C). We have not considered very low-density lipoprotein (VLDL-C), as we have no information for VLDL-C in any set of considered data. There are many cardiac parameters such as basal, systolic, diastolic, maximum blood pressures, basal, peak, maximum heart rates and cardiac ejection fractions. Here we have only systolic, diastolic blood pressure, family blood pressure and hypertension with coronary heart disease (CHD). The present report has shown some associations between TC and its components with the systolic, diastolic, family blood pressures and CVD. In addition, it has shown the associations between TC and its components along with the lipid ratio. Moreover, it has shown the associations between the systolic and diastolic blood pressures. Serum triglyceride (STG) is not included in TC, but TC is positively associated with STG (P<0.001) (Table 2) [24]. Moreover, STG is negatively associated with the HDL-C (P=0.024) and family blood pressure (P=0.041). These two results are included in Table 2.
For the first data set, joint interaction effect of HDL-C and lipid ratio (HDL-C*ratio) is positively significantly associated with the mean TC. Note that HDL-C and lipid ratio (both insignificant effects) are included in the model due to marginality rule by Nelder [27]. Nelder’s marginality rule states that if any higher order interaction effect is significant, then all its lower order effects should be included in the model. It is known that HDL-C is a part of TC, and the lipid ratio is a direct function of TC, so their joint interaction effect should be positively associated with TC. Variance of TC is positively associated with the joint interaction effect of BP.1s and BP.1d (BP.1s*BP.1d). Mean and variance of HDL-C is also separately positively associated with the BP.1d. Variance of lipid ratio is negatively associated with the BP.1d. For the second data set, mean LDL-C is positively associated with coronary heart disease (CHD), and it is negatively associated with the family blood pressure. These results show that TC and its components are associated with cardiac parameters and events.
The considered two data sets are not very good to examine the association between TC and its components with the cardiac parameters, as the first data set is for the diabetic patients, and the second data set is for the young Indian medical students under age 24 years. An ideal data for this study should be the cardiac patients with STG, TC, all the components of TC, and along with all possible cardiac parameters and events. The present report has shown some associations between TC and its components with the cardiac parameters. The first data set contains TC and HDL-C but no LDL-C, whereas the second data set contains all the three. For the second data set, LDL-C has shown many associations with the cardiac parameters than TC, but HDL-C has shown no association (Table 2). It has established that TC and its components have some effects on cardiac parameters. Medical practitioners and every individual should care on total cholesterol and its components.
Conflict of Interest
The author confirms that this article content has no conflict of interest
References
- Ravnskov U. Is atherosclerosis caused by high cholesterol? QJM. 2002;95:397-403.
- Goldstein JL, Brown MS. A century of cholesterol and coronaries: from plaques to genes to statins. Cell. 2015;161:161-72.
- National Cholesterol Education Program. Third Report of the Expert Panel on Detection, Evaluation, and Treatment of High Blood Cholesterol in Adults (Adult Treatment Panel III). NIH Pub. No. 02–5215. Bethesda, MD: National Heart, Lung, Blood Institute; 2002.
- Takata Y, Ansai T, Soh I, et al. Serum total cholesterol concentration and 10-year mortality in an 85-year-old population. Clin Interv Aging. 2014;9:293-300.
- Psaty BM, Anderson M, Kronmal RA, et al. The association between lipid levels and the risks of incident myocardial infarction, stroke, and total mortality: the Cardiovascular Health Study. J Am Geriatr Soc. 2004;52:1639-47.
- Das RN. Relationship Between Diabetes Mellitus and Coronary Heart Disease. Current Diabetes Reviews. 2016;12(3):1-12.
- Esrey KL, Joseph L, Grover SA. Relationship between dietary intake and coronary heart disease mortality: lipid research clinics prevalence follow-up study. J Clin Epidemiol. 1996;49:211-16.
- Schupf N, Costa R, Luchsinger J, et al. Relationship between plasma lipids and all-cause mortality in nondemented elderly. J Am Geriatr Soc. 2005;53:219-26.
- Akerblom JL, Costa R, Luchsinger JA, et al. Relation of plasma lipids to all-cause mortality in Caucasian, African-American and Hispanic elders. Age Ageing. 2008;37:207-13.
- The Lipid Research Clinics Coronary Primary Prevention Trial results. II. The relationship of reduction in incidence of coronary heart disease to cholesterol lowering. JAMA. 1984;251:365-74.
- Prospective Studies Collaboration Lewington S, Whitlock G, Clarke R, et al. Blood cholesterol and vascular mortality by age, sex, and blood pressure: a meta-analysis of individual data from 61 prospective studies with 55,000 vascular deaths. Lancet. 2007;370:1829-39.
- Werle MH, Moriguchi E, Fuchs SC, et al. Risk factors for cardiovascular disease in the very elderly: results of a cohort study in a city in southern Brazil. Eur J Cardiovasc Prev Rehabil 2011;18:369-77.
- Hamazaki T, Okuyama H, Ogushi Y, et al. Towards a paradigm shift in cholesterol treatment- a re-examination of the cholesterol issue in Japan. Ann Nutr Metab. 2015;66(Suppl 4):1-116.
- Ravnskov U. High cholesterol may protect against infections and atherosclerosis. QJM. 2003;96:927-34.
- Herron KL, Lofgren IE, Sharma M, et al. A high intake of dietary cholesterol does not result in more atherogenic LDL particles in men and women independent of response classification. Metabolism. 2004;53:823-30.
- Spence JD, Jenkins DJA, Davignon J. Dietary cholesterol and egg yolks: not for patients at risk of vascular disease. Can J Cardiol.2010;26:336-39.
- Centers for Disease Control and Prevention (CDC). Prevalence, treatment, and control of high levels of low-density lipoprotein cholesterol—United States, 1999-2002 and 2005-2008. MMWR Morb Mortal Wkly Rep. 2011;60:109-14.
- Weverling-Rijnsburger AW, Jonkers IJ, van Exel E, et al. High-density vs low-density lipoprotein cholesterol as the risk factor for coronary artery disease and stroke in old age. Arch Intern Med. 2003;163:1549-54.
- Myers RH, Montgomery DC, Vining GG. Generalized Linear Models with Applications in Engineering and the Sciences. John Wiley & Sons:NewYork;2002.
- Lee Y, Nelder JA, Pawitan Y. Generalized Linear Models with Random Effects (Unified Analysis via H-likelihood). Chapman & Hall. London;2006.
- Firth D. Multiplicative errors: log-normal or gamma? J R Statist Soc B 1988; 50:266-68.
- Das RN. Hypertension risk factors who underwent Dobutamine stress echocardiography. Interventional Cardiology: Open Access. 2016;8(1):595-605.
- Das RN. Diabetes Mellitus & Cardiovascular Disease: Co-Existence? BAOJ Diabetes. 2016;2(1):1-3.
- Das RN. Modeling of Biochemical Parameters. Model Assisted Statistics and Applications. 2011;6(1):1-12.
- Das RN. Diabetes disease progression determinants. BAOJ Diabetes. 2016;2(2):15.
- Nelder JA, Lee Y. Generalized linear models for the analysis of Taguchi-type experiments. Applied Stochastic Models and Data Analysis. 1991;7:107-20.
- Nelder JA. The statistics of linear models: back to basics. Statistics and Computing. 1994;4: 221-34.