Research Article - Research and Reports on Genetics (2019) Volume 3, Issue 1
Application of morphological indices and distribution of qualitative traits of cattle in Obudu grass plateau-cross river state
Dauda A*, Anya MI, Ayuk AA, Okon BI, Eburu PO
Department of Animal Science, University of Calabar, Calabar, Nigeria
- *Corresponding Author:
- Dauda A
Department of Animal Science
University of Calabar
Nigeria
Tel: +2347036707201
E-mail: ayubadauda87@gmail.com
Accepted Date: August 07, 2018
Citation: Dauda A, Anya MI, Ayuk AA, et al. Application of morphological indices and distribution of qualitative traits of cattle in Obudu grass plateaucross river state. J Res Rep Genet. 2018;2(3):5-9.
Abstract
A total of 333 cattle of both sexes were randomly sampled from the population of cattle in Obudu for phenotypic traits measurement. Some of the phenotypic traits measured were Body Weight (BW), Body Length (BL), Height Withers (HW), Head Length (HDL), Head Width (HDW), Ear Length (EL), Rump Length (RL), Heart Girth (HG). Descriptive statistics morphological indices formular were used for the analysis. The result showed that distribution of cattle within the age group of 0-3 had the highest percentage (70.0%) followed by 4-6 (23.8%) and those within the age of 7-9 and 10-12 had same percentage (4.6) while 12 and above had the least percentage (0.7%). The cattle in the study area had different shapes, sizes and length of horns. 23.1% had curved outward and upward horn, 21.5% had backward horn, 17.7 had curved side wards horn, while curved forward and curved outwards were 12.3 and 7.6% respectively. The percentage of female cattle (70.0%) was more than that of the male (30.0%). Among the females, heifers (heifer refers to a young cow that had not calved before.) had the highest percentage (43.8%), followed by pregnant cows (11.5%), dry cows (8.4%) (Dry cow refers to cows that have calved before but are not lactating) while the least was lactating cows (6.1%). The cattle were also categorized by lots. Lot 4 (20.0%) recorded the highest percentage of cattle followed by lot 2 (18.2%) and lot 1(17.6%). Lot 5 (3.8%) recorded the least percentage while lots 3, 6, 7, 8 and 9 recorded 7.6, 10.0, 7.6, 8.5 and 5.5 % respectively. The cattle in the study area had different coat color ranging from white with black spot (48.4%),white with black patches (30.7%), brown with white patches (24.6%), speckled (commonly known as campala) (6.2) and brown with black stipped (1.5). All the morphological indices in this study revealed significant (P<0.05) difference except LI and IPR. This study could serve as a baseline for breeding programme and selection for improvement in Obudu cattle ranch.
Keywords
Cattle, Morphological Indices, Qualitative, Traits.
Introduction
The need for characterization of livestock breeds is a cornerstone for understanding their uniqueness and ability to thrive under various agro climates [1]. The phenotype of an animal is the resultant of the genetics and its peerless blending with the environment where it thrives [1]. The phenotype is further subjected to the social and aesthetic relationships of the owners and the aim for which they were developed [2]. Phenotypic characterization is important for livestock that can thrive well under changing climatic conditions and in unfavorable environments [3]. Phenotypic characterization of livestock generally refers to the process of identifying distinct breed populations and describing their external and production characteristics within a given production environment [4].
Indices are usually considered a superior option for assessment of weight because it incorporates measures of desirable conformation, namely, length and balance [5]. It is expected to provide tested empirical alternative to the limited use of single measurements for the assessment of type, weight and function as well as enhance the ability of breeders to select potential breeding stock [6], it also provide potential purchasers with a reliable information on evaluation of animals since these measurements are associated with production characteristics. Desirable body conformation from the viewpoint of meat production is such a complex character that little progress has been made in reducing it to a single body measurement which can be taken on the live animal [6]. Therefore, body conformation score which is highly subjective and having low heritability have been widely used. However, with the introduction of indices from body measurements, objective assessment of body conformation from the stand point of type may be relatively easier [6].
Qualitative characters have been used for classification and identification of animal populations. Many improved breeds are monotypic for most visible traits and have therefore made quantitative assessment easy to monitor over time. Variation in ordinal traits such as coat color (eumelanin type), ear size, ear attitude, white design facial profile and nominal attributes such as presence and absence of wattles, horn and supernumerary nipples could be of tremendous assistance in generating racial interspecific variations among animal populations within species [6]. Thus, this study was designed to investigate the morphological indices and distribution of qualitative traits of cattle in Obudu Grass Pleateau-Cross River State.
Materials and Methods
Study area
The study area is the Obudu Grass Plateau located in the Obanliku Local Government Area of Cross River State, Southeastern Nigeria. It lies between longitude 90 22’ 00” and 90 22’ 45” E, and latitude 60 21’ 30” and 60 22’ 30” N, with an approximate area of 104 sqm2, and a height of about 1576 m above sea level [7]. Obudu Grass Plateau is bounded in the north by Benue State, northeast by the Republic of Cameroon, to the southeast by Boki Local Government Area in Cross River State of Nigeria. The area is situated within the tropics but it has a climate that is likened to temperate region with mean daily temperatures range between 15°C and 22°C. It has a mean annual rainfall of about 4300 mm with highest rainfall of about 76.2 cm usually recorded in August while the lowest of 0.76 cm is usually recorded in December [8]. The Obudu Grass Plateau is part of the Precambrian Basement Complex of Nigeria [7].
Management system of the experimental animals
The animals were managed under extensive system with little or no provision of shelter in the day and night. The animals are kept in lots (fence with stick or barb wires) in the night. Calves were separated from the cows in the night. The animals grazed during the day time on natural pasture. No Adequate veterinary care was in existent and uncontrolled breeding was also practice. Other management practice such as hand picking of ticks, castration of mature bulls that have used for service over the years and mineral salt were given as supplement.
Phenotypic traits
A total of 333 cattle of both sexes were randomly sampled from the population of cattle in Obudu Grass Plateau for phenotypic traits measurement. The phenotypic traits measured were Body Weight (BW), Body Length (BL), Height-at-Withers (HW), Head Length (HDL), Head Width (HDW), Ear Length (EL), Horn Length (HL), Tail Length (TL), Dewlap Width (DW), Scrotal Circumference (SC), Udder Circumference (UC), Number of Teats (NOT), Foreleg Length (FLG), Hind leg Length (HLG), Horn circumference (HNC), Cannon Length (CL), Cannon Circumference (CCF), Rump Width (RW), Rump Length (RL) and Heart Girth (HG). The body weight was measured using glass fiber band with model number WJ515. Height-at-wither was measured with meter rule while other phenotypic traits were measured with graduated tape. The measurements were done in the morning before the animals were released for grazing. All the measurements were carried out by same person in order to avoid inter individual variations.
Morphological indices and percent distribution of qualitative traits
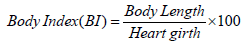
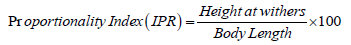
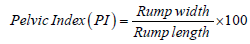
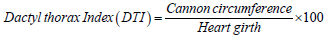
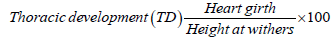
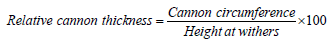
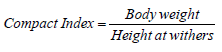
Frequency and percentage distribution were analyzed using descriptive statistic. Morphological indices were calculated based on [5,6,9,10] methods, in order to assess the type and function of the breed. The formulae are described below:
Area Index=height at withers × body length
Length Index 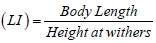
Results and Discussion
The results of frequency and percentage distribution are presented in Table 1. Distribution of cattle within the age of 0-3 years had the highest percentage (70.0%) followed by 4-6 years (23.8%) and those within the age of 7-9 and 10-12 years had same percentage (4.6) while 12 years and above had the least percentage (0.7%), although cattle within the age of 0-3 years are much in the study area, but at the aforementioned age there genetic potential is yet to develop. This agreed with the report of Khan et al. [11] who opined that Genetic progress steadily increased from age 5 to 12 with rapid increases from age 4 to 7. Heifers born from cows 4 to 8 years old should be selected as replacements because is the age at which there genetic potential is express. Heifers born from dams of 3 years old and below are unable to express their genetics potential for growth and have an increased chance of failure in the first calving season and second breeding season. This could increase their likelihood to be removed from the herd. Heifer progeny from dams older than 8 years also exhibited decreased performance [11]. Thus, cattle within the age bracket of 4-8 may be suitable for breeding. Cattle in the study area had different shapes, sizes and length of horns. 23.1% had curved outward and upward horn, 21.5% had backward horn, 17.7% had curved side wards horn, while curved forward and curved outwards were 12.3% and 7.6% respectively. Horn is an adaptive feature because the survival and reproductive success of male offspring and the mother's own genetic fitness are all enhanced [12]. Additionally, for male ungulates there are indications that horns serve as honest signals of genetic quality in female choice of mating partners [13]. The percentage of female cattle (70.0%) was more than that of the male (30.0%). Among the female status, heifers (heifer refers to a young cow that had not calved before.) had the highest percentage (43.8%), followed by pregnant cows (11.5%), dry cows (8.4%) (Dry cow refers to cows that have calved before but are not lactating) while the least was lactating cows (6.1%). The cattle were also categorized by lots. Lot 4 (20.0%) recorded the highest percentage of cattle followed by lot 2 (18.2%) and lot 1(17.6%). Lot 5 (3.8%) recorded the least percentage while lots 3, 6, 7, 8 and 9 recorded 7.6, 10.0, 7.6, 8.5 and 5.5 % respectively. The cattle in the study area had different coat colour ranging from white with black spot (48.4%),white with black patches(30.7%), brown with white patches (24.6%), speckled (commonly known as campala) (6.2) and brown with black stipped (1.5). The variation in color patterns of the cattle in Obudu cattle ranch could be attributed to high rate of inbreeding, uncontrolled mating and outbreeding among the cattle. The animals with one color dominating other colors with uneven and vague pattern of distribution over the entire body could be crossbreds. Animals with manifold color patterns with near even distribution and sizes and those with solid colors could be inbred, since qualitative traits such as colour coat of an animal are controlled by few genes and are not influence by the environment. Certain qualitative characteristics have been lost or modified due to allelic differentiation through random sampling, drift, genetic divergence, inbreeding and crossbreeding [14].
Table 1. Frequency and percentage distribution.
| Traits | Frequency | Percentage | |
|---|---|---|---|
| Age | 0-3 | 99 | 76.1 |
| 4-6 | 31 | 23.8 | |
| 7-9 | 6 | 4.6 | |
| 10-12 | 6 | 4.6 | |
| >12 | 1 | 0.7 | |
| Horn presentation | Curved backward | 26 | 21.5 |
| Curved forward | 25 | 12.3 | |
| Curved out upward | 30 | 23.1 | |
| Curved sideway | 27 | 17.7 | |
| Curved short | 27 | 17.7 | |
| Curved outward | 10 | 7.6 | |
| Sex | Female | 106 | 70 |
| Male | 39 | 30 | |
| Female status | Lactating | 8 | 6.1 |
| Dairy | 11 | 8.4 | |
| Pregnant | 15 | 11.5 | |
| Heifer | 72 | 43.8 | |
| Breed | Exotic | 9 | 6.92 |
| Local | 136 | 93.1 | |
| Colour | White with brown patches | 40 | 30.7 |
| Speckled | 8 | 6.2 | |
| Brown with white patches | 32 | 24.6 | |
| Brown with black stripped | 2 | 1.5 | |
| White with black spot | 63 | 48.4 | |
| Lot | Lot 1 | 10 | Â Â 7.6 |
| Lot 2 | 23 | 17.6 | |
| Lot 3 | 24 | 18.4 | |
| Lot 4 | 10 | 7.6 | |
| Lot 5 | 26 | 20 | |
| Lot 6 | 5 | 3.8 | |
| Lot 7 | 13 | 10 | |
| Lot 8 | 10 | 7.6 | |
| Lot 9 | 11 | 8.5 |
The results of effect of age on morphological indices of cattle are presented in Table 2. All the morphological indices in this study revealed significant (P<0.05) difference except LI and IPR. The BI in this study revealed that cattle within the age group of 0-3 showed low value of 62.10 and animals within the age group of 12 and above revealed high value of 74.59. This implies that age has effect on BI, and also means that older cattle are longiline and are fit for traction than younger once [15]. The PI in this study also revealed low value of 177.34 in cattle within the age group of 0-3 and high value of 247.06 in cattle within the age group of 12 and above. Beside, PI indicates concave shape in cattle, with the amplitude predominating in relation of its rump length [16]. Therefore, older cattle are more concave than Youngers once. This could also mean older cattle have well developed rump length, which is a feature for easy parturition. The DTI is also affected by age, cattle within the age group of 0-3 showed low value of 12.15 and high value of 40.12 for cattle within the age group of 4-6 years. The DTI is an index of measuring thoracic development [17]. This may also implies cattle within the age group of 4-6 years have more meat (flesh) and could be term as slaughter age because is that age that the cattle put on more meat. The TD revealed high value of 1.75 in cattle above 12 years and low value of 1.36 in cattle within the age group of 7-9 years. The values of TD obtained in this study are higher than 1.2 recommended by Alderson [5], for animal with good thoracic development. TD may also be a good indicator of animal physical vigor. The AI is an indication of animal balance and ability to graze over a large area. AI in this study increased with increase in age, this could also mean that the older the animal the more balance the animal is and could graze over a large area. The RCTI in this study revealed high value of 52.630 in cattle within the age group of 4-7. RCTI is a factor determines how strong the leg of the animal is [9]. Beside good leg is one of the important traits for selection. This could imply that cattle within the age bracket of 4-7 may be suitable for breeding. Compact index (CI) indicates how compact the animal is. Meat type animals have values above 3.15; value close to 2.75 indicates dual purpose and close to 2.60 indicates that the animals are more suitable for milk purpose [5,6,9,10]. CI in this study is revealed that animals within the age group of 4-12 showed value ranging from 3.16-3.52, this could be the age that classification of cattle into meat or milk type is suitable, since Compact index indicates how compact the animal is and classify them into meat type with CI value above 3.15, 2.75 as dual purpose animal (both for meat and milk) and 2.60 suitable for milk [17]. This could imply that the cattle in the study area are meat type cattle. Selection for body weight should be encouraged and selection for milk should be discouraged. The results of effect of lots on morphological indices of cattle are presented in Table 3. Lots showed significance (P<0.05) influence on all the morphological indices of cattle. Lots 8 revealed high value of LI (0.92), BI (73.05), and PI (202.17). DTI value in all the lots range from 11.25-32.72 which is higher than 11.0 as recommended for meat type cattle [5,6,9,10]. DTI gives indications of skeletal fineness of an animal; it is greater in meat type animal as compared to dairy animal [18]. The variations observed between the lots of LI, BI and PI could be due different management system, age and breed/strain. Beside, indices calculated from linear measurements established norms for breed type [6]. Indices are also considered a superior option for assessment of weight because it incorporates measures of desirable conformation, namely, length and balance [5]. It is expected to provide tested empirical alternative to the limited use of single measurements for the assessment of type, weight and function as well as enhance the ability of breeders to select potential breeding stock [6]. This means that cattle in lot 8 could be use as breeding stock to improve cattle in the other lots in the ranch [10,19].
Table 2. Effect of age on morphological indices of cattle.
| Parameter | 0-3 | 4-6 | 7-9 | 10-12 | >12 | SEM |
|---|---|---|---|---|---|---|
| LI | 81244 | 85030 | 84313 | 84638 | 87681 | 0.01 |
| BI | 66.02a,b | 64.87b | 62.10b | 67.65a,b | 74.59a | 0.6 |
| IPR | 124.12 | 119.17 | 120.41 | 118.53 | 114.01 | 1.02 |
| PI | 177.34b | 200.98b | 211.49a,b | 201.97b | 247.06a | 2.96 |
| DTI | 12.15b | 40.12a | 37.18a | 40.07a | 38.84a | 1.13 |
| TD | 1.224a,b | 1.312ab | 1.360a | 1.246a,b | 1.175b | 0.128 |
| AI | 11248.72b | 14425.92a,b | 14101.17a,b | 14807.54a | 16698.00a | 256.499 |
| RCTI | 14.989b | 52.630a | 50.553a | 50.219a | 45.652a | 1.4931 |
| CI | 2.2871c | 3.1632a,b | 3.515 | 3.2073a | 2.5972a,b | 0.57 |
a,b,cMean with different superscripts on the same row differ significantly (p<0.05).
SEM: Standard Error of Mean Key; IPR: Proportionality; PI: Pelvic Index; DTI: Dactyl Thorax Index; TD: Thoracic Development; AI: Area Index; RCTI: Relative Cannon Thickness Index; BI: Body Index; LI: Length Index; CI: Compact Index.
Table 3. Effect of lots on morphological indices of cattle.
| Parameter | Lots | SEM | ||||||||
|---|---|---|---|---|---|---|---|---|---|---|
| 1 | 2 | 3 | 4 | 5 | 6 | 7 | 8 | 9 | ||
| LI | 0.75f | 0.78e,f | 0.85b,c,d | 0.83b,c,d,e | 0.79d,e,f | 0.87a,b,c | 0.88a,b | 0.92a | 0.82c,d,e | 0.01 |
| BI | 59.21e | 61.03b,e | 65.57c,d | 66.71b,c | 65.39c,d | 70.98a,b | 71.99a | 73.05a | 71.48a,b | 0.6 |
| IPR | 133.53a | 127.97a,b | 117.96c,d,e | 121.62a,b,c,d | 114.95e,d | 113.21e,d | 113.21e,d | 109.67e | 124.54a,b,c | 1.04 |
| PI | 162.92b | 177.98a,b | 199.53a | 194.47a | 161.84b | 194.47a | 182.54a,b | 202.17a | 200.04a | 2.98 |
| DTI | 18.42b,c | 21.58a,b,c | 29.56a,b | 19.49b,c | 11.26c | 14.6 | 22.87a,b,c | 32.72a | 15.91c | 1.16 |
| TD | 1.228a,b | 1.29a | 1.31a | 1.26a,b | 1.22a,b | 1.23a,b | 1.234a,b | 1.26a,b | 1.14b | 0.01 |
| AI | 10233.18c | 11267.70bc | 13256.97b | 12621.85bc | 8054.60d | 12219.76cd | 130830.05b | 16851.55a | 13105.16b | 257.23 |
| RCTI | 23.49b,c | 27.76a,b,c | 39.32a,b | 24.81b,c | 13.73c | 18.26c | 28.64a,b,c | 41.19a | 18.34c | 4.58 |
| CI | 2.44b,c,d | 2.57a,b | 2.89a,b | 2.70a,b,c | 1.68e | 2.28c,d | 2.29a,c,d | 3.23a | 2.06d,e | 574 |
a,b,c,d,e,fMean with different superscripts on the same row differ significantly (p<0.05).
SEM: Standard Error of Mean Key; IPR: Proportionality; PI: Pelvic Index; DTI: Dactyl Thorax Index; TD: Thoracic Development; AI: Area Index; RCTI: Relative Cannon Thickness Index; BI: Body Index; LI: Length Index; CI: Compact Index.
Conclusion
The based on the results of this study, cattle within the age group of 0-3 had the highest percentage and least is from 12 years and above. Cattle with horn presentation of curved backward had the highest percentage. This could be a preference by the female cattle for mating. Female cattle had high percentage than the male. Cattle with white and black spot coat colour had high percent. This could be due to uncontrolled mating. Cattle in the lot 2 had the highest number of cattle than the other lots. Age had significance (P<0.05) influence on morphological indices except LI and IPR. Lots also had significance (P<0.05) influence on all the morphological indices of cattle in Obudu grass plateau. This study could serve as a baseline for breeding programme and selection for improvement in Obudu grass plateau.
References
- Banerjee S. Morphometrical and production traits of Bengal sheep in West Bengal, India. Anim Genet Resour. 2015;57:57-71.
- Boettcher PJ, Ajmone MP, Lenstra JA. Recent development in the genetic characterization of animal genetic resources. 8th world congress on genetic applied to livestock production. 2010.
- FAO. Coping with climate change -the roles of genetic resources for food and agriculture. FAO 2015, Rome. 2015.
- FAO. Phenotypic characterization of animal genetic resources. FAO Animal Production and Health Guidelines No. 11. Rome. 2012.
- Alderson GLH. The development of a system of linear measurements to provide an assessment of type and function of beef cattle. Anim Genet Resour. 1999;25:45-55.
- Salako AE. Genetic and phenotypic profiles of West African dwarf and Yankasa sheep breeds in Nigeria. Int J Biodivers Conserv. 2013;5(2):47-53.
- Ekweume B. Precambrian Geology and Evolution of the South Eastern Nigeria Basement Complex. University of Calabar Press, Calabar. 2003.
- Mabugunje A. Nigeria: Physical and Social Geography in Africa, South of the Sahara, 12th Edition. 1983;760-70.
- Chacon E, Macedo F, Velazquez F, et al. Morphological measurements and body indices for Cuban Creole goats and their crossbreds. Brazilian J Anim Sci. 2011;40(8):45-52.
- Chiemela PN, Sandip B, Mestawet TA, et al. Structural indices of Boer, Central highland and their F1 Crossbred goats reared at Ataye farm, Ethiopia. J Agri Res. 2016;2(2):1-19.
- Khan MKI, Blair HT, Lopez-Villabos N. Modelling genetic improvement of Pabna cattle in Bangladesh. J Appl Anim Resour. 2017;45(1):239-46.
- Da Silva AG, Musagrave JA, Nollette J, et al. Effect of Damage on offspring productivity. Nabraska Beef Cattle Report. 2016;19.
- Estes RD. The significance of horn and other Male secondary sexual characters in Females Bovids. Appl Anim Behav Sci. 1991;29:403-51.
- Gwaza DS, Yahaya M, Ahemen T. Variation and distribution of qualitative traits of the savannah muturu on free range in the Benue trough of Nigerian. J Res Rep Genet. 2018; 2(1):33-43.
- Mariante ADS, Miserani MG, McManus C, et al. Body indexes for the pantaneiro Horse. 7th World Congress on Genetics Applied to Livestock Production. France. 2002.
- Popoola MA. Zootechnical Index Analysis of West African Dwarf Rams in Southwestern Nigeria. Agricultura Tropica et Subtropica. 2015;48(21):24-9.
- Edilberto C, Fernando M, Francisco V, et al. Morphological measurements and body indices for Cuban Creole goats and their crossbreds. Brazilian J Anim Sci. 2011;40(8):1671-9.
- Mcmanus C, Teixeira RA, Dias LT. Productive and reproductive characteristics of Dutch and mixed Dutch Gir cows on the Central Plateau. R Bras Zootec 2008;37:819-23.
- Salako AE, Ngere LO. Application of multifactorial discriminant analysis in the morphometric structural differentiation of West African Dwarf and Yankasa sheep in Southwest Nigeria. Nig. J Anim. Prod. 2005;29(2):168-70.