Research Article - Biomedical Research (2017) Volume 28, Issue 4
Analytical calibre of high performance liquid chromatography and ion exchange chromatography resin methods in estimation of glycated hemoglobin: a comparitive study
Rukmini MS1*, Ashritha2, Nishmitha P2, Yalla D1, Christy A1 and Manjrekar P11Department of Biochemistry, Kasturba Medical College, Manipal University, India
2Department of Biotechnology, St. Aloysius College, India
- *Corresponding Author:
- Rukmini MS
Department of Biochemistry
Kasturba Medical College, Manipal University, India
Accepted date: September 19, 2016
Abstract
Aim: The present study is aimed to assess the precision and reproducibility of Ion Exchange Chromatography (IEC) resin method in comparison to High Performance Liquid Chromatography (HPLC) with respect to the estimation of Glycated Haemoglobin (HbA1c).
Materials and Methods: 72 subjects who visited Clinical Biochemistry Laboratory, Kasturba Medical College Hospital, Ambedkar Circle, Mangalore for HbA1c estimation were enrolled in the study. HbA1c levels were estimated by both the techniques.
Results: The mean age of the study subjects was 53 ± 15.35 years and their plasma HbA1c levels estimated by HPLC and IEC were (7.44 ± 2.02) and (6.53 ± 1.58) respectively. The sensitivity and specificity were obtained from Receiver Operator Curve (ROC). The Area under Curve (AUC) for HPLC was 1 whereas IEC was 0.824. With respect to both IEC and HPLC, women showed significantly higher HbA1c levels (7.70 ± 2.20 vs. 6.90 ± 2.0) than men (6.70 ± 1.40 vs. 6.70 ± 0.850). Similar values in both the methods were found in men.
Conclusion: Although HPLC is considered to be the gold standard method for estimation of HbA1c, IEC being affordable can serve as an alternative when performed carefully with strict precautions especially in basic laboratories providing diagnostic support for the people of lower socio-economic status.
Keywords
Glycated haemoglobin, HPLC, IEC
Introduction
Diabetes mellitus is characterized by hyperglycaemia due to defective insulin secretion or action, or both leading to micro and macro vascular complications [1]. It is the fourth leading cause of death in most developed countries [2]. The prevalence is high in India and by 2030 Asian Indians would bear maximum burden of the disease worldwide [3]. More often the diagnosis of diabetes is based on either the Fasting Plasma Glucose(FPG) or 2 h plasma glucose value after a 75 g oral glucose tolerance test and HbA1c (threshold ≥ 6.5%). HbA1c estimation should be done by using the National Glycohaemoglobin Standardization Program (NGSP) certified method or a method standardized to the Diabetes Control and Complications Trial (DCCT) reference assay [4]. The advantages of HbA1c estimation include patient feasibility, better pre-analytical stability, and minimal day to day variations. The limitations are the cost, availability, improper measure of glycaemic variability influenced by erythrocyte turnover, haemoglobin variants and the clinical conditions like splenectomy and iron deficiency anaemia [5]. HbA1c assessment once every three months can be helpful to the clinician in decision making and also provide a clear view of the maintenance of patient’s glycaemic targets. It also has a strong predictive value for diabetes associated micro vascular complications. Apart from HPLC and IEC, there are different methods to estimate HbA1c such as affinity chromatography, electrophoresis, spectrophotometric assay, isoelectric focussing, radioimmunoassay, and electrospray mass spectrometry [6]. Studies have shown variation in HbA1c levels when measured by different methods [7]. Hence the present study is aimed to analyse the disparity in HbA1c values obtained from two commercially available techniques HPLC and IEC methods. The assay timings, cost involved and cumulative use of HbA1c have provided the impetus for this study. The aim was to compare the analytical performance of HPLC and IEC in terms of sensitivity and specificity for the estimation of glycated haemoglobin in diabetic patients.
Material and Methods
The study was carried out with a cross sectional design in the Department of Biochemistry, Centre for Basic Sciences, Kasturba Medical College, Mangalore, India. A total of 72 patients aged 20 years or above who visited Clinical Biochemistry Lab, KMC hospital, Ambedkar Circle with requisition of HbA1C estimation were enrolled in the study after obtaining an informed consent. The study was approved by the Institutional Ethics Committee (no. IECKMCMLR-7-13/150). HbA1c in the EDTA-anti coagulated blood samples were estimated with both IEC and HPLC methods within 4 days. The samples were stored at 4°C. The results obtained from IEC were compared with that of HPLC, the gold standard to evaluate the precision and reliability.
High performance liquid chromatography (HPLC) method
The samples were diluted automatically in the apparatus and injected into the analytical cartridge. The D-10 HbA1c analyser (Bio-Rad Laboratories) delivers a programmed buffer gradient of increasing ionic strength to the cartridge, where the haemoglobins are separated based on their ionic interactions with the cartridge material. The separated haemoglobins then pass through the flow cell of the filter photometer, where changes in the absorbance are measured at 415 nm. Two-level calibration was used for quantitation of HbA1c values. A report of value and a chromatogram were generated for every sample.
Ion- exchange resin (IEC) method
In this method proteins are separated primarily through electrostatic interactions between charged amino acid side chains on the surface of the ion exchange resin. HbA1c fraction elute first during column chromatography. Non glycosylated haemoglobin HbA0 binds to the ion exchange resin, leaving GHb in the supernatant.
Methodology
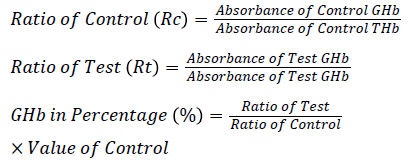
The caps from the ion- exchange resin tubes were removed and labelled as control and test. 0.1 mL hemolysate was added into the appropriately labelled tubes. Resin separator was inserted into each tube so that the rubber sleeve was approximately 1 cm above the liquid level of the resin suspension. Tubes were mixed on a vortex mixer continuously for 5 min. The resin was allowed to settle and then the separator was pushed into the tubes until the resin was firmly packed. Each supernatant was aspirated directly into a cuvette and the absorbance was measured against distilled water in Star 21plus Semi Auto Analyser at 415 nm.
Calculation of correction factor: (Upper limit of HPLC value-upper limit of ion exchange resin value)-(lower limit of HPLC value-lower limit of ion exchange resin value) =1.8. Mean correction factor =1.8/2=0.9.
Statistical analysis
The results were analysed using student’s independent t test in SPSS version 17.0, p<0.05 was considered significant. HbA1c values were expressed as mean ± Standard Deviation. The sensitivity, specificity of HPLC and IEC method was calculated using Receiver Operator Curve (ROC).
Results and Discussion
HbA1c is considered to be the major marker of diabetic control and management. A significant magnitude of variations in HbA1c values estimated by different methods and between the laboratories has been reported in several trials. The Diabetes Control and Complications Trial (DCCT) clearly demonstrated the need for reliable and reproducible methods to measure HbA1c level. Earlier studies have reported nearly 20% difference in the reference range of HbA1c level between HPLC and IEC methods [8]. This is clinically unacceptable because the target values of HbA1c levels required for diabetes management should be prudently validated and method independent to minimise the risk of both life threatening hypoglycaemia and micro vascular complications [9-11]. In the present study HbA1c results obtained from D10 Haemoglobin Testing System (BIO RAD) which is based on caution exchange HPLC were compared with IEC. The mean age of the study population was found to be 53 ± 15.35 years and a statistically significant difference was found (p<0.05, Table 1 and Figure 1) in the plasma HbA1c levels estimated by HPLC (7.44 ± 2.02) and IEC with correction factor (6.53 ± 1.58) (Figure 2). In a comparative study, Mansour AA [12] revealed a wide spectrum of variability in HbA1c levels estimated by turbidimetry and HPLC methods among diabetes subjects with sickle cell trait. The results showed that 87.8% had HbA1c<7% vs. 16.1% by the HPLC method but only 1.5% of patients had >10% HbA1c by turbidimetry vs. 36.0% by the HPLC method.
| Age | HbA1c values in percentage (%) | p value | ||
|---|---|---|---|---|
| HPLC | IEC with correction factor | |||
| Mean ± SD | 53.31 ± 15.35 | 7.44 ± 2.02 | 6.53 ± 1.58 | 0.01 |
| Results are expressed in mean ± SD, p ≤ 0.05 is considered significant. | ||||
Table 1: Estimation of HbA1c by HPLC and IEC methods.

Figure 1: ROC of HbA1c estimation by HPLC and IEC method.

Figure 2: HPLC peak of diabetic sample with elevated HbA1c.
The sensitivity and specificity were obtained from Receiver Operator Curve (ROC). The Area Under Curve (AUC) for HPLC is 1 (Table 2). This clearly suggests that HPLC is a gold standard highly sensitive method with excellent precision and validity. It is rapidly performable with minimum co-variants and is reproducible but expensive. IEC has good correlation (AUC=0.824) with HPLC and is specific for HbA1c estimation but it cannot be considered as a reference method due to coelution of carbamylated Hb and dimers of glycated-α and nonglycated-β chains [13]. It could be reliable, relatively precise, inexpensive and suitable for single sample analysis hence can be considered as an alternative for HbA1c estimation in clinical laboratories with basic facilities. Nevertheless IEC is time consuming. Malekmahmoodi et al. [14] reported a statistically significant correlation coefficient of 0.852 for both baronet affinity and chemical chromatographic techniques. In the present study there was a significant difference in the AUC of IEC and HPLC. IEC had significant correlation (r=0.752, p=0.001). This indicated that IEC can be effective in estimation of HbA1c like HPLC albeit with less sensitivity. The sensitivity and specificity of the IEC method as compared to HPLC was 94% and 62.4% respectively. The quantitative upper and lower limits of HbA1c were 3.7% and 18.4% with a total precision of 1.4% which was comparable to Razi et al. [15] study where they reported 1.6% precision. The linearity for HbA1c levels in IEC were in the range of 4.0%-20.0%.
| Test Variables | Area | Std. errora | Asymptotic sig.b | Asymptotic 95% Confidence Interval | |
|---|---|---|---|---|---|
| Lower bound | Upper bound | ||||
| HPLC | 1.000 | 0.000 | 0.000 | 1.000 | 1.000 |
| IEC | 0.824 | 0.060 | 0.000 | 0.706 | 0.942 |
| Test variables: IEC has at least one tie between positive actual state group and the negative actual state group. aunder nonparametric assumption, bnull hypothesis true area=0.5. |
|||||
Table 2: Area under Curve (AUC) obtained for HPLC and IEC methods.
Based on age the study population was divided into three groups; I: 20 - 40, II: 40 - 60 and III: >60 years. The AUC obtained from ROC for HPLC is 1 across the age groups but for IEC the values for the three groups are 0.581, 0.788, 0.944 respectively with a significant variation among the groups 2 (p=0.014) and 3 (p=0.021). When compared to HPLC group 3 of IEC has a strong correlation (Table 3 and Figure 3). Gender analysis showed that the mean HbA1c levels measured by HPLC and IEC were significantly higher in women (7.70 ± 2.20 vs. 6.90 ± 2.0) compared to men (6.70 ± 1.40 vs. 6.70 ± 0.850) correspondingly (Tables 4 and 5). This was in accordance with the earlier study [16] but the same finding was not observed in other study [17]. Men revealed similar values in both the methods suggesting a good correlation in them. Small sample size, selection of indiscriminate age group and undefined study population are the limitations of the study.
| Age groups | Test Variables | Area | Std. errora | Asymptotic Sig.b |
Asymptotic 95% Confidence Interval | |
|---|---|---|---|---|---|---|
| Lower bound | Upper bound | |||||
| 1 | HPLC | 1.000 | 0.000 | 0.011 | 1.000 | 1.000 |
| IEC | 0.583 | 0.225 | 0.670 | 0.142 | 1.000 | |
| 2 | HPLC | 1.000 | 0.000 | 0.000 | 1.000 | 1.000 |
| IEC | 0.788 | 0.090 | 0.014 | 0.611 | 0.966 | |
| 3 | HPLC | 1.000 | 0.000 | 0.009 | 1.000 | 1.000 |
| IEC | 0.944 | 0.062 | 0.021 | 0.823 | 1.000 | |
| 1: 20-40 years, 2: 40-60 years and 3: >60 years of age Test variables: IEC has at least one tie between the positive actual state group and the negative actual state group. aUnder nonparametric assumption; bnull hypothesis true area=0.5. |
||||||
Table 3: HbA1c values with respect to different age groups.
| Men | Women | |||
|---|---|---|---|---|
| HPLC | IEC | HPLC | IEC | |
| Mean ± SD | 6.70 ± 1.40 | 6.70 ± 0.850 | 7.70 ± 2.20 | 6.90 ± 2.0 |
| Results are expressed in mean ± SD, p ≤ 0.05 is considered significant. | ||||
Table 4: Comparison of HbA1c levels between Men and Women.
| (n=72) | HPLC | IEC with correction factor | P value |
|---|---|---|---|
| Pearson Correlation (r value) | 1 | 0.752 | 0.001 |
| p<0.05 was considered significant. | |||
Table 5: Correlation between HPLC and IEC.

Figure 3: ROC of HbA1c estimation by HPLC and IEC method A) 20-40 years; B) 40-60 years; C) above 60 years.
Conclusion
To estimate HbA1c levels in diabetic subjects the ideal method should be accurate, easily standardized, inexpensive and rapid to perform. Unfortunately, none of the currently used methods meet all these criteria. Hence the advantages and disadvantages of these methods should be evaluated for accurate interpretation of the results. For HbA1c measurement to be useful in the clinical setting, the limitations of the assay method must be recognized to develop realistic goals for patient care. The results of this study showed that HPLC is rapid, easy to use automated procedure that offers accurate HbA1c quantification. Comparatively IEC is cheaper and affordable for lower socio economic people. Hence, the usage of IEC with stringent precautions might be an option in smaller laboratories and semi urban settings.
References
- Giacco F, Brownlee M. Oxidative Stress and Diabetic Complications. Cir Res 2010; 107: 8-70.
- OECD. Diabetes prevalence and incidence in Health at a Glance 2011: OECD Indicators. OECD 2011; 13.
- Goswami R, Mishra SK, Kochupillai N. Prevalence & potential significance of vitamin D deficiency in Asian Indians. Indian J Med Res 2008; 127:229-238.
- Standards of Medical Care in Diabetes Diabetes Care 2014; 37: S14-S80.
- Mahajan RD, Mishra B. Using Glycated Hemoglobin HbA1c for diagnosis of Diabetes mellitus:An Indian perspective. Int J Biol Med Res 2011; 2: 508-512.
- Burtis C, Ashwood E, Bruns D. Tietz Text book of clinical chemistry and molecular diagnostics. India, Elsevier 2006; 4: 879-881.
- Nitin S. HbA1c and factors other than diabetes mellitus affecting it. Singapore Med J 2010; 51: 616-622.
- The Diabetes Control and Complications Trial Research Group. The effect of intensive treatment of diabetes on the development and progression of long-term complications in insulin-dependent diabetes mellitus. N Engl J Med 1993; 329: 977-986.
- Santiago JV. Lessons from the Diabetes Control and Complications Trial (DCCT). Diabetes 1993; 42: 1549-1554.
- Goldstein D, Little RR, Wiedmeyer HM, England JD, Rohlfing CL, Wilke AL. Inter-laboratory standardisation of measurements of glycohemoglobins. Clin Chem 1992; 38: 2472-2478.
- Koskinen LK. Specificity of hemoglobin A1c measurement by cation exchange liquid chromatography. Evaluation of a Mono S column method. Clin Chim Acta 1996; 253: 159-169.
- Mansour AA. Comparison between two methods of glycosylated hemoglobin estimation among patients with sickle cell trait and diabetes. J Diabetol 2013; 2: 3.
- Finke A, Hoelzel W, Jeppsson JO, Kobold U, Miedema K, Penders TJ, Weykamp C. Development of a candidate primary reference material for the international standardization of HbA1c [Abstract]. In: Martin SM, Halloren SP, eds. Proceedings of the XVI Congress of Clinical Chemistry. Cambridge, UK: Pigott Printers 1996: 374.
- Malekmahmoodi Sh, Ahmadi AR, Behnampoor N, Joshaghani HR. Comparing sensitivity and specificity methods of chemical and baronet affinity measuring glycated hemoglobin with HPLC method. Amr J Res Comm 2013; 1: 350-356.
- Razi F, Esfahani EN, Farzami MR, Tootee A, Qorbani M, Ebrahimi SA. Effect of the different assays of HbA1c on diabetic patients monitoring. J Diabetes Metab Disord 2015; 14: 65.
- Sekerija M, Poljicanin T, Erjavec K, Liberati-Cizmek AM, Prasek M, Metelko Z. Gender differences in the control of cardiovascular risk factors in patients with type 2 diabetes -a cross-sectional study. Intern Med 2012; 51: 161-166.
- Kautzky-Willer A, Kamyar MR, Gerhat D. Sex-specific differences in metabolic control, cardiovascular risk, and interventions in patients with type 2 diabetes mellitus. Gend Med 2010; 7: 571-583.