Research Article - Biomedical Research (2017) Volume 28, Issue 22
Analysis on intestinal flora in patients with non-alcoholic fatty liver disease of different glucose metabolism
Jiang Yan1, Xue Ping-yan1,2, Xu Yu-shan1*, Yang Hui-ying1, Li Hong2, Zhang Wen-hua2, Song Ya-xian1, Liu Hua1 and Wang Xiao-e1
1Department of Endocrinology, the 1st Affiliated Hospital of Kunming Medical University, Kunming Yunnan, PR China
2Department of Endocrinology, Liuzhou Railway Central Hospital, Liuzhou, Guangxi, PR China
- *Corresponding Author:
- Xu Yu-shan
Department of Endocrinology
The 1st Affiliated Hospital of Kunming Medical University, PR China
Accepted on May 25, 2017
Abstract
Objective: To analyse the quantitative differences of Eubacterium rectale, Bacteroides thetaiotaomicron, Lactobacillus and Bifidobacterium in non-alcoholic fatty liver patients with type 2 diabetes and nonalcoholic fatty liver patients with normal glucose metabolism to explore the relationship of intestinal flora and the occurrence and development of non-alcoholic fatty liver disease and diabetes.
Methods: 100 cases of Nonalcoholic Fatty Liver Disease (NAFLD) patients with type 2 diabetes, 50 cases of NAFLD patients with normal glucose metabolism and 60 cases of normal metabolism without NAFLD (normal control group) were selected as research objects. The total DNA of faeces was extracted and the expression level of DNA of target bacteria was detected by relative quantification of Real Time PCR.
Results: The quantity of Eubacterium rectale and Lactobacillus in NAFLD patients with type 2 diabetes group was significantly higher than that of NAFLD patients with normal glucose metabolism group, the difference of which was statistically significant (P=0.00, P=0.006), and Bacteroides thetaiotaomicron decreased significantly, the difference of which was statistically significant P=0.002), and the quantity of Bifidobacterium presented no significant difference (P>0.05). The quantity of Eubacterium rectale and Lactobacillus in NAFLD patients with type 2 diabetes group were significantly higher than that of normal control group, the difference of which was statistically significant (P=0.00), and Bacteroides thetaiotaomicron as well as Bifidobacterium decreased significantly, the difference of which was statistically significant (P=0.00). The quantity of Bifidobacterium in NAFLD patients with normal glucose metabolism group decreased significantly normal compared to normal control group, the difference of which was statistically significant (P=0.00), and Eubacterium rectale, Bacteroides thetaiotaomicron and Lactobacillus had no significant difference (P>0.05).
Conclusion: Intestinal flora in patients with non-alcoholic fatty liver disease of different glucose metabolism changes much.
Keywords
Non-alcoholic fatty liver disease, Type 2 diabetes, Intestinal flora, Gut-liver axis.
Introduction
Prevalence of nonalcoholic fatty liver disease
Nonalcoholic fatty liver disease (NAFLD) refers to a clinical pathological syndrome mainly characterized by the diffuse hepatic bullous steatosis and caused by other than alcohol and other liver damage factors, which includes simple hepatic steatosis (NAFL), Nonalcoholic Steatohepatitis (NASH) and the related liver fibrosis, cirrhosis and hepatocellular carcinoma [1]. In recent years, the prevalence rate of NAFLD showed a rising trend. In the western developed countries, prevalence rate of NAFLD in common adults was 20%~33% [2,3]. And in China’s developed areas such as Shanghai, Guangzhou and HK, prevalence rate of NAFLD in adults was around 15% [4].
The relationship between NAFLD and type 2 diabetes
Prevalence rate of NAFLD in patients with type 2 diabetes was higher, and a study from Italy showed that 70% of outpatients with type 2 diabetes met the diagnosis criteria of NAFLD [5]. NAFLD also increases the incidence of type 2 diabetes. Japanese scholars found that the annual incidence rate of type 2 diabetes was 1.7%, five years’ incidence rate was 6.8%, and 10 y’ incidence rate was 17.7% during the following up of NAFLD patients [6]. NAFLD could be a consequence of diabetes, and some scholars believed that NAFLD may be a pre diabetic stage [7] and considered NAFLD patients as new reserve force of type 2 diabetes.
Influence of intestinal flora on NAFLD and type 2 diabetes
The relationship between intestinal flora and NAFLD, type 2 diabetes is a hot topic at present. As important environmental factors going into the human body, the intestinal flora affects nutrition, metabolism and immunity of the host, and plays a very important role in diseases of obesity, diabetes, metabolic syndrome and NAFLD, etc. The formation of metabolic endotoxemia [8] from intestinal flora is involved in the occurrence and development of metabolic disease. At present, domestic researches are basically limited to the category of intestinal flora and NAFLD or type 2 diabetes without the research of NAFLD associated with type 2 diabetes. The method of real-time fluorescence quantitative PCR was adopted in this experiment for patients with NAFLD associated with type 2 diabetes and NAFLD associated with normal glucose metabolism. The Firmicutes refers to Eubacteriu rectale, bacteroidetes represents Bacteroides thetaiotaomicron, and probiotic represents changes of Lactobacillus and Bifidobacterium.
Object
A total of 210 people participated in the study from physical examination center, outpatient department and hospitalization in our hospital from November 2011 to January 2013, aged 21-85 y old. They were divided into 3 groups: (1) 100 patients with NAFLD complicated with type 2 diabetes; (2) 50 cases of NAFLD patients with normal glucose metabolism; (3) 60 cases of normal metabolism of the patients without NAFLD (normal control group). Diagnostic criteria for type 2 diabetes mellitus refered to the literature [9]. The clinical diagnosis of NAFLD is based on the recommended diagnostic criteria from guidelines for the diagnosis and treatment of nonalcoholic fatty liver disease (2010 Edition) [10] made by fatty liver and alcoholic liver disease group of Hepatology branch in Chinese Medical Association, which need comply with the following 3 conditions: (1) no history of smoking or drinking equivalent to alcohol content less than 140 g/week (female<70 g/week); (2) except the specific diseases which can lead to fatty liver such as viral hepatitis, drug-induced liver disease, total parenteral nutrition, hepatolenticular degeneration, autoimmune liver disease; (3) the histological changes of liver biopsy are consistent with the pathological diagnosis criteria of fatty liver disease. In view of the liver histological diagnosis difficult to obtain, NAFLD is defined as: (1) liver imaging manifestations conform to the diagnosis standard of diffuse fatty liver and no other reason for interpretation; and (or) (2) Alanine Aminotransferase (ALT) and (or) Aspartate Aminotransferase (AST), Glutamyl Endopeptidase (GGT) increased continuously for more than half a year with unexpected reason in patients with metabolic syndrome related components. After weight loss and improved IR, abnormal enzyme spectrum and imaging of fatty liver improved even normal can be diagnosed as
NAFLD. GE LOGIQ9 color ultrasonic diagnostic instrument was used for abdominal ultrasound examination: according to the NAFLD guidelines for Asia Pacific region [11], more than two of the following abnormalities found after abdominal ultrasonography can be diagnosed as hepatic steatosis: 1. near field echo of the liver is enhanced, and the far field echo of liver is weakened; 2. liver parenchyma echo is dense and stronger than the renal parenchyma; 3. the display of blood vessels of liver and structure of the bile ducts is not clear.
Materials and Methods
Collection of specimens
Stool specimens of about 2 g were collected from the subjects within 4 h and put into a sterile dry bottle, then numbered and immediately placed at -80°C in the refrigerator to save.
Extraction of fecal DNA
0.25 g fecal samples were weighed and fecal DNA was extracted by Ultra Clean Fecal DNA Isolation Kit (MoBio kit company, USA) and the purity of DNA was tested. Absorbance of the total DNA in 260 nm and 280 nm was detected by UV spectrophotometer to obtain the ratio of concentration of total DNA and OD 260/OD280. If the ratio is between 1.6 and 1.8, it means the sample DNA was of high purity without protein and RNA pollution; if the ratio is less than 1.6, it indicated the protein pollution; if the ratio is between 1.8 and 2, it represents the pollution of RNA [12].
Synthesis of primers
According to the gene sequence of Eubacteriu rectale, Bacteroides thetaiotaomicron and GAPDH (Reference) in GenBank, specific PCR primers were designed by premier5.0 and primer sequences after design and full sequence in the Blast database were compared and verified, and Lactobacillus, Bifidobacterium primers sequence could be respectively found in reference [13,14]. All the primer of primer sequence was synthetized by Shanghai Jierui Biotechnology Company. Upstream primer of Eubacteriu rectale: 5- GGGTGACCGGCCACATTGGG-3, downstream primer: 5- ATCAGACTTGCCGCACCGCC-3, product278 BP; upstream primer of Bacteroides thetaiotaomicron 5- CCGCCTCCGTTAGCTGCGTG-3, downstream primer 5- ACGTAGGCTGCACAGCCGGT-3, product202 BP ; upstream primer of lactic acid bacteria 5- AGCAGTAGGGAATCTTCCA-3, downstream primer 5- CACCGCTACACATGGAG-3, product 341 bp; upstream primer of Bifidobacterium 5- GATTCTGGCTCAGGATGAACGC-3, downstream primer 5- CTGATAGGACGCGACCCAT-3, product 230 bp; upstream primer of GAPDH 5-TCGGCATCATCGAAGGTCTG-3, downstream primer 5-TGCCATTCAGTTCTGGCAGT-3, product 171 bp.
Amplification system
The reaction solution was configured in PCR tube (PCR reaction system 25 μl: FastStart Universal SYBR Green Master (Rox) (2X conc) 12.5 μl, specific upstream primers of sequence 1 μl, specific downstream primers of sequence 1 μl, template DNA 1μl, RNase Free Water 9.5 μl), and PCR reaction was conducted.
The detection of target bacteria in samples
Extraction of fecal DNA samples (210 cases) were respectively carried out by real-time fluorescence quantitative PCR reaction of 4 kinds of target bacteria and Escherichia coli. The PCR reaction conditions of Eubacterium rectale, Bacteroides thetaiotaomicron: polymerase activation for 10 min at 95°C; melting cycle for 15 s at 95°C, annealing/extension for 1 min at 65°C with a total of 40 cycles. PCR reaction conditions of Bifidobacterium: polymerase activation for 5 min at 95°C; melting cycle for 15 s at 95°C, annealing/extension for 1 min at 60°C; 45 s at 72°C with a total of 35 cycles. PCR reaction conditions of Lactobacillus: polymerase activation for 10 min at 95; melting cycle for 15s at 95, annealing / extension for 1min at 61.6with a total of 35 cycles. PCR reaction conditions of GAPDH: polymerase activation for 30s at 95°C; melting cycle for 5 s at 95°C, annealing/extension for 5 s at 61°C, 34 s at 72°C with a total of 40 cycles. The blank control and two random repeat samples were set at the same time in each experiment and after reaction, ABI Prism 7300 fluorescence quantitative PCR instrument automatic drawn amplification power curve melting curve. Ct value was analysed by computer (Ct value refers to amplification cycle times when fluorescence signal of amplification product reached the set threshold in PCR amplification process). Due to Ct value and gene copy quantity in the template presented linear relationship, which meant the value of Ct and expression level of DNA were negatively related, and the higher the Ct value, the lower the expression level of target gene. The 2-Ct method was adopted to calculate the relative expression quantitative of DNA and calculation formula is as the following:
Ct target gene=Ct target geneCt reference gene (GAPDH as reference gene)
Ct=Ct target gene-Ct calibration value, the data in first group as calibration values
Detection of PCR products
1. Gel electrophoresis: 2% agarose gel was prepared, the PCR products were detected by electrophoresis, the gel imaging was conducted by Tanon 3500 UV image analysis system scanner, fragment band positions of PCR amplification product were compared with DNA ladder Maker to determine fragment size of amplification product with observation of results under UV light as well as photographing and recording. 2. Sequencing verification: PCR products 50 μl of the determined target fragment were sent directly to Dalian Bao Biological Engineering Co. Ltd to detect the sequence.
Statistical processing
Excel 2007 was used to set up a database, and SPSS 17. 0 statistical software was adopted. The expression quantity of four kinds of target bacteria was non-normal distribution of measurement data expressed by the median of M (P25, P75). When the comparison of two groups of samples met the normality and homogeneity of variances, t test of the two sample was used; when not meeting the condition, non-parametric test of rank transformation (Mann-Whitney U test) was adopted; P<0.05 was taken as standard of the level of significant difference.
Results
The detection of DNA purity
It was determined by UV spectrophotometer. If the ratio of total DNA to A260/A280 in fecal samples was between 1.6 and 1.8, it showed that the purity of DNA was high and there was no pollution.
Analysis of PCR products
Baseline was set according to the amplification curve and Ct value for each sample was calculated, because of Ct value and gene copy quantity of template presenting the logarithmic linear relationship, gene copy quantity of template can be indirectly understood according to the value of Ct.
The detection of target bacteria and GAPDH amplification products in samples
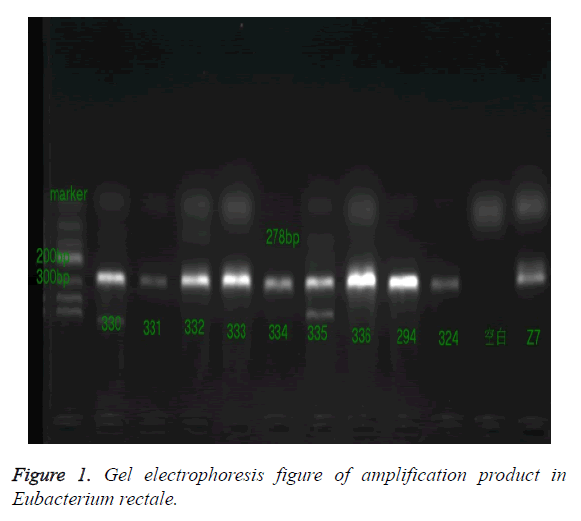
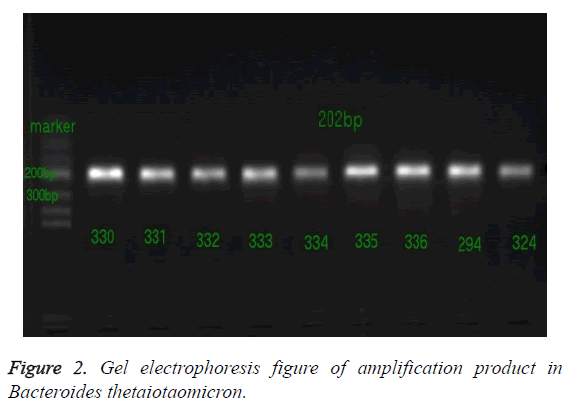
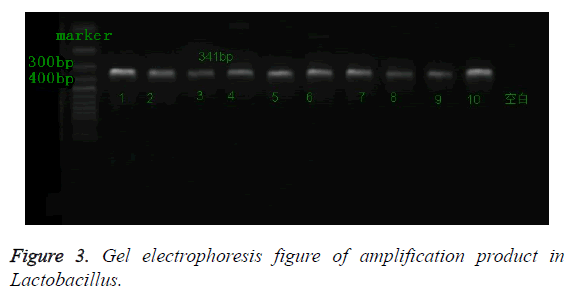
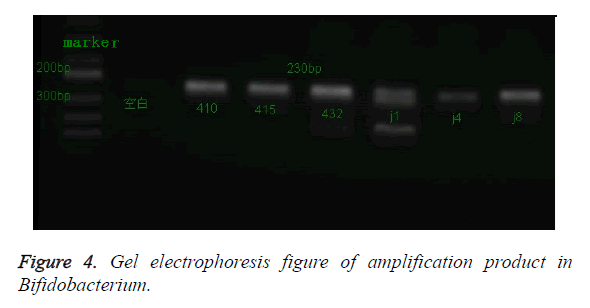
After the reaction, PCR products amplified by 4 kinds of target bacteria were analysed by 2% agarose gel electrophoresis and Tanon3500 UV image, and a clear band appeared at the corresponding position, and the sizes were basically consistent compared with the Marker, as shown in Figures 1-4.
Sequencing results
Sequencing results were compared by Blast and Genebank (http://ncbi.nlm.nih.gov/blast). Results showed that the amplification product sequences were respectively consistent with those of Eubacterium rectale, Bacteroides thetaiotaomicron, Lactobacillus, Bifidobacterium.
The comparison of target bacteria in intestinal tract in NAFLD patients with type 2 diabetes group and NAFLD patients with normal glucose metabolism group and normal population.
According to glucose metabolism situation, the NAFLD patients were divided into NAFLD with type 2 diabetes group 100 cases (A group) and NAFLD patients with normal glucose metabolism group 50 cases (B group), comparing respectively to 60 cases of normal control group (C group). The intestinal target bacteria expression quantity of three groups of subjects is shown in Table 1. And statistical results of the comparison are shown in Table 2. The results are as follows.
| Eubacteriu rectale | Bacteroides multiforme | Lactobacillus | Bifidobacterium | |
|---|---|---|---|---|
| Group A | 0.790, 3.092 | 0.641, 5.117 | 0.002, 0.389 | 0.257, 2.814 |
| Group B | 0.142, 0.436 | 0.985, 11.256 | 0.004, 0.105 | 0.222, 1.165 |
| Group C | 0.003, 0.340 | 1.853, 6.267 | 0.001, 0.023 | 1.052, 10.601 |
Table 1. The relative expression level of target bacteria of subjects of this three groups; Expressed as: (25 Percentile, 75 Percentile).
| Groups A and B | Groups A and C | Groups B and C | ||||
|---|---|---|---|---|---|---|
| Statistic | P | Statistic | P | Statistic | P | |
| Eubacteriu rectale | -4.28 | 0 | -4.88 | 0 | -0.67 | 0.505 |
| Bacteroides multiforme | -3.05 | 0.002 | -3.49 | 0 | -0.48 | 0.631 |
| Lactobacillus | -2.77 | 0.006 | -3.67 | 0 | -0.14 | 0.885 |
| Bifidobacterium | -1.38 | 0.175 | -4.29 | 0 | -4.79 | 0 |
Table 2. The quantity of target bacteria comparison of the three groups.
1. NAFLD patients with type 2 diabetes group and NAFLD patients with normal glucose metabolism group: Eubacteriu rectale quantity in NAFLD patients with type 2 diabetes group was significantly higher than that of NAFLD patients with normal glucose metabolism group, the difference of which was statistically significant (P=0.00), and the quantity of Lactobacillus, Bacteroides thetaiotaomicron decreased significantly, the difference of which was statistically significant (P=0.006, P=0.002), and the quantity of Bifidobacterium presented no significant difference (P=0.175).
2. NAFLD patients with type 2 diabetes group and normal control group: Eubacteriu rectale and Lactobacillus quantity in NAFLD patients with type 2 diabetes group were significantly higher than that of normal control group, the difference of which was statistically significant (P=0.00, P=0.00), and Bacteroides thetaiotaomicron and Bifidobacterium decreased significantly, the difference of which was statistically significant (P=0.00, P=0.00).
3. NAFLD patients with normal glucose metabolism group and normal control group: Eubacteriu rectale, Bacteroides thetaiotaomicron and Lactobacillus and quantity in NAFLD patients with normal glucose metabolism group had no significant difference compared to that of normal control group. Bifidobacterium decreased significantly, the difference of which was statistically significant (P=0.00).
Discussion
Certain studies have shown that intestinal microflora structure had no change without endotoxemia on the condition of NAFL. When NAFL progressed to NASH and liver fibrosis, the imbalance of intestinal flora structure, small intestinal bacterial overgrowth and endotoxemia appeared [15,16]. In our previous study, we found that NAFLD patients had abnormal glucose metabolism [17] (including patients with NAFLD complicated with type 2 diabetes and normal glucose metabolism). Haukeland, etc., [18] studied and found that abnormal glucose metabolism might suggest that NAFLD patients progressed to NASH and hepatic fibrosis. Type 2 diabetes is a strong predictor of NASH and hepatic fibrosis [19]. Then we divided NAFLD group into NAFLD with type 2 diabetes group and NAFLD patients with normal glucose metabolism group, and analysed changes of intestinal bacteria the structure in different status of glucose metabolism in patients with NAFLD.
The "two hit" hypothesis in the pathogenesis of NAFLD pointed out that [20] in the two hit of promoting the liver to progress into NASH, intestinal factors (intestinal flora, mucosal barrier, etc.) played an important role. The imbalance of intestinal microflora, intestinal bacterial overgrowth, increased intestinal permeability and increased endotoxin into the blood, the formation of endotoxemia and endotoxin stimulating release of inflammatory factor from liver Kupffer cells, as well as causing inflammatory reaction, induced the fatty degeneration of liver cell to appear necroinflammation and fibrosis.
Eubacterium rectale, polymorphic bacillus, Lactobacillus, Bifidobacterium play an important role in the host’s energy metabolism, immunity, maintaining the stability of intestinal flora and integrity of intestinal flora of intestinal mucosa barrier function. We observed in NAFLD with type 2 diabetes group, the quantity of Eubacterium rectale, Lactobacillus, Bacteroides were significantly different from those of NAFLD with normal glucose metabolism group and normal control group; and there was only the difference of Bifidobacterium quantity between NAFLD with normal glucose metabolism group and normal control group, suggesting that when NAFLD combined with abnormal glucose metabolism appeared, probably due to the aggregation of abnormal metabolism factors, changes of intestinal microflora were caused, breaking the intestinal-liver axis balance and promoting the subsequent development of disease. It was speculated that the target bacteria might be involved in the process of NAFLD progressing from normal glucose metabolism to type 2 diabetes, and promoting type 2 diabetes to develop into NASH and liver fibrosis, liver cirrhosis through the two hit. Intestinal flora may play an important role in NAFLD to type 2 diabetes and subsequent progression process of disease.
In conclusion, we found that in the intestinal tract of NAFLD patients with type 2 diabetes, Eubacterium rectale, Lactobacillus, and Bacteroides thetaiotaomicron had changes of the quantity, and only Bifidobacteria have obvious difference in NAFLD patients with glucose metabolism, which provided the data for us when studying the relationship of intestinal flora and metabolic diseases.
Acknowledgement
This work was partly supported by the Yunnan province applied basic research project (Grant No: 2017FE468 (-044)) .
References
- Angulo P. Nonalcoholic fatty liver disease. N Engl J Med 2002; 346: 1221-1231.
- Adams LA, Angulo P, Lindor KD. Nonalcoholic fatty liver disease. John Wiley Sons 2011; 565-576.
- Angulo P. GI Epidemiology: nonalcoholic fatty liver disease. Aliment Pharmacol Ther 2007; 25: 883.
- Fan JG, Farrell GC. Epidemiology of non-alcoholic fatty liver disease in China. J Hepatol 2009; 50: 204-210.
- Targher G. Prevalence of nonalcoholic fatty liver disease and its association with cardiovascular disease among type 2 diabetic patients. Diabetes Care 2007; 30: 1212.
- Arase Y. Multivariate analysis of risk factors for the development of type 2 diabetes in nonalcoholic fatty liver disease. J Gastroenterol 2009; 44: 1064.
- Sheth SG, Gordon FD, Chopra S. Nonalcoholic steatohepatitis. Praxis 1997; 126: 963-966.
- Cani PD. Metabolic endotoxemia initiates obesity and insulin resistance. Diabetes 2007; 56: 1761-1772.
- Alberti KGMM, Zimmet PZ. Definition, diagnosis and classification of diabetes mellitus and its complications. Part 1: diagnosis and classification of diabetes mellitus. Provisional report of a WHO Consultation. Diabet Med 1998; 15: 539-553.
- Liver F, ALDSGOCLD Association. Diagnostic criteria of nonalcoholic fatty liver disease. Zhonghua Gan Zang Bing Za Zhi Zhonghua Ganzangbing Zazhi Chinese J Hepatol 2003; 11: 71.
- Fatty liver and alcoholic liver disease group of Hepatology branch in Chinese Medical Association, Endocrinology branch of Chinese Medical Association diagnosis and treatment consensus of nonalcoholic fatty liver disease and metabolic disorders. Chinese J Liver Dis 2010; 26: 531-534.
- Bergman EN. Energy contributions of volatile fatty acids from the gastrointestinal tract in various species. Physiol Rev 1990; 70: 567-569.
- Lin Z. Study on the relationship of intestinal microecology environment and allergic diseases in children and repair of the intestinal mucosal barrier function and adjustment of ndimmune function. Doctoral Degree Thesis of Hebei Medical University. Hebei. Shijiazhuang Hebei Medical University 2011.
- Lou JHY, Li H. Study on the changes of intestinal flora in in different periods of treatment in children with Henoch Schonlein purpura. Yunnan Kunming Kunming Med Univ 2008.
- Shanab AASP, Crosbie O. Small intestinal bacterial over growth in nonalcoholic steatohepatitis: association with Toll-like receptor 4 expression and plasma levels of interleukin. Digest Dis Sci 2011; 56: 1524-1534.
- Fan JXZ, Wang G. Changes of rat’s serum endotoxin levels in the formation of nonalcoholic steatohepatitis. Chinese J Hepatol 2003; 11: 73-76.
- Jiang YXP, Xu Y. Analysis of metabolic disturbance in patients with nonalcoholic fatty liver disease. J Kunming Med Univ 2015; 36: 45-47.
- Haukeland JW. Abnormal glucose tolerance is a predictor of steatohepatitis and fibrosis in patients with non-alcoholic fatty liver disease. Scandinavian J Gastroenterol 2005; 40: 1469-1477.
- Cusi K. Nonalcoholic fatty liver disease in type 2 diabetes mellitus. Curr Opin Endocrinol Diabetes Obes 2009; 16: 141.
- Day CP, James OF. Steatohepatitis: a tale of two hits? Gastroenterology 1998; 114: 842-845.


