Research Article - Biomedical Research (2018) Computational Life Sciences and Smarter Technological Advancement: Edition: II
Analysis of non-seizure and seizure activity using intracranial EEG signals and empirical mode decomposition based approximate entropy
J Ramakrishnan1* and Bommanna Raja Kanagaraj2
1Department of Electronics and Communication Engineering, Sakthi Polytechnic College, Erode, India
2Department of Electronics and Communication Engineering, KPR College of Engineering and Technology, Coimbatore, India
- *Corresponding Author:
- J Ramakrishnan
Department of Electronics and Communication Engineering
Sakthi Polytechnic College, India
Accepted on February 01, 2017
DOI: 10.4066/biomedicalresearch.29-16-2323
Visit for more related articles at Biomedical ResearchAbstract
Epilepsy is a series brain dynamical disorder, characterized by recurrent seizures. It is estimated that incidence rates (number of new cases) range from 24 to 53 per 100000 for every year. Approximately, 33% of epilepsy patients suffer from seizures that are not controlled by anti-convulsant medications. The patients with uncontrolled seizures experience several limitations in family, social and educational activities. Therefore, epilepsy research based on the diagnosis and treatment of seizure is considered to be greater importance. In this study, a method based on empirical mode decomposition and approximate entropy (ApEn) is proposed to analyze the intracranial electroencephalography (iEEG) recorded in non-seizure and seizure activity. For this purpose, a standard database based of University of Bonn, Germany is utilized. The iEEG signals of non-seizure and seizure class are subjected to empirical mode decomposition and Intrinsic Mode Functions (IMF) are obtained. Then the approximate entropy is computed from each IMF. The results show that IMF based ApEn is higher in non-seizure class. The ApEn extracted from the fourth IMF is found to perform better in terms of separating these signals. Highest percentage difference of 165% is obtained for this IMF. Further, the ApEn values extracted from all IMFs except IMF7 and IMF8 is found to have highly statistically significant (p<0.0001).
Keywords
Epilepsy, Approximate entropy.
Introduction
Epilepsy is a common neurological disorder characterized by unprovoked recurrent seizures. It is estimated that about 1% of world population living with epilepsy [1]. It has been reported that annual incidence of epilepsy is 43 people per 100,000 of population in developed nations, and nearly twice in the developing nations [2]. Around 90% of epiepsy patients found in developing nations [3]. Neuronal firing rate associated with the brain activity during seizure greatly differs from the normal state [1]. People with epilepsy suffer from loss of consciousness, depression, mental illness, strange sensations and convulsions [2]. Therefore, the research based on diagnosis of epilepsy is considered to have greater importance.
Electroencephalography (EEG) is a technique that records the electrical activity of brain. In general, there are two types of EEG depending upon the placement of electrodes on the head namely scalp and intracranial. Scalp electrodes placed on the scalp with good mechanical and electrical properties and it gives scalp EEG. It is a non-invasive technique. Intracranial EEGs are invasive technique and recorded by implanting the electrodes in the brain during surgery [4]. These EEG signals contain lot of important information about the pathology of epileptic brain. However, the temporal and spectral characteristics of EEG signals continuously vary with time and these variations make the analyses process very difficult and challenging. Several time and frequency based measures have been reported for the analysis of EEG signals for the diagnosis of epilepsy. Time domain features such as line length, root mean square amplitude, zero crossing, minima and maxima, activity, mobility and complexity have been reported for the analysis of EEG signals [5-7]. Similarly, several frequency based measures such as bandwidth, peak frequency, peak power and intensity weighted bandwidth have been used for detection of epilepsy [7,8]. However, these features do not account the nonstationary property of EEG signals.
In order to address the nonstationary characteristics of EEG signals, numerous time-frequency methods have been proposed in the literature. The short time-Fourier transform and wavelet transform have been used to analyze the EEG signals of normal and epileptic child. The time-varying frequency characteristics of delta, theta, alpha, and beta bands were exploited [9]. In an another study, Cohen class based time-frequency distributions such as Wigner-Ville distribution (WVD), pseudo WVD, Choi Williams distribution and Born-Jordon distribution have been used to study the nonstationary variations of EEG signals associated with normal and epileptic brain [10]. B-distribution based Cohen class time-frequency method has been proposed to investigate the nonstationary property of EEG signals for seizure detection in newborns [11]. Several wavelet transform with different wavelets has been utilized for the understanding the time-varying frequency components of EEG signals [12-14]. Recently, Hilbert-Huang transform based features has been used for the classification of normal and epileptic seizure [15].
Various nonlinear techniques such as correlation dimension, largest Lyapunov exponent, Hurst exponent and approximate entropy has been exploited for the analysis of EEG signals associated with the different mental states [16]. In general, the EEG signals are nonstationary and nonlinear. In order to address both these variations, empirical mode decomposition (EMD) based approach has been exploited for the characterization of EEG signals. In a work, mean frequency extracted from intrinsic mode functions (IMF) of EMD has found to be useful in differentiation of seizure and seizure-free signals [17]. In an another study, the instantaneous area of Hilbert transformation of intrinsic mode functions obtained from EMD has been used to analyze intracranial EEG signals to detect focal temporal epilepsy [18]. Also, the energy computed from the each IMF has been used for the classification of normal and seizure signals [19].
In this work, a scheme based on approximate entropy and empirical mode decomposition is proposed for the detection epileptic seizures from electroencephalogram data recorded from normal subjects and epilepsy patients. For this propose, a standard publicly available database based on University of Bonn is used.
Methodology
Database
In this work, a standard publicly available database is utilized [20]. This database consists of both scalp and intracranial EEG signals recorded from five healthy subjects and five epilepsy patients respectively. These signals were recorded in the epilepsy research community of University of Bonn, Germany.
The entire dataset consists of five different sets (denoted A–E), each containing 100 single-channel EEG signals of 23.6 s. Sets A and B were acquired from the scalp electrodes from five healthy volunteers with eyes open and closed, respectively using standard 10-20 system. Signals in two sets namely D and C were acquired in seizure-free intervals from five epileptic patients in the epileptogenic zone and from the hippocampal formation of the opposite hemisphere of the brain respectively. Set E contains the ictal activity. Sets C, D, and E were recorded using the special electrodes implanted in the brain. For this study, the intracranial signals recorded from seizure free intervals (D) and during seizures (E) are considered for the analysis. Figure 1 shows the examples of iEEG signals of set D and E is presented below.

Figure 1: Examples of iEEG signals recorded during (a) non-seizure and (b) seizure period.
Empirical mode decomposition
The empirical mode decomposition method is a data adaptive and data-dependent method. This method does not require any assumption about the stationarity and linearity of the signals. Therefore, this method is a better choice for the analysis of non-stationary and nonlinear signals such as EEG. The main objective of the EMD technique is to decompose the nonlinear and non-stationary signal x(t) into a sum of intrinsic mode functions (IMFs). Each IMF satisfies two basic conditions namely, the number of extrema and the number of zero crossings must be the same or differ at most by one and the mean value of the envelope defined by the local maxima and the envelope defined by the local minima is zero at any point [21,22].
The necessary steps associated with the EMD algorithms is given below
Detect the extrema (maxima and minima) of the signal x(t)
Compute the upper and lower envelopes em(t) and ei(t) respectively, by connecting the maxima and minima separately with cubic spline interpolation
Determine the local mean as 
Extract the detail 
Decide whether h1(t) is an IMF or not by checking the two basic conditions as described above
Repeat the first four steps and end when an IMF h1(t) is obtained.
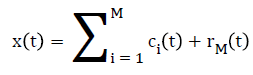
Once the first IMF is derived, define c1(t)=h1(t) which is the smallest temporal scale in x(t). To determine the the rest of the IMFs, generate the residue r1(t)=x(t)-c1(t), the residue can be treated as the new signal and repeat the above illustrated process until the final residue is a constant or a function from which no more IMFs can be derived. At the end of the decomposition [22], the original signal x(t) is represented as where M is the number of IMFs, ci(t) is the ith IMF, and rM(t) is the final residue.
Approximate entropy (ApEn)
Approximate entropy quantifies the regularity or predictability of a time series. Unlike Shannon’s entropy, ApEn accounts the temporal order of points in a time sequence and therefor it is considered as a measure of randomness [23].
The necessary steps involved in the computation of ApEn are provided below;
For a time series of length  dimension
vector is formed as
dimension
vector is formed as


For every  distance
  of from
  is defined
as
is defined
as

For each vector Xmi, a measure that describes the similarity
between the vector Xmi and the other vector Xmj can be constructed as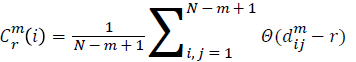
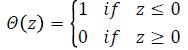
Where, is a Heaviside function and is given by
The symbol r in equation represents a predetermined tolerance value, defined as
r=k*std(x)
Where, k is a constant (k>0) and std(.) is a standard deviation of time series.
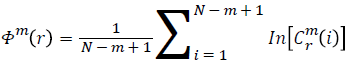
Function Φm(r) is defined as
Repeat the previous steps (1-4) to compute m+1
The approximate entropy is computed using the following
formula 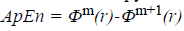
Results and Discussion
Figures 2 and 3 show the IMFs of the non-seizure and seizure signals shown in Figure 1. It is seen that signal of non-seizure state have 12 IMFs whereas 10 IMFs are found in the case of seizure state. Similar results are also observed for other signals. The higher number of IMFs in non-seizure state is due to the more non-stationary and nonlinearity of iEEG signals. Further, it can be seen that the first IMFs are always highest frequency components and the last IMFs are the lowest frequency variations. Also, the sudden and abrupt fluctuations are seen in the IMF1 of non-seizure state in comparison with the seizure state.

Figure 2: Intrinsic mode functions of 23.6 seconds non-seizure iEEG signal.

Figure 3: Intrinsic mode functions of 23.6 seconds seizure iEEG signal.
The ApEn extracted from the IMFs of iEEG signals associated with non-seizure and seizure state is presented in Figure 4. It is observed that the ApEn values are higher for non-seizure in comparison with the seizure state. This higher value of ApEn indicates higher complexity of signals. In general, the complexity is expected to be lower for the signals that are more regular, periodic, stationary and predictable. Higher complexity corresponds to random, irregular and unpredictable signals. The more random and irregular property may be associated with the asynchronous neuronal firings of brain in non-seizure period. The lower complexity observed in ictal period is due to the seizure onset patterns such as high amplitude periodic spikes, spike and wave activity and burst of high amplitude polyspikes. Further, among different IMFs, the ApEn is found to be higher in IMF1. It is attributed to the presence of high frequency components in IMF1. It is seen that ApEn values are gradually reduces with the number of IMFs being higher in IMF1 and lower in the last IMF.

Figure 4: Comparion of ApEn values, extracted from IMFs under non-seizure and seizure state; (a) IMF1, (b) IMF2, (c) IMF3, (d) IMF4, (e) IMF 5, and (f) IMF 6.
In this study, the ApEn of the first eight IMF is compared for the differentiation of non-seizure and seizure signals. The mean ApEn of first IMF is found to be 0.6 in normal state of epileptic brain and is reduced by 73% in the case of seizure. Large overlaps are seen in the ApEns of first three IMFs. Further, these values are more scattered in comparison with other IMFs. The standard deviation of first three IMFs are found to be 0.2, 0.14 and 0.1 respectively, and these values are higher. The percentage difference of ApEn is observed to be 78%, 129%, 165%, 95% for IMF2, IMF3, IMF4 and IMF5 respectively. From the six IMFs shown, the maximum value of ApEn (0.80) is found to be in IMF1 and the minimum value (0.0002) is seen in IMF2.Very small difference is observed in the ApEn values of IMF7 and IMF8.
A t-test is performed on the ApEn values of different IMFs to determine the significance of difference in non-seizure and seizure class. ApEn values of all IMFs except IMF7 and IMF8 is found to be extremely statistically significant (p<0.0001). IMF7 and IMF8 are observed to be statistically significant with the probability value of less than 0.01. From the results based on percentage difference and the significance test, IMF3 and IMF4 appears to be perform better in the differentiation of nonseizure and seizure class. The primary characteristics of epilepsy are recurrent seizures. The pathological reasons for these seizures are due to the sudden development of synchronous neurnonal firing in the cerebral cortex. This divine disease is one of the most common disorders of the nervous system. It is estimated that about 33% of epilepsy patients have seizures that are not controlled by anti-convulsant medicine. Therefore, seizure analyses for the differentiation of non-seizure and seizure class enable implantable devices to intervene at right time to treat epilepsy [24]. The nonstationary-nonlinear feature, ApEn based on IMF4 may be useful for the separation of non-seizure and seizure class.
Conclusion
In this study, empirical mode decomposition based approximate entropy is proposed to differentiate the intracranial EEG signals under non-seizure and seizure class. For this purpose, 100 segments of non-seizure signals and 100 segments of seizure signals are chosen from the standard publicly available database of University of Bonn, Germany. These signals subjected to empirical mode decomposition and approximate entropy for further analysis. The result shows that the complexity is higher in non-seizure class indicating these signals are higher non-stationary and nonlinear. Further, the IMF4 based ApEn is found to give highest percentage difference between the considered two classes. Also, the ApEn values based on all IMFs except IMF7 and IMF8 is observed to be highly statistically significant. From this analysis and results, it appears that IMF4 based ApEn could be used for the seizure prediction applications.
References
- Hsu KC, Yu SN. Detection of seizures in EEG using subband nonlinear parameters and genetic algorithm. Comput Biol Med 2010; 40: 823-830.
- Ghaderyan P, Abbasi A, Sedaaghi MH. An efficient seizure prediction method using KNN-based undersampling and linear frequency measures. J Neurosci Methods 2014; 232: 134-142.
- Acharya U, Sree S, Chattopadhyay S. Application of recurrence quantification analysis for the automated identification of epileptic EEG signals. Int J Neural Syst 2011; 21: 199-211.
- Guo L, Rivero D, Dorado J, Rabuñal JR, Pazos A. Automatic epileptic seizure detection in EEGs based on line length feature and artificial neural networks. J Neurosci Methods 2010; 191: 101-109.
- Esteller R, Echauz J, Tcheng T, Litt B, Pless B. Line length: an efficient feature for seizure onset detection. IEEE Eng Med Biol Soc 2001; 3: 1707-1710.
- Van Putten MJAM, Kind T, Visser F, Lagerburg V. Detecting temporal lobe seizures from scalp EEG recordings: A comparison of various features. Clin Neurophysiol 205; 116: 2480-2489.
- Greene BR, Faul S, Marnane WP, Lightbody G, Korotchikova I, Boylan GB. A comparison of quantitative EEG features for neonatal seizure detection. Clin Neurophysiol 2008; 119: 1248-1261.
- Faul S, Boylan G, Connolly S, Marnane L, Lightbody G. An evaluation of automated neonatal seizure detection methods. Clin Neurophysiol 2005; 116: 1533-1541.
- Kiymik MK, Güler I, Dizibüyük A, Akin M. Comparison of STFT and wavelet transform methods in determining epileptic seizure activity in EEG signals for real-time application. Comput Biol Med 2005; 35: 603-616.
- Tzallas AT, Tsipouras MG, Fotiadis DI. The use of time-frequency distributions for epileptic seizure detection in EEG recordings. IEEE Eng Med Biol Soc 2007.
- Boashash B, Ouelha S. Automatic signal abnormality detection using time-frequency features and machine learning: A newborn EEG seizure case study. Knowledge-Based Syst 2016; 106: 38-50.
- Ahammad N, Fathima T, Joseph P. Detection of epileptic seizure event and onset using EEG. Biomed Res Int 2014.
- Faust O, Acharya UR, Adeli H, Adeli A. Wavelet-based EEG processing for computer-aided seizure detection and epilepsy diagnosis. Seizure 2015; 26: 56-64.
- Ocak H. Automatic detection of epileptic seizures in EEG using discrete wavelet transform and approximate entropy. Expert Syst Appl 2009; 36: 2027-2036.
- Oweis RJ, Abdulhay EW. Seizure classification in EEG signals utilizing Hilbert-Huang transform. Biomed Eng Online 2011; 10: 38.
- Natarajan K, Acharya R, Alias F, Tiboleng T, Puthusserypady SK. Nonlinear analysis of EEG signals at different mental states. Biomed Eng Online 2004; 3: 7.
- Pachori RB. Discrimination between Ictal and Seizure-Free EEG Signals Using Empirical Mode Decomposition. Res Lett Commun 2008; 2008: 1-5.
- Bajaj V, Pachori RB. Epileptic seizure detection based on the instantaneous area of analytic intrinsic mode functions of EEG signals. Biomed Eng Lett 2013; 3: 17-21.
- Orosco L, Laciar E, Correa AG, Torres A, Graffigna JP. An epileptic seizures detection algorithm based on the empirical mode decomposition of EEG. IEEE Eng Med Biol Soc Conf 2009.
- Andrzejak RG, Lehnertz K, Mormann F, Rieke C, David P, Elger CE. Indications of nonlinear deterministic and finite-dimensional structures in time series of brain electrical activity: dependence on recording region and brain state. Phys Rev E Stat Nonlin Soft Matter Phys 2001; 64: 61907.
- Flandrin P, Rilling G, Goncalves P. Empirical Mode Decomposition as a Filter Bank. IEEE Signal Process Lett 2004; 11: 112-114.
- Bajaj V, Pachori RB. Classification of seizure and non-seizure EEG signals using empirical mode decomposition. IEEE Trans Inf Technol Biomed 2012; 16: 1135-1142.
- Pincus S. Approximate entropy (ApEn) as a complexity measure. Chaos 5: 110-117.
- Iasemidis LD. Epileptic seizure prediction and control. IEEE Trans Biomed Eng 50: 549-558.