Research Article - Biomedical Research (2017) Volume 28, Issue 7
Analysis of different types of entropy measures for breast cancer diagnosis using ensemble classification
Chithra Devi M1* and Audithan S2
1Research Scholar, Research and Development Centre, Bharathiar University, Coimbatore, India
2Professor, Department of Computer Science, PRIST University, Tamil Nadu, India
- *Corresponding Author:
- Chithra Devi
Research Scholar
Research and Development Centre
Bharathiar University, India
Accepted on December 12, 2016
Abstract
Breast cancer is a serious problem and common form of cancer diagnosed in the woman. Computer Aided Diagnosis (CAD) is a tool which can assist the radiologists in the detection of abnormalities in medical images. In this study, a CAD system for breast cancer using X-ray mammography is presented with a high level of sensitivity by wavelet entropy features. Discrete Wavelet Transform (DWT) of a digital mammogram provides a multi-resolution representation of it. The characteristics of a mammogram at different resolution levels are represented by computing wavelet entropy and used as features for the corresponding mammogram. Then, ensemble classification using K-Nearest Neighbors (KNN), Bayes, and Support Vector Machine (SVM) is employed to classify the abnormalities as benign/ malignant. The experiments show promising results with the high level of sensitivity and hence it is feasible for mammogram classification.
Keywords
Breast cancer, Digital mammogram, Wavelets, Entropy, Ensemble classification.
Introduction
Recently, the incidence and mortality due to breast cancer increase day to day. The world cancer research fund international [1] estimates that the cancer cases in 2030 will be increased from 12.7 million of 2008 to 21 million. Denmark is the place where maximum cancer cases were found. The higher mortality rate due to breast cancer is more in the old age people [2]. In India, 0.537 million women and 0.477 million males were diagnosed with breast cancer in 2012 [3]. Also, the metropolitan cities women are having higher chances of cancer incidence than other cities. The two most important abnormalities are microcalcifications and masses. Breast cancer screening using digital X-ray mammography allows the detection of microcalcifications and masses at the earliest and also it is the best and cheapest screening among other techniques.
The texture property of microcalcification clusters on mammograms for breast cancer diagnosis is explained in [4]. Initially, images are pre-processed using a wavelet-based spatially adaptive method and then wavelet and texture features are extracted. The extracted feature sets are compared using their ability in discriminating malignant from benign using a probabilistic neural network classifier. Content-based mammogram image retrieval for microcalcification is introduced in [5]. SVM classifier is adopted for classification using twelve sets of features extracted from clustered microcalcification clusters.
Microcalcification detection based on SVM in the digital mammogram is discussed [6]. SVM is trained through supervised learning algorithm in order to classify each location in the image into whether microcalcification is present or not. The classification of microcalcification using non-subsampled contourlet transform is discussed in [7]. The feature vector is obtained by performing normalization on the decomposed subimages followed by energy computation. SVM classifier is designed for classification in two stages.
The machine learning methods; kernel Fisher discriminant, relevance vector machine, and SVM are considered for malignant and benign classification of clustered microcalcifications in [8]. For mammogram classification, KNN classifier is employed using wavelet basis features in [9]. The filters in Daubechies family; db4, db8, and db16 are used for 2D wavelet decomposition. The lower sub-image coefficients are considered alone as a feature vector. Digital mammograms are classified into benign and malignant classes based on Trace transform functional in [10]. They are a generalization of Radon transform where it calculates functional of the image along lines tracing through its pixels.
Texture and gradients features are evaluated using gray level co-occurrence matrices for breast mass classification as benign or malignant in [11]. The classification is done by posterior probabilities computed from Mahalanobis distances. Edge based threshold operator strategy for the mass segmentation is discussed [12]. After segmentation, twelve features are extracted, and the classification is performed using an artificial neural network.
A statistical approach using wavelet and curvelet feature extraction is implemented in [13]. The statistical t-test is employed on wavelet and curvelet coefficients and ranked according to its capability to differentiate the classes. SVM classifier is used to classify the mammogram image into normal, benign and malignant. Naive Bayes classifier allows assigning the probability of being malignant or of being benign to each detected mass, starting from the values of the ranked features [14]. It includes segmentation, feature extraction, selection of features and then classification.
In this paper, different wavelet entropy features are analysed based on mammography for diagnosing breast cancer. DWT is employed to extract the entropy features which lead to classify the suspicious region into benign/malignant. The salient feature of the proposed approach is the combination of three entropy features for breast cancer diagnosis. Also, ensemble classification is designed which increases the accuracy of the system using the well-known classifiers; KNN, Bayes, and SVM. This paper is organized as follows: Section two gives the materials and methods for the classification of the suspicious region in the mammogram. Experimental results are discussed in Section 3. The final section presents the concluding remarks.
Materials and Methods
The materials and methods considered for breast cancer diagnosis using different wavelet entropy features are discussed in this section. The scheme used for mammogram classification using three wavelet entropy features is shown in Figure 1.

Figure 1: The scheme used for mammogram classification.
Database
The Mammographic Image Analysis Society (MIAS) provides a mammogram database which consists of 322 Mediolateral oblique mammograms (161 pairs) with ground truth data for each one [15]. It is freely downloadable [16]. Images are characterized according to density, class of abnormality, and the severity of the abnormality present. There are 112 dense, 104 glandular, and 106 fatty images. Among these images, there are 115 suspicious images (64 benign and 51 malignant).
The classes of abnormalities are microcalcifications, circumscribed masses, miscellaneous as ill-defined masses, asymmetry, speculated masses, and architectural distortion.
All images have been scaled to 200 micron resolution and cropped to no larger than 1024 × 1024 pixels and padded with black to no smaller than 1024 × 1024 pixels. The images are saved in eight-bit portable gray map format with pixel ranging from 0 to 255. The reduced size and contrast is roughly at the limit where small calcifications are still able to be resolved. The advantage of having all the images the same shape is that they can all be fed into the same algorithm without having to account for different aspect ratios. A 1024 pixels edge is convenient because it is a power of two, which simplifies the partitioning of images into chunks. 1024 pixels square and one byte per pixel greatly reduces the computation necessary to process each image as they contain only around 1/38th the data of an original image. Figure 2 shows the sample benign and malignant mammogram.

Figure 2: Digital mammogram having suspicious area (a) Benign (b) Malignant.
Information extraction
The general strategy for information or feature extraction is to decompose the given mammogram and then compute statistical measures on them. The input to this stage is the suspicious region in the mammograms. In MIAS database, the center of abnormalities is given for all mammogram having suspicious regions. Initially, the suspicious regions are separated from the whole image using the center of abnormality so that no abnormality is suppressed. The next step is to represent the suspicious region in multi-resolution by DWT at various decomposition levels.
The decomposition of the given signal by DWT is described in terms of their basis functions:
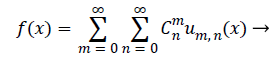 (1)
(1)
Where the 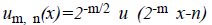 is the translations and
dilation of basis function u (x). The wavelet coefficients can be
computed using a pair of low and high pass filter. A 2D DWT
can be implemented by applying 1D DWTs in two dimensions
separately. The output for 1 level DWT decomposition is
shown in Figure 3a. The analysis filter bank splits a discrete x
(m, n) image into four sub-bands: one coarse scale (LL) and three fine scales (HL, LH, HH). If this analysis filter bank is
iterated on the coarse sub-band, then the spectrum of the
original image is divided by the wavelet as shown in Figure 3b.
The subscript in Figure 3 shows the scale when the sub-bands
are created.
is the translations and
dilation of basis function u (x). The wavelet coefficients can be
computed using a pair of low and high pass filter. A 2D DWT
can be implemented by applying 1D DWTs in two dimensions
separately. The output for 1 level DWT decomposition is
shown in Figure 3a. The analysis filter bank splits a discrete x
(m, n) image into four sub-bands: one coarse scale (LL) and three fine scales (HL, LH, HH). If this analysis filter bank is
iterated on the coarse sub-band, then the spectrum of the
original image is divided by the wavelet as shown in Figure 3b.
The subscript in Figure 3 shows the scale when the sub-bands
are created.

Figure 3: DWT decomposition (a) One level (b) two level.
After the representation, the information extraction stage transforms it into a low dimensional space using statistical calculations on them. For mammogram image analysis, different types of entropy features which provide statistical information about the characteristic of benign and malignant are computed. These parameters are extracted from all the subimages produced by the wavelet decomposition procedure. Table 1 shows the types of entropy analysed for diagnosing breast cancer.
| Types of entropy | Computation |
|---|---|
| Shannon |  |
| Log energy |  |
| Sure entropy [17] |  |
Where Ci is the wavelet coefficients of a particular sub-band i with log (0)=0 and ε is a positive threshold value which is determined using the principle of Steins unbiased risk estimate [18].
Table 1. Types of entropy analysed for diagnosing breast cancer.
Ensemble classification
The most important component of any classification routine is feature vector. The performance of the classification routine is mainly based on the choice of a feature vector. It works by comparing the feature vector of the testing mammograms with the feature vectors in the training database.
The classification of breast abnormalities into one of two groups; benign or malignant is an important practical problem in breast cancer diagnosis. Ensemble classification is attempted using the entropy features generated as a two-class problem (benign/malignant). Three types of classifiers; KNN, Bayes, and SVM are used for ensemble classification. It is tested on MIAS mammograms..
KNN classifier is an instant based learning based algorithm which does not require a training phase. The class of testing sample is obtained by comparing it with the training feature vectors using distance measures. The Bayes classifier works by the assumption that the features are independent of one another. Also, it works well on many types of data. In SVM, the two-class problem is treated as a quadratic problem, and the constructed hyper plane separates the feature set generated into class 1 (benign) or class 2 (malignant). The main advantages of SVM are its fast convergence rate and superior generality in high dimensional data.
Each classifier has its advantages and demerits. To strengthen the classification procedure, all classifier outputs are combined. The weighted voting strategy is applied in this study in order to get the desired output. The weight given to each classifier is based on the accuracy obtained for test samples while using randomly selected training samples.
Results and Discussions
The potential of the wavelet entropy features for breast cancer analysis in discriminating the cancerous mammograms into benign or malignant is evaluated using digitized mammogram database MIAS. Three different wavelet entropy features discussed in the previous section are extracted from the effective image representations by DWT. Three classification algorithms KNN, Bayes, and SVM with radial basis function are used for classification.
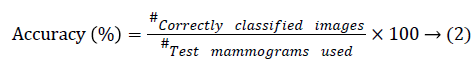
Table 2 shows the classification accuracies obtained by wavelet entropy features for three wavelets at various decomposition levels. The classification accuracy is computed based on the number of correctly classified mammograms into a number of mammograms used for evaluation. It is defined by the following Equation 1.
| Level of decomposition | Classification accuracy (%) | ||
|---|---|---|---|
| db8 | sym8 | bior3.7 | |
| 1 | 80 | 88.696 | 64.348 |
| 2 | 84.348 | 86.087 | 61.739 |
| 3 | 86.957 | 61.739 | 61.739 |
| 4 | 100 | 86.957 | 87.826 |
| 5 | 81.739 | 86.957 | 77.391 |
| 6 | 82.609 | 69.565 | 83.478 |
Table 2. Performance of wavelet entropy features by ensemble classification.
The proposed system uses DWT to decompose the given mammogram which is a multi-resolution analysis. Hence, the mammogram can be represented at various resolutions. However, redundant data will be created at higher resolution usually. The main aim is to find the best decomposition level which would give highest classification accuracy. To investigate this, the resolution levels from 1 to 6 are analysed and it is found that 4th level decomposition using db8 filter gives higher accuracy than other filters.
It is observed from Table 2 that high classification accuracies are obtained for MIAS dataset mammograms. There is no misclassification obtained by the features obtained by db8 filters at 4th level decomposition. Also, the maximum classification accuracy of 88.696% and 87.826% are obtained by sym8 and bior3.7 wavelet filters respectively. Based on the interpretations, for better classification of breast cancer dataset, ensemble classification using 4th level db8 entropy features is chosen.
Further analysis is achieved by computing sensitivity and specificity measures by the wavelet entropy features. These two measures are usually used to test the system performance in a medical domain. The former one regards for positive instances and the later one for negative instances. Table 3 shows the computation of sensitivity and specificity.
| Parameter | Computation |
|---|---|
| Sensitivity | TP/TP+FN |
| Specificity | TN/FP+TN |
Where TP: Malignant mammogram is correctly classified as malignant; FP: Benign mammogram is incorrectly classified as malignant; TN: Benign mammogram is correctly classified as benign; FN: Malignant mammogram is incorrectly classified as benign.
Table 3. Sensitivity and specificity computation.
Figures 4 and 5 show the sensitivity and specificity obtained by using wavelet entropy features.
It is observed from Figures 4 and 5 that the specificity obtained by the entropy features over sensitivity is very high. It indicates that the number of correctly classified negative instances (benign) is over than the positive instances at all decomposition levels. Figure 6 shows the receiver operating characteristics for wavelet filters db8, sym8, and bior3.7 with the parameters of their maximum individual classification accuracy.

Figure 4: Sensitivity obtained by using wavelet entropy features.

Figure 5: Specificity obtained by using wavelet entropy features.

Figure 6: Receiver operating characteristics.
The results show the capability of the wavelet entropy features for breast cancer diagnosis. The highest classification results indicate its potential applications in CAD systems. From the analysed results, it is concluded that wavelet entropy features extracted at the 4th level of decomposition using db8 wavelet filter produce higher classification accuracy, and no misclassification is occurred during evaluation.
Conclusion
In this study, different wavelet entropy features are analysed for breast cancer diagnosis using digitized mammograms in the MIAS database. Firstly, the mammogram is decomposed by DWT using db8, sym8, and bior3.7 filters and then the wavelet entropy features are extracted from various level of decomposition (1-6) independently. Finally, ensemble classification using KNN, Bayes, and SVM classifiers is used for the classification separately to analyse the performance of each entropy features. The highest sensitivity of 100% obtained by the wavelet entropy features of db8 filters at 4th level for decomposition could be used with other CAD systems to increase the diagnosis accuracy.
References
- World Cancer Research Fund International: http://www.wcrf.org/cancer_statistics.
- Marimuthu P. Projection of cancer incidence in five cities and cancer mortality in India. Indian J Cancer 2008; 45: 4-7.
- Raj P, Muthulekshmi M. Review of cancer statistics in India. Int J Adv Sig Imag Sci 2015; 11-14.
- Karahaliou AN, Boniatis IS, Skiadopoulos SG, Sakellaropoulos FN, Arikidis NS, Likaki EA, Panayiotakis GS, Costaridou LI. Breast cancer diagnosis: analysing texture of tissue surrounding microcalcifications. IEEE Trans Inform Technol Biomed 2008; 12: 731-738.
- Wei L, Yang Y, Nishikawa RM. Microcalcification classification assisted by content-based image retrieval for breast cancer diagnosis. Patt Recogn 2009; 42: 1126-1132.
- El-Naqa I, Yang Y, Wernick MN, Galatsanos NP, Nishikawa RM. A support vector machine approach for detection of microcalcifications. IEEE Trans Med Imaging 2002; 21: 1552-1563.
- Jasmine JL, Baskaran S, Govardhan A. Non-subsampled contourlet transform based classification of microcalcification in digital mammograms. Procedia Engineering 2012; 38: 622-631.
- Wei L, Yang Y, Nishikawa RM, Jiang Y. A study on several machine-learning methods for classification of malignant and benign clustered microcalcifications. IEEE Trans Med Imag 2005; 24: 371-380.
- Rashed EA, Ismail IA, Zaki SI. Multiresolution mammogram analysis in multilevel decomposition. Patt Recogn Lett 2007; 28: 286-292.
- Ganesan K, Acharya UR, Chua CK, Lim CM, Abraham KT. One-class classification of mammograms using trace transform functional. IEEE Trans Instrument Measur 2014; 63: 304-311.
- Mudigonda NR, Rangayyan RM, Desautels JE. Gradient and texture analysis for the classification of mammographic masses. IEEE Trans Med Imaging 2000; 19: 1032-1043.
- Cascio D, Fauci F, Magro R, Raso G, Bellotti R, De Carlo F, Tangaro S, De Nunzio G, Quarta M, Forni G, Lauria A. Mammogram segmentation by contour searching and mass lesions classification with neural network. IEEE Trans Nucl Sci 2006; 53: 2827-2833.
- Eltoukhy MM, Faye I, Samir BB. A statistical based feature extraction method for breast cancer diagnosis in digital mammogram using multiresolution representation. Comp Biol Med 2012; 42: 123-128.
- Mencattini A, Salmeri M, Rabottino G, Salicone S. Metrological characterization of a CADx system for the classification of breast masses in mammograms. IEEE Trans Instrument Measur 2010; 59: 2792-2799.
- Suckling J, Parker J, Dance D, Astley S, Hutt I, Boggis C, Ricketts I, Stamatakis E, Cerneaz N, Kok S, Taylor P. The mammographic image analysis society digital mammogram database. InExerpta Medica International Congress Series 1994; 1069: 375-378.
- Ibrahim N, Fujita H, Hara T, Endo T. Automated detection of clustered microcalcifications on mammograms: CAD system application to MIAS database. Phys Med Biol 1997; 42: 2577-2589.
- Avci D. An expert system for speaker identification using adaptive wavelet sure entropy. Exp Sys Appl 2009; 36: 6295-6300.
- Donoho DL, Johnstone IM. Adapting to unknown smoothness via wavelet shrinkage. J Am Stat Assoc 1995; 90: 1200-1224.