Research Article - Biomedical Research (2016) Computational Life Sciences and Smarter Technological Advancement
AIEFS and HEC based emotion estimation using physiological measurements for the children with autism spectrum disorder
K Kiruba1* and D Sharmila21Department of Electronics and Communication Engineering, K.S.R. College of Engineering, Tiruchengode, Tamil Nadu, India
2Department of Electronics and Insturmentation Engineering Bannari Amman Institute of Technology, Sathyamangalam, Tamil Nadu, India
- *Corresponding Author:
- K Kiruba
Department of Electronics and Communication Engineering
K.S.R. College of Engineering
India
Accepted date: August 23, 2016
Abstract
The emotion of the children with Autism Spectrum Disorder (ASD) cannot be identified and recognized easily. The research in automated emotion recognition methods is steadily growing thrust in the last few years due to applicability in various domains which would benefit from a clear understanding of human emotional states. The studies have shown that a human’s physiological parameters are directly related to his/her psychological reaction from which the emotions can be estimated. There is a strong relationship between human emotion and physiological signals. The major aim of this work is to identify preferable Artificial Intelligent Ensemble Feature Selection (AIEFS) framework and Heterogeneous Ensemble Classification (HEC) model for such a concept. The experiment was necessary to achieve the uniformity in the various aspects of emotion elicitation, data processing, feature selection using EFS, and estimation evaluation using HEC and in order to avoid inconsistency problems. Here, three base classifiers such as Support Vector Regression with Genetic Algorithm (SVR-GA), Multinomial NaiveBayes (MNB) and Ensemble Online Sequential Extreme Learning Machine (EOS-ELM) that learn different aspects of the emotion dataset samples are used together to make collective decisions in order to enhance performance of health-related message classification. The results indicate that the combination of AIEFS with HEC exhibited the highest accuracy in discrete emotion classification based on physiological features calculated from the parameters like ECG, respiration, skin conductance and skin temperature. Specific discrete emotions were targeted with stimuli from the IAPS database. This work presents experiment based comparative study of four feature selection methods and five machine learning methods commonly used for emotion estimation based on physiological signals.
Keywords
Emotion estimation, Feature reduction, Machine learning, Artificial intelligent ensemble feature selection, Heterogeneous ensemble classification, Support vector regression with genetic algorithm, Multinomial naïve bayes, Ensemble online sequential extreme learning machine, Mean based weighted for quaternions firefly algorithm, Modified trapezoidal fuzzy membership genetic algorithm.
Introduction
Facial expressions convey the feelings and state of mind of others and enable us to adjust the behavior and to react appropriately. Therefore, the ability to interpret facial expressions accurately and to derive socially relevant information from them is considered a fundamental requirement for typical reciprocal social interactions and communication. Autism spectrum disorder is a serious neurodevelopmental disorder that weakens child's ability to communicate with others. It also includes repetitive behaviors, interests and activities. Generally it is difficult to analyze the emotions of the children with autism. At the same time, emotion recognition using facial expressions is difficult with the autistic children because they donot prefer eye to eye contact and the difficulties in recognizing, identifying, and understanding the meaning of emotions are often considered as one of the trademarks of their social problems. Different procedures have been used to examine emotion processing abilities in children and adults with ASD, with or without intellectual disability: sorting, (cross-modal) matching, and labeling tasks (for a literature review and a meta-analysis on this topic, see [1], resp.). Each of these procedures has revealed problems with affect processing in individuals with ASD. Other studies, however, failed to find atypical emotion recognition skills in individuals with ASD (e.g., [2]). Inconsistencies may be due to differences in sample and participants’ characteristics, task demands [3], and stimuli. Performances of individuals with ASD seem to be especially impaired for negative, more subtle, or more complex emotions or expressions embedded in a social context [4].
In the last few years the research in automated emotion recognition methods is steadily growing momentum due to applicability in various domains which would benefit from an accurate understanding of human emotional states, like entertainment, ASD ,safe driving, training and e-learning, telemedicine and home robotics [5,6]. Furthermore, various mental health applications may benefit from automated estimation of patient's emotions, like treatment of stress-related disorders [7]. Psychophysiology attempts to achieve human emotions by study of the interrelationships between the physiological and psychological aspects of behavior. Physiological affect in general refers to responses that come from the body, more especially those associated with autonomic nervous systems in the body. The various types of physiological signal that can be obtained from the human body by using the sensors those are wearable. The principal level of focus of on the physiology is at the level of organs and the systems.
Physiological parameters like heart rate, skin conductance, temperature and respiration rate can be used to analyse the emotions of the human beings because these variables respond to signals from the nervous system, which is not under conscious control. For a variety of these applications, individually adjusted emotion estimators rather than generic emotion estimation may achieve higher accuracy [8], particularly if the estimator can learn emotional response idiosyncrasies of a particular individual over the course of multiple sessions. Such personalized adaptive emotion estimator system should perform real-time estimation of user's emotion and con-currently adapt itself over time based on the measured user's responses. The aim of the study was to examine the differences of boredom, pain, and surprise. In addition to that, it was conducted to propose approaches for emotion recognition based on physiological signals. Three emotions, boredom, pain, and surprise, are induced through the presentation of emotional stimuli and Electrocardiography (ECG), Electrodermal Activity (EDA), Skin Temperature (SKT), and photoplethysmography (PPG) as physiological signals are measured to collect a dataset from different participants when experiencing the emotions. The Discriminant Function Analysis (DFA) as a statistical method [9] and five machine learning algorithms such as Linear Discriminant Analysis (LDA), Classification And Regression Trees (CART), Self-Organizing Map (SOM), Naïve Bayes algorithm, and Support Vector Machine (SVM) are used for classifying the emotions. The highest recognition accuracy of 84.7 % is obtained by using DFA.
Most literature about emotions claims that the emotions have a complex nature. Even though several feature reduction and machine learning methods have been so far successfully employed in the previous research to build emotional state estimators from physiological indices, a comparison of various methods used by different research groups, has been precluded due to the following reasons:
• Emotion elicitation method diversity.
• Emotional state representation method - discrete emotions or dimensional (valence-arousal) space.
• Properties of used physiological signals and features.
• Referent emotional state selection-subjective ratings or stimuli annotations.
• Estimator evaluation method.
With these issues, finding a common ground for comparing methods and analyzing their features is demanding. Therefore, this paper uses appropriate dataset to compare accuracy, execution and learning times of four feature selection and five machine learning methods commonly employed in emotion estimation based on physiological features. In the comparative analysis, each feature selection method is paired with every listed machine learning method. Finally the results are evaluated using those machine learning classifiers.
Literature Survey
Data mining methods have been proposed in the literature to solve these problems which is discussed as follows. Wagner et al. [10] discussed the most important stages of a fully implemented emotion recognition system including data analysis and classification. For collecting physiological signals in different affective states, a music induction method were used which elicits natural emotional reactions from the subject. Four-channel biosensors were used to obtain electromyogram, electrocardiogram, and skin conductivity and respiration changes from which the emotion were estimated. Then several feature selection/reduction methods were tested to extract a new feature set consisting of the most significant features for improving classification performance. Three well-known classifiers, linear discriminant function, k-nearest neighbor and multilayer perceptron, were used to perform supervised classification. An advantage of this method is that most people are used to listen to music during other activities and for this reason tend to associate different moods with specific songs.
Kim [11] collected a physiological data set from multiple subjects over many weeks and used a musical induction method that spontaneously lead subjects to real emotional states, without any deliberate laboratory setting. Four-channel biosensors were used to measure electromyogram, electrocardiogram, skin conductivity, and respiration changes. A wide range of physiological features from various analysis domains, including time/frequency, entropy, geometric analysis, subband spectra, multiscale entropy, etc., was proposed in order to find the best emotion-relevant features and to correlate them with emotional states. The best features extracted were specified in detail and their effectiveness was proved by classification results. Classification of four musical emotions (positive/high arousal, negative/high arousal, negative/low arousal, and positive/low arousal) was performed by using an extended linear discriminant analysis (pLDA). Furthermore, by exploiting a dichotomic property of the 2D emotion model, we develop a novel scheme of emotion-specific multilevel dichotomous classification (EMDC) and compare its performance with direct multiclass classification using the pLDA.
Biosignals can reveal the emotions and, as such, can serve as an advanced Man-Machine Interface (MMI) for empathic consumer products. However, such a MMI requires the correct classification of biosignals to emotion classes. A state-of-theart review is presented on automatic emotion classification [12]. Moreover, guidelines werepresented for affective MMI. Subsequently, a research was presented that explores the use of EDA and three facial EMG signals to determine neutral, positive, negative, and mixed emotions, using recordings of 21 people. A range of techniques is tested, which resulted in a generic framework for automated emotion classification with up to 61.31% correct classification of the four emotion classes, without the need of personal profiles.
Integrated system was proposed in [13] which provide an innovative and intelligent solution for the monitoring of patients with anxiety disorders during therapeutic sessions. It recognizes an individual's affective state based on 5 predefined classes such as relaxed, neutral, startled, apprehensive and very apprehensive, from physiological data collected via non-invasive technologies such as blood volume pulse, heart rate, galvanic skin response and respiration. The system was validated using data obtained through an emotion elicitation experiment based on the International Affective Picture System. Four different classification algorithms such as Artificial Neural Networks (ANNs), Support Vector Machines (SVM), Random Forests (RF) and a Neuro-Fuzzy System were implemented. The overall classification accuracy achieved was 84.3%.
Park et al. [14] suggested an optimal algorithm for emotion classification which classifies seven different emotional states such as happiness, sadness, anger, fear, disgust, surprise, and stress using physiological features. Skin temperature, photoplethysmograph, electrodermalactivity and electrocardiogram were recorded and analyzed as physiological signals. For classification problems of the seven emotions, the design involves two main phases. At the first phase, Particle Swarm Optimization selects P % of patterns to be treated as prototypes of seven emotional categories. At the second phase, the PSO is instrumental in the formation of a core set of features that constitute a collection of the most meaningful and highly discriminative elements of the original feature space. The emotion stimuli used to induce a participant’s emotion were evaluated for their suitability and effectiveness. They suggested that the use of the prototype is also justifiable considering that this classification scheme is the simplest that could be envisioned in pattern classification.
In the recent work [15] analyzed various types of physiological signals of a person with respect to the stress developed within him/her. The analysis of stress was done using ECG, EEG and respiratory signals acquired from the automobile drivers who were made to drive on different road conditions to get different levels of stress. As a part of the analysis, two features were extracted from the physiological signals and it shows the changes in the feature with respect to the stress of the driver. From the features that are extracted, stress is classified using SVM classifier. The performance of the networks was tested and compared with other physiological signal and produce better result with high accuracy.
Niu et al. [16] applied novel feature selection method to recognize human emotional state from four physiological signals such as Electrocardiogram (ECG), electromyogram (EMG), Skin Conductance (SC) and Respiration (RSP). The raw training data was collected from four sensors, ECG, EMG, SC, RSP, when a single subject intentionally expressed four different affective states, joy, anger, sadness, pleasure. The total 193 features were extracted for the recognition. A music induction method was used to elicit natural emotional reactions from the subject, after calculating a sufficient amount of features from the raw signals, the genetic algorithm and the K-neighbor methods were tested to extract a new feature set consisting of the most significant features which represents exactly the relevant emotional state for improving classification performance. The numerical results demonstrate that there is significant information in physiological signals for recognizing the affective state. It also turned out that it was much easier to separate emotions along the arousal axis than along the valence axis.
Valenzietal [17] conducted offline computer aided emotion classification experiments using strict experimental controls and analyzed EEG data collected from nine participants using validated film clips to induce four different emotional states such as amused, disgusted, sad and neutral. The classification rate was evaluated using both unsupervised and supervised learning algorithms, in total seven algorithms were tested. The largest classification accuracy was computed by means of Support Vector Machine (SVM) which is a machine learning algorithm. The experimental protocol effectiveness was further supported by very small variance. This small variance is obtained among individual participants classification accuracy. Classification accuracy and rate evaluated on reduced number of electrodes suggested, consistently with psychological constructionist approach that classified human emotions. The experimental protocol therefore appeared to be a key factor to improve the classification outcome by means of data quality improvements.
Kukolja et al. [18] suggested the preferable methods for identifying an experiment-based comparative study of seven feature reduction and seven machine learning methods commonly used for emotion estimation based on physiological signals. The results of the performed experiment indicate that the combination of a Multi-Layer Perceptron (MLP) with Sequential Floating Forward Selection (SFFS) exhibited the highest accuracy in discrete emotion classification based on physiological features calculated from ECG, respiration, skin conductance and skin temperature. In order to identify which methods may be the most suitable for real-time estimate or adaptation, execution and learning times of emotion estimators were also comparatively analyzed. Based on this analysis, minimum Redundancy - Maximum Relevance (mRMR) was identified the fastest approach. In combination with mRMR, highest accuracies were achieved by k-nearest neighbor (kNN) and MLP with negligible difference however, they suggested mRMR+kNN is preferable option for real-time estimator adaptation due to considerably lower combined execution and learning time of kNN versus MLP.
Studies have shown that a human being’s physiological changes are directly related to his/her psychological reaction. A wearable wristband for acquiring physiological signals andan algorithm, using a Support Vector Machine (SVM) classifier [19] that will predict emotional states such as neutral, happy &involvement of children with autism was proposed. The psychological reactions (or emotions) were recognized based on the changes in thebodily parameters (physiological basis) such as the Galvanic Skin Response (GSR) and Heart Rate Variability (HRV). For thispurpose, vital features extracted from the recorded physiologicalsignals were classified into different emotional states usingSVM, which resulted in an overall accuracy of 90 %. This helps the parents and the care takers to understand the emotionalpatterns of the child better.
The portability of the system ensures ease of use and real-time emotion recognition and aid for immediate feedback while communicating with caretakers. Principal Component Analysis (PCA) had been identified as the least complex feature extraction algorithm to be implemented in hardware. To solve this problem a detailed study of the implementation of serial and parallel implementation of PCA in order to identify the most feasible method for realization of a portable emotion detector for autistic children was presented [20].
Methodology
In the recent years, the research in automated emotion recognition methods is steadily growing due to applicability in various domains. For a variety of these applications, individually adjusted emotion estimators rather than generic emotion estimation may achieve higher accuracy [18]. The studies reveal that a human being’s physiological changes are related directly to his/her psychological reaction. There is a strong correlation between human emotion and physiological signals. Using physiological signals, the emotions can be recognized and classified by feature reduction and machine learning algorithms. Emotions such as happiness, sadness, disgust, fear, anger, surprise, and stress are classified. The above emotions are classified using the physiological signals such as skin conductance; skin temperature, ECG, Respiration, blood pressure, blood oxygen saturation etc., The feature reduction provided many insights into affective experience. Here Artificial Intelligent Ensemble Feature Selection (AIEFS) framework is proposed to feature reduction to increase the classification accuracy. To analyze an efficient algorithm in order to recognize emotions, the comparative analysis of Heterogeneous Ensemble Classification (HEC) model is to be performed which classifies the reduced features into several classes. In cooperation with the Department of Psychology at University of Zagreb, Faculty of Humanities and Social Sciences, an emotion elicitation experiment was conducted with the goal of evaluating accuracy, execution and learning times of emotion estimators based on data mining of acquired physiological signals [18].
Dataset collection: Emotion elicitation stimuli: During the experiment design, it was decided that emotion would be elicited with a standardized database of emotionally annotated multimedia. Therefore, the International Affective Picture System (IAPS) database [21,22] was selected as the preferred source of stimuli for the experiment since it is the most widely used and referenced database in the field of emotion elicitation. The IAPS contains more than 1000 static pictures which are emotionally annotated regarding the dimensions of valence, arousal and dominance [18].
In the emotion elicitation experiment the target discrete emotions were sadness, disgust, fear and happiness in addition to neutral. IAPS pictures suitable for elicitation of discrete emotion states were selected based on research in categorizing the dimensional model to normative emotional states [23,24]. Due to the categorization of discrete emotions in these studies, we were aiming at Ekman's basic emotions: happiness, surprise, sadness, anger, disgust and fear. However, although all aforementioned studies categorize negative emotions as Ekman's sadness, anger, disgust and fear, just a few images could be labelled with only anger when taking a closer look at picture labels [25] and multidimensional normative ratings [24]. These findings are consistent with the definition of anger being a combination of appraisals of extreme unpleasantness and high certainty which are difficult to achieve with passive viewing of static pictures [25]. Therefore, five emotions were considered: disgust, sadness, anger, surprise and fear.
To identify the emotions actually elicited, after exposure to each IAPS picture the participant expressed her judgments about the elicited emotions using a written questionnaire. In each session, every participant was exposed to two consecutive sequences separated by a pause of at least 150 s, which was intended to bring the participant back to the neutral state. Each sequence of pictures was designed to specifically elicit one particular emotional state. The targeted emotional states were sadness, disgust, fear and happiness, in addition to the neutral emotional state during the neutral-stimulus period. First eight participants were shown sequences of fear and happiness in the first session, while during the second session they were exposed to sequences of disgust and sadness. Exposure sessions for the remaining six participants were reversed - they were the first exposed to sequences of disgust and sadness, and in the second session they were exposed to fear and happiness sequences. However, one of these participants dropped out after the disgust sequence, so only data from her disgust sequence were included in analysis. Order of stimuli presentation in each sequence was the same for all participants [18].
To counter the physiological signals drift [26] the elicitation protocol always included a neutral stimulus before every emotionally non-neutral stimulus. Therefore, a session began with a 30 s neutral stimulus, a simple blue-green neutral background, to establish participants' baseline response. This particular appearance of the neutral screen was selected based on a study that identified blue-green, i.e. cyan, as a color with the best ratio between elicited positive and negative emotions.
Electrocardiogram (ECG) represents electrical activity of human heart. ECG is composite from 5 waves - P, Q, R, S and T. This signal could be measured by electrodes from human body in typical engagement. Signals from these electrodes are brought to simple electrical circuits with amplifiers and analogue - digital converters. The main problem of digitalized signal is interference with other noisy signals like power supply network 50 Hz frequency and breathing muscle artefacts. These noisy elements have to be removed before the signal is used for next data processing like heart rate frequency detection. Digital filters and signal processing should be designed very effective for next real-time applications in embedded devices. Heart rate frequency is very important health status information. The frequency measurement is used in many medical or sport applications like stress tests or life treating situation prediction. One of possible ways how to get heart rate frequency is compute it from the ECG signal. Heart rate frequency can be detected d from ECG signal by many methods and algorithms. Many algorithms for heart rate detection are based on QRS complex detection [27] and hear rate is computed like distance between QRS complexes. From original and normalized heart rate, skin conductance, respiration rate and skin temperature signals for each stimulation, 288 statistical features were calculated, based on 14 statistical methods: mean, standard deviation, mean of the first derivative, minimum, maximum, difference between maximum and mini-mum, mean of the offset, minimum of the offset, maximum of the offset, difference of means between two consecutive segments, difference of standard deviations between two consecutive segments, difference of means of the first derivative between two consecutive segments, mean of the absolute values of the first differences and mean of the absolute values of the second difference[18].
Skin conductance response features
The skin conductance signal includes two types of electro dermal activity: the DC level component and the distinctive short waveforms. The latter is usually called the Skin Conductance Response (SCR) and is considered to be useful as it signifies a response to internal/external stimuli. The algorithm measures the magnitude and the duration of the rise time. From this information, the following features were calculated: the frequency of occurrence (FREQSCR), the maximum magnitude (SM_MAXSCR), the mean magnitude value (SM_MEANSCR), the first SCR magnitude (SM_FIRSTSCR), the mean duration value (SD_MEANSCR) and the area of the responses (SMnSDSCR). In order to increase robustness, features SM_MAXSCR, SM_ MEANSCR, SM_FIRSTSCR and SMnSDSCRwere also calculated from normalized skin conductance signals using all 7 normalization methods [18].
Heart rate variability features
Heart Rate variability (HRV) is one of the most often used measures for ECG analysis. HRV is a measure of the continuous interplay between sympathetic and parasympathetic influences on heart rate that yields information about autonomic flexibility and thereby represents the capacity for regulated emotional responding [28]. Therefore, HRV analysis is emerging as an objective measure of regulated emotional responding. In the time domain, calculated the following statistical features: the standard deviation of all NN intervals (SDNN), the square root of the mean of the sum of the squares of differences between adjacent NN intervals (RMSSD), standard deviation of differences between adjacent NN intervals (SDSD), the proportion derived by dividing NN50 differing by more than 50 ms, the proportion derived by dividing NN20 differing by more than 20 ms and Fano factor (FF).
Features calculated from respiration signal
Features are also calculated from the raw respiration signal. Here calculated the power mean values of four subbands within following ranges: 0-0.1 Hz, 0.1-0.2 Hz, 0.2-0.3 Hz and 0.3- 0.4 Hz. The power spectral densities of detrended respiration signal were obtained using the Burg algorithm. To increase the robustness of emotion estimation, features were also calculated from detrended respiration signal normalized by dividing with mean peak-to-peak magnitude of respiration signal in baseline. In this way, a total of 8 features from respiration signal were calculated. From the above extracted features dimensionality reduction is performed by using Ensemble Feature Selection (EFS) framework.
From this dataset the above mentioned feature selection is performed using Ensemble Feature Selection (EFS), here EFS combines the methods of Artificial Intelligence methods so it is named as AIEFS framework. Total 368 different physiological features were computed for each stimulus presented to the participant. From this features irrelevant or reduce the dimension of the features using AIEFS framework which is discussed as follows:
Artificial intelligent ensemble feature selection (aiefs) framework: Many of the existing mechanisms for feature selection follow the general principle of supervised learning, be they filter or wrapper based approaches. As such, they work by relying on identified correlations between class or decision labels and the underlying feature values [29]. However, in many real-world applications, the thorough interpretation of a large data may become infeasible and hence, the amount of labelled training samples is often limited. This makes unsupervised feature selection algorithms [30], and semi-unsupervised learning [31] techniques potentially beneficial and desirable [30]. Although the performance of this new development is promising, it merely contributes to the family of FS techniques as yet another single method that produces a single feature subset of features when presented with a training dataset. The performance of such techniques may vary significantly over different problem domains.
Ensemble Feature selection (EFS) is an ensemble-based method that constructs a group of feature subsets, and then produce an aggregated result out of the group. In so doing, the performance variance of obtaining a single result from a single approach can be reduced. It is also intuitively appealing that the combination of multiple subsets may remove less important features, resulting in a compact, robust, and efficient solution. Ensembles of feature ranking techniques have been studied in the literature for the purpose of text classification and software defect prediction; they work by combining the ranking scores or exploring the rank ordering of the features. Additionally, feature redundancy elimination has been achieved by the used of tree-based classifiers ensembles. In this, three steps are carryout to implement the EFS concept these are: 1) building ensembles using optimization search algorithms, 2) generating diversity by partitioning the International Affective Picture System (IAPS) database, and 3) constructing ensembles by mixing various different FS approaches.
In this section, the proposed implementations of the AIEFS framework concept are specified as follows with the aid of illustrative diagram. In the context of AIEFS framework, an IAPS databaseis represented using wherebe the number of samples and are finite, non-empty sets of dataset samples and physiological signalfeatures, respectively.Physiological signals features might be either discrete-valued or real-valued attributes. Here, a Physiological signals feature subset is represented by a binary string FS of length M, if , otherwise. An AIEFS can therefore be represented by a set of such feature strings, where K denotesthe size of the ensemble here K=2. The finally selected physiological signals features subset by the AIEFS framework is the outcome of aggregating the elements of EPSF, which is denoted by hereafter.
By employing multiple FS algorithms, the ensemble diversity can be naturally obtained from the differences in opinions reached by the evaluators themselves. The ensemble construction process may be further randomised by the use of a pseudo random generator, as illustrated in Figure 1, so that the available FS algorithms are randomly selected when forming the ensemble beneficial when the available feature selectors are fewer than the desired number of ensemble components, where certain selectors are expected to be used multiple times. The flowchart for AIEFS framework is given in Figure 1.

Figure 1: Flow chart for AIEFS framework.
Modified trapezoidal fuzzy membership genetic algorithm (MTFGA): Genetic Algorithms (GA) [32] are a class of evolutionary algorithms that use evolution as a source of inspiration to find the solution for many optimization problems. All the possible solutions of the given problem are called the chromosomes. The chromosomes can be considered to be a physiological signal feature vector and each dimension of this physiological signal feature vector can be considered to be a gene. Each generation has a specific number of International Affective Picture System (IAPS) database chromosomes also called as the population. In the traditional GA the size of the population of each generation kept same all the features in the dataset is reduced or irrelevant.
The most important procedure of GA is the fitness function; here the fitness function is determined based on the classification accuracy for selected physiological signals feature. This fitness function is also known as the objective function. Each physiological signal feature (chromosome) from the generation is passed through the fitness function and thus, they get their fitness value. The classification accuracy (fitness value), then determine the proximity of the physiological signal feature from chromosome to the highest classification accuracy value. The physiological signal features from chromosomes with high highest classification accuracy (fitness) values is selected for reproduction. The modes of reproduction are mainly depends on crossover and mutation. Crossover is the interchange of two physiological signal features between the IAPS database and mutation is the random change in the physiological signal features. Mutation is usually done on a comparatively weak physiological signal features from IAPS database, so that it adds diversity to the physiological signal features (population) without actually impeding the progress towards the optimal solution. The chromosomes that have reproduced are replaced by the new physiological signal features, irrespective of the fitness values of the new physiological signal features. This results in the formation of the new physiological signal features generation. The physiological signal features in this generation, which were the offspring of the previous generation, are now the physiological signal features of the next generation. These physiological signal features (chromosomes) are now passed through the highest classification accuracy(fitness function) again and the strongest physiological signal features are selected to reproduce, which results in a new physiological signal features generation, with a new set of physiological signal features (chromosomes) and ideally nearer to the optimal solution with highest classification accuracy.
Operators
The following are the most important GA operators:
The Selection operator selects physiological signal features in the IAPS database (population) for reproduction. The selection function is usually stochastic and designed to select physiological signal features the highest classification accuracy (fitness) of the chromosomes from the IAPS database (population).
The Crossover operator chooses a physiological signal features and exchanges the physiological signal features in the chromosomes before and after the physiological signal features to create new physiological signal features offspring.
The Mutation operator randomly flips the physiological signal features thereby creating a new physiological signal features offspring. Mutation adds diversity to the IAPS database (population).
Elitism
While replacing physiological signal features (chromosomes) from IAPS database in the iteration N to iteration N+1, a physiological signal feature with a fairly good highest classification accuracy value may be replaced by a physiological signal feature with a mediocre or a poor classification accuracy value. Thus, this may result in the selection of optimal physiological signal feature. In elitism, the top physiological signal feature of each generation is classified as elite individuals. These physiological signal features will participate in the reproduction, but will not be replaced by any physiological signal feature from the next generation. This is called Simple Elitism. In Global Elitism, each physiological signal feature from generation N+1 can replace its parent from generation N, if and only if, its performance is found to be superior. The drawback in this case is that, the comparison is still being done only on a physiological signal feature to physiological signal feature basis and not on a generation to generation basis [32].
Dynamic representation of the features
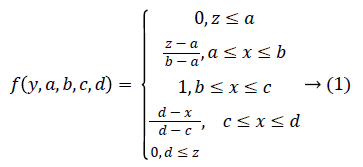
Trapezoidal Fuzzy membership function: Then Trapezoidal Fuzzy membership function is introduced to automatic representation of the physiological signal feature based on the attribute value into equal ranges [0-1]. The trapezoidal curve is a function of a gene expression matrix, Y, and depends on four scalar parameters a, b, c, and d, as given by
Dynamic population size: The basic problem with the traditional GA is the static population size. So the computational complexity drastically increases if out of k physiological signal features (chromosomes), the fitness values of k/2 chromosomes are below par. GAs would consider these physiological signal features (chromosomes) for reproduction using crossover and mutation, thus increasing the time complexity. In the modified GA, a cut-off on the classification accuracy has been considered and every physiological signal feature that has a fitness value less than this cut-off classification accuracy is discarded. If at any point after the cutoff, the number of physiological signal features is greater than the initial population size, the size is reset to initial population size with the less fit physiological signal features being discarded. Thus, in this way the number of physiological signal features at any point will never be greater than the size of the initial population from IAPS database, thus ensuring computational efficiency [32].
Dynamic elitism: The global elitism is either done on a physiological signal feature to physiological signal feature basis or a fixed number of physiological signal features are considered as elite individuals. The current approach that is being used in this Modified Genetic Algorithm (MGA), the number of elite physiological signal features is dynamic, i.e. it is changing from generation to generation. The advantage of this method is that, the life of the physiological signal features is directly proportionality with the fitness [32] (classification accuracy).
Aging factor: A parameter called the age of the physiological signal feature (chromosome) has been introduced. The underlying principle behind the inclusion of this parameter is that, the physiological signal features (chromosomes) that are fit to live on for a large number of generations have already reproduced in the previous generations [32]. Thus, allowing these physiological signal features (chromosomes) to reproduce again will decrease the diversity of the population from IAPS database and hence may cause a premature convergence. Thus, the fitness values of the physiological signal features that are considered for the sake of reproduction are indirectly proportional to the age of the physiological signal features (Figure 2).

Figure 2: Flow chart of a MTFGA.
Mean based weighted for quaternions firefly algorithm
(MWQFA): Firefly Algorithm (FA) as being one of the more
famous representatives of this class of algorithm. Fireflies are
insects, the main characteristic of which is their flashing lights
that can be admired in the summer sky at night. These lights
have two fundamental functions, i.e., to attract mating partners
and to warn off potential predators. The flashing lights’intensity I decreases as the distance r increases according
to the term to formulate the FA [33]. To avoid premature
convergence in FA algorithm introduce a quaternion’s
representation of physiological signal features. In mathematics,
quaternions extend complex numbers. Quaternion algebra is
connected with special physiological signal features of
geometry of the appropriate Euclidian spaces. However, fitness
value is determined not only based on the classification
accuracy, here the fitness value is determined based on the
standard deviation value of the physiological signal features.
The light-intensity I is considered as the fitness value
(classification accuracy) of flashing firefly increases as the
distance between two physiological signal features in the
population (IAPS database) r decreases in terms of IαI/r2.
Additionally, the air absorption causes the light to become
weaker classification accuracy and weaker as the distance from
the physiological signal features in the population (IAPS
database) increases. Here, the light-intensity is proportional to
the fitness function of the problem being optimized (i.e., 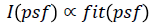 where s=S(psf) represent a candidate
solution[34] . In order to formulate the FA, some flashing
characteristics of fireflies were idealized, as follows:The
MWQFA is based on the original FA, where the representation
of virtual fireflies (physiological signal features) is moved
from a Euclidian space to a quaternion space. In the Euclidian
space, each virtual firefly (physiological signal features) is
represented as D-dimensional real-values physiological signal
features vector psf=(psfi0,…psfin), where
where s=S(psf) represent a candidate
solution[34] . In order to formulate the FA, some flashing
characteristics of fireflies were idealized, as follows:The
MWQFA is based on the original FA, where the representation
of virtual fireflies (physiological signal features) is moved
from a Euclidian space to a quaternion space. In the Euclidian
space, each virtual firefly (physiological signal features) is
represented as D-dimensional real-values physiological signal
features vector psf=(psfi0,…psfin), where  while in
quaternion space as a D-dimensional vector of quaternions
qi={qi0,…qin}, where
while in
quaternion space as a D-dimensional vector of quaternions
qi={qi0,…qin}, where  So the search-process could
be directed towards the more promising areas of the search space.
So the search-process could
be directed towards the more promising areas of the search space.
The MWQFA differs from the original FA by using the quaternion’s representation of physiological signal features. On this quaternion’s representation of physiological signal features, however, the quaternion algebra is applied. Quaternions are formal expressions q=x0+x1i+x2j+x3k, where x0, x1, x2, x3 real values of physiological signal are features and they constitute the algebra over the real numbers generated by basic units i, j, k (also the imaginary part) that satisfy Hamilton’s equations:
ij=k, jk=i, ki=j → (2)
ij=-k, kj=-i, ik=-j → (3)
i2=j2=k2=-1 → (4)
The quaternions  describes a 4-dimensional space over
the real numbers. Using this notation, a pair of quaternions is
denoted as q0=x0+x1i+x2j+x3k and q1=y0+y1i+y2j+y3k. The
quaternion algebra defines the following operations such as
addition and subtraction, scalar multiplication, multiplication,
on quaternions. In addition to pure quaternion algebra, two
unary functions are added as follows: qrand() is a quaternion
defined as
describes a 4-dimensional space over
the real numbers. Using this notation, a pair of quaternions is
denoted as q0=x0+x1i+x2j+x3k and q1=y0+y1i+y2j+y3k. The
quaternion algebra defines the following operations such as
addition and subtraction, scalar multiplication, multiplication,
on quaternions. In addition to pure quaternion algebra, two
unary functions are added as follows: qrand() is a quaternion
defined as
qrand()={xi=N(0,1)|for i=0,…3} → (5)
where N(0,1) denotes a random number drawn from a Gaussian distribution with zero mean and standard deviation one. In other words, each component is initialized with the random generated number. qzero: is a quaternion defined as
qzero()={xi=0|for i=0,…3} → (6)
Where each component of quaternion is initialized with zero. The QFA algorithm acts as follows. The population of quaternions is initialized in InitQFA() using the qrand() function. The solution psfs=(psfs0,…psfsD) in the Euclidian space is obtained from i-th quaternions’ vector qi using the norm function as follows:
psfs=||qij||, for j=1 to D → (7)
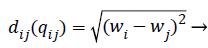
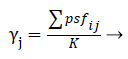
Calculating the distance between the fireflies (physiological signal features) in the search-space is expressed in the modified algorithm based on the weight value of the two features
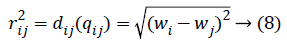
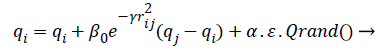
Where qi is the i-th virtual firefly ((physiological signal feature) position, and qj is the j-th virtual firefly (physiological signal feature) position in the search-space. Moving the firefly i to another more attractive firefly j is expressed as follows:
 (9)
(9)
 (10)
(10)
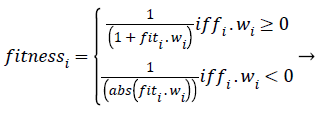
Where r2ij represents the distance between the i-th and j-th fireflies in the quaternion’s space, α is the randomization parameter, ε the scale, and the Qrand() is a random generated quaternion vector. After moving the virtual fireflies (physiological signal features) a verification function is launched. It ensures that the new firefly (physiological signal feature) position is under the prescribed limitations, i.e., lbi ≤ || qi|| ≤ ubi. In this work the fitness value is updated based on the weight values of the physiological signal features, a fitness value (fitmessi) for a physiological signal features selection problem can be assigned to the solution qij by (10).
 (11)
(11)
Where fiti is the classification accuracy. According to the SDWFA declaration, assigned a weight W(psfi) to each attribute psfi. The value of weight W(psfi) for each psfi, which is set to zero initially, is calculated sequentially throughout the whole matrix using the mean value of the attribute and update using the following formula when a new entry ai is met in the discernibility matrix:
wi=w(psfi).μ( psfi) → (12)
When the optimization problem involves more than one objective function is described in equation (11-12), the task is to find more optimal physiological signal features solutions regarding each objective.
Decision support: One of the commonly used approaches for dealing with EFS is majority voting, where the most agreed feature is selected as the final ensemble prediction. Similarly, a majority voting scheme with threshold may be adopted for FSE. Using the notations introduced earlier, for a given ensemble E, the decisions of the ensemble components can be organized in a K × MBoolean decision matrix D, where K is the size of the ensemble, and M is the total number of physiological signal features. In this representation, the horizontal row Di denotes the feature subset fsi, and the binary cell value Dij indicates whether psfi Є fsi.Borrowing the terminology of ensemble EFS, the ensemble agreement j for the physiological signal features psfj can therefore be calculated by:
 (13)
(13)
A agreement threshold , 0<, can then be defined to control the number of physiological signal featuresbeing included in the final result psf*, such that: psf*=1; if j. From this, the common majority vote can be assimilated by setting =0.5. The value α may be adjusted according to the problem at hand, if the amount of agreement is very high, a higher α value can be used to control the size of the resultant feature subset. Alternatively, if a highly diverse FSE is obtained, there may exist no feature with j to combat this, it may be necessary to employ a lowered α value. Finally less error values are selected using intersection operation in mathematical framework.
Heterogeneous ensemble classification (HEC)
To propose and test the efficacy of HEC methods wherein three base classifiers that learn different aspects of the emotion dataset samples with selected physiological signal features are used together to make collective decisions in order to enhance performance of health-related message classification.
Support vector machine (SVM) [35] is a function based classifier built upon the concept of decision planes that define decision boundaries. In this experiment we use the linear kernel SVM with C=1.0. SVM has long been known for superior performance for all examples let us consider in text classification with word features. In this work follows the procedure of the hybrid prediction algorithm comprised of Support vector regression (SVR) and Genetic Algorithm (GA) is proposed for parameter optimization. The SVR models utilize the nonlinear mapping feature to deal with nonlinear regressions. However, general SVR suffers from parameter problem algorithm so, in the proposed method the GA is employed to obtain the SVR parameters accurately and effectively. Which is similar to the previous work [36], here instead of Modified Firefly Algorithm (MFA), GA is used in this research work. Multinomial NaiveBayes (MNB) [37] implements the Naïve Bayes algorithm for multinomially distributed data, and is one of the two classic Naive Bayes variants used where the data is typically represented as physiological signal features vector. McCallum and Nigamcite [31] found Multinomial NaïveBayes to perform better than simple NaiveBayes, especially at larger physiological signal features.
OS-ELM is developed on the basis of Extreme Learning Machine (ELM) [38] that is used for batch learning with emotion classification based on physiological features and has been shown to be extremely high emotion classification performance. Compared to ELM, OS-ELM can learn at a oneby- one with fixed or varying chunk size for emotion dataset samples with selected physiological signal features. The parameters of OS-ELM in the hidden nodes, input weights and biases for additive nodes for RBF nodes are randomly selected and the output weights are analytically determined. OS-ELM is performed based on physiological signal featuresand it is similar to ELM with SLFNs and RBF hidden nodes, expect sequential manner. Consider N arbitrary emotion dataset samples (xi,ti) Є Rn × Rm If a SLFN with L hidden nodes can approximate these N emotion dataset samples with m physiological signal features and equals to zero error, it then implies that there exist bi, ai and bi such that there exists βi, ai and bi such that
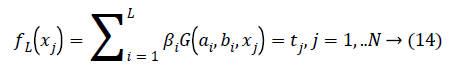
Where bi,ai are the learning parameters of the hidden nodes, bi is the output weight, and G(ai,bi,xj) denotes the output of the ith hidden node with respect to the emotion dataset samples xj. When using additive hidden node,
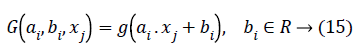
Where ai is the input weight vector, bi is the bias of the ith hidden node, and ai.xj denotes the inner product of the two. When using RBF hidden node,
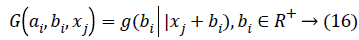
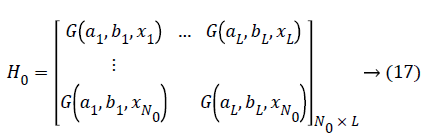
Where ai and bi are the center and impact width of the ith RBF node, and R+, indicates the set of all positive real values. Assume the network has L hidden nodes and the data. There are two phases in OS-ELM algorithm, an initialization phase and a sequential phase. In the initialization phase, rank H0= L is required to ensure that OS-ELM can achieve the same learning performance as ELM, where H0 denotes the hidden output matrix for initialization phase. It means the number of training data required in the initialization phase N0 has to be equal to or greater than L, i.e. N0>L. And if N0=N, OS-ELM is the same as batch ELM. Hence, ELM can be seen as a special case of OS-ELM when all the data present in one iteration.
(a) Randomly assign the input parameters: for additive hidden nodes, parameters are input weights ai and bias bi; for RBF hidden nodes, parameters are center ai and impact factor bi; i=(1,…L).
(b) Calculating the initial hidden layer output matrix H0
Estimating the initial output weight β0, Set k=0. (k: a parameter indicates the number of chunks of data that is presented to the network).
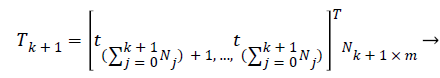
Sequential learning phase: Present the (k+1) th chunk of new observations
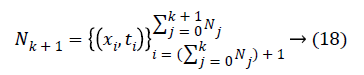
and Nk+1 denotes the number of observation for emotion dataset samples with m physiological signal features in the (k +1) the chunk .Compute the partial hidden layer output matrix Hk+1
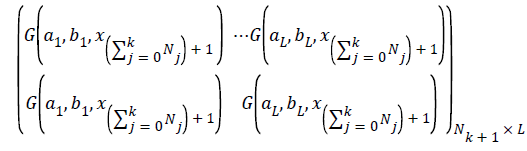
Calculate the output weight β(k+1). Have
 (20)
(20)
Set k=k+1, go to (a) in this sequential learning phase.
Ensemble of EOS-ELM consists of many OS-ELM networks with same number of hidden nodes and same activation function for each hidden node. All EOS-ELMs are trained with new emotion dataset samples with m physiological signal features in each incremental step. The input parameters for each OS-ELM network are randomly generated and the output weights are obtained analytically based on the sequential arrived input emotion dataset samples with m physiological signal features. Then compute the average of the outputs of each OS-ELM network, which is the final output of the EOS-ELM. Assume the output of each OS-ELM network is f(i) (xi),j=1,.P. Hence,
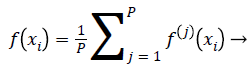 (21)
(21)
Expect that EOS-ELM works better than individual OS-ELM network because the randomly generated parameters make each OS-ELM network in the ensemble distinct. Therefore, the OS-ELM networks composing the ensemble may have different adaptive capacity to the new emotion dataset samples with m physiological signal features. When the emotion dataset samples with m physiological signal features come into the ensemble network sequentially, some of OS-ELM networks may adapt faster and better to the new data than others.
Simulation results in [38] have shown that EOS-ELM is faster than other OS-ELM and produces better generalization performances. When N0=N, EOS-ELM becomes an ensemble of batch ELM networks [39]. Therefore, the ensemble of ELM proposed in [39] can be seen as a special case of EOS-ELM when all the training emotion dataset samples with m physiological signal features are available at one time. Finally all the classification methods are combined into ensemble method by using majority voting. When compared to all classifier ensemble method provides higher classification accuracy which is discussed in the experimentation results.
Experimentation Results
In order to classify discrete emotions based on participants' subjective ratings, every segment of participant's physiology acquired during stimulation was associated with the referent emotional state. During the experiment, each participant gave subjective ratings regarding the emotional state that a particular stimulation elicited in her. She was supposed to give perceived intensity for all discrete emotions, and in many instances co-occurring emotions [40,41] appeared, in which the participant perceived more than one discrete emotion as very intense. Therefore, an algorithm was developed for finding referent emotions that were elicited even in such ambiguous cases. The algorithm resolves the referent emotion based on the intensity of sadness, disgust, fear, happiness and other reported discrete emotions, depending on the intended emotion that a particular stimuli sequence was expected to elicit. By conducting the algorithm over all subjective ratings of the participants, the following numbers of samples for each discrete emotion were obtained: 91 samples of sadness, 95 samples of disgust, 38 samples of fear, 78 samples of happiness, 65 samples of anger, 210 samples that algorithm annotates with “surprise, stress and engagement” such as 85 samples for surprise, 55 samples for stress, and 70 samples for engagement.
To apply the data mining algorithms, MATLAB tool was used. MATLAB is an environment for machine learning, data mining, text mining and business analytics. It is used for research, education, training and industrial applications. In this study, version 2013 of MATLAB is used. All algorithms were used in the default state. In what follows the obtained results and discussions are presented. The experiments are designed so that the different parts of the work could be evaluated. These include the evaluation of the features of the dataset and the feature selection. To this aim, first the features which were selected by the feature selection method and their importance are discussed. Second, all the two possible combinations of the feature selection and classification methods are tested over the dataset. Finally, results techniques are presented in this section. Accuracy, Precision, and Recall are the most important performance measures in the medical field, which are commonly used in the literature. So for measuring the performance of algorithms, these measures are used.
Confusion matrix: A confusion matrix is a table that allows visualization of the performance of an algorithm. In a two class problem (with classes C1 and C2), the matrix has two rows and two columns that specifies the number of False Positives (FP), False Negatives (FN), True Positives (TP), and True Negatives (TN). These measures are defined as follows: TP is the number of samples of class C1 which has been correctly classified. TN is the number of samples of class C2 which has been correctly classified. FN is the number of samples of class C1 which has been falsely classified as C2. FP is the number of samples of class C2 which has been falsely classified as C1. Table 1 shows confusion matrix. In this eight classes are used Sadness, disgust, fear, happiness, anger, surprise, stress and engagement.
| Class | Actual class C1 | Actual class C2 |
|---|---|---|
| Predicted class C1 | True positive (TP) | False positive (FP) |
| Predicted class C2 | False Negative (FN) | True Negative (TN) |
Table 1: Confusion matrix.
Accuracy: Accuracy shows ratio of correctly classified samples to the total number of tested samples. It is defined as:
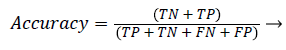 (22)
(22)
Precision and recall: According to confusion matrix, precision and recall are explained as following,
 (23)
(23)
 (24)
(24)
Believe that the choice of evaluation method is an important reason why the best-case accuracies obtained in Table 2 are in the range 55-60%, even though related work analysis has shown the accuracies around 64-89% for classification of a comparable number of distinct emotions. From the table it is concluded that the proposed AIEFS-HEC provides average accuracy results of 91.681 % which is 7.676%, 6.412%, 4.679% and 3.119% high when compared to MLP, SVR-GA, MNB and EOS-ELM methods respecti