- Biomedical Research (2015) Volume 26, Issue 4
A non-invasive computer aided diagnosis of osteoarthritis from digital x-ray images
Subramoniam M1, Barani S1 and Rajini V21Dept. of E & CE,Sathyabama University,Chennai, India
2Dept. of EEE, SSN Engg. College, Chennai,India
Received date: August 03 2015
Abstract
Computer aided method is becoming the popular tool in the diagnosis of various disease. These tools provide an error free and simplistic diagnostic procedure. This paper discusses the computer aided tool developed for the diagnosis of bone disorders caused by Osteoarthritis. The methodology involves the feature extraction from the Region of Interest (ROI) and classification of those features. Haralick feature extraction technique and Support Vector Machine classifier (SVM) with the kernel functions are used for the development of the algorithm. The algorithm is tested with the various combinations of Haralick features and kernel functions.130 digital X-ray images of knee joints are used for testing the developed algorithm. This methodology produced a successful classification rate of 99 percentage in the diagnosis of skeletal disorders caused by Osteoarthritis.
Keywords
Osteoarthritis, Skeletal disorders, Haralick features, Kernel functions, Support Vector Machine classification.
Introduction
The degenerative disorder in bone accompanied by pain, swelling and joint immobility is termed as Arthritis. There are more than 100 varieties of Arthritis and Osteoarthritis (OA) is the most common among them which ruin the human society. The disease cannot be cured, but can be controlled at the early stage with proper diagnosis and medications. But the drawback is, only a limited methodology is available for the diagnosis of the disease. Those diagnostic procedures are either invasive or the analysis are being done manually. Hence the work is focused towards the development of non invasive, computer aided diagnosis for the assessment of skeletal disorders caused by OA at the early stage.
Evanthia et al. [1] proposed an automated method to segment and quantify arthritis from MR images. Various techniques like image preprocessing, identification of number of clusters, segmentation and post processing were involved in this method. Contrast enhanced weighted MRI was used for imaging. 25 subjects were used for evaluation. The specificity and sensitivity produced by this algorithm were 97 % and 83 % respectively.
Bonoatis et al. [2] proposed a method for the assessment of OA from radiographic images. The wavelet coefficients were estimated from the image under analysis. The mean, median and standard deviation were calculated for the wavelet coefficients. The calculated statistical features were classified using Bayes classifier. The accuracy achieved by the algorithm was 91%.
James Connolly et al. [3] developed a tool to measure the joint stiffness in the hands. The tool consists of an array of sensors which are placed over the Metacarpophalangeal (MCP) and Proximal interphalangeal (PIP) joints and the control software. This system helped the therapists to measure the stiffness in bone joints. But early detection of stiffness in the bone joints and the initial calibration of the tool remains the challenging factor.
Lee et al. [4] proposed an automated method for the detection of suspicious pain regions from digital IR images. Survival of fitness kind of evolution strategy was applied on the ROI portions of IR images. Disease such as foot of glycosima, degenerative arthritis and varicose vein were able to diagnose with this method.
Nikola Borojevic et al. [5] proposed a method to diagnose RA and OA from thermographic images. The image obtained from three cases such as normal, control and those affected by arthritis were used for analysis. Statistical parameters like mean, minimum, maximum, standard deviation and variance were applied on the extracted feature from those images. The final results showed a significant difference in temperature between those cases.
Mahendran and Baboo [6] developed an automated method to segment X-ray images. The method used wavelet transform, dilation, erosion and closing operation on the texture features extracted over the region of interest (ROI) on X-ray images. This method provides an enhanced method for segmentation and the overall processing time is reduced by one second than the existing techniques.
Selvarasu et al. [7] conducted a study using thermographs on the normal and the abnormal bone joints. The studies were done by using the Euclidean distance between the pixels on the image. These studies used the temperature variation between the normal and the abnormal joints. Several experiments were conducted to differentiate the abnormality in the bone joints due to arthritis from the fractured structures. The results concluded that the temperature in the bone joints varies with the abnormality. But the extent of abnormality cannot be identified with this method.
Snehalatha et al [8] developed an algorithm to evaluate RA from infra red (IR) images. Heat distribution index was the parameter taken for analysis. 10 normal subjects and 10 abnormal subjects were used to evaluate the algorithm. The observations showed that the heat distribution over the skin is higher for the abnormal subjects than the normal subjects. Moreover the change in the pattern of the bone joints can also be quantified with this method. However this method of diagnosis can be applied for the later stages of the disease.
Syaiful anam et al. [9] proposed a modified level set method for automatic bone boundary detection from hand radiographic images using diffusion filter. The proposed method was evaluated using five radiographic images. Improved performance over the existing method was observed with the obtained results. This method can be extended for the analysis of RA from radiographs.
Tatil.L.Megko [10] developed an automated method for the assessment of osteoarthritis in knee joints from radiographs. The classification of the algorithm was based on KL grades. The mean joint space width calculated from the extracted features was used for classification. This algorithm has produced satisfactory specificity and sensitivity rate. But the algorithm failed to define the extent of abnormality in the JSW.
Huo et al. [11] proposed an automatic joint detection method to diagnose RA from hand radiographs. The various techniques such as masking, midline detection, feature extraction and joint location were applied on hand radiographic images of size 2500 X 2500 pixels. The proposed method could able to detect PIP and MCP joints in fingers. The method was able to detect the change in joint space of 0.1mm also.
In this paper the computer aided diagnosis of OA from digital X-ray images is discussed. The paper is organized as follows. Section 2 describes the type of data used in this work. The methodology of the proposed work is given in section 3. The results are discussed in section 4 and the conclusion part is given in section 5.
Data
The digital X-ray images of the knee joints which are made on the subjects reported to have the symptoms of OA is used for the development of the algorithm. In order to differentiate these abnormal subjects from the normal subjects the digital X-ray images of 10 normal subjects without any symptoms of OA is also taken. The actual size of the image is around 1000 X 1000 pixels. OA results in the reduction of Articular Space (AS) between the bones. Hence the ROI is cropped manually to a size of 200 X 200 over the AS from the actual image. The actual image and the ROI image are shown in Figure 1. a and 1.b respectively. This image preprocessing is done on all the images used for the training and testing.
Kellgren Lawrence (KL) grading system is the generalized grading system used for grading the AS narrowing or the joint space width in bone joints. The KL grading for OA is shown in Table 1.

Figure 1: Digital X-ray images of a)Actual image b) ROI image

Table 1: Kellgren Lawrence Grading for Osteoarthritis.
For the proposed work the joint space which falls under grade 0, 1 and 2 are considered and all the other cases are omitted as their joint space narrowing is clearly predictable without any supporting tools. The AS which falls under grade 0 is considered as normal AS and grade 1and 2 are considered as abnormal AS for this study.
Proposed method
The proposed method involves two major steps in the diagnosis of OA. They are feature extraction stage and classification stage.
Feature Extraction
In this work the feature extraction technique proposed by Haralick et al. [12] is used. There are thirteen features than can be estimated for a given image. These thirteen features listed in Table 2 are called as Haralick features.

Table 2: List of Haralick Features.
The first step in the estimation of Haralick features is the formulation of Grey Level Co -occurrence Matrix (GLCM) for the image. The mathematical definition for GLCM is given in Eq.1.
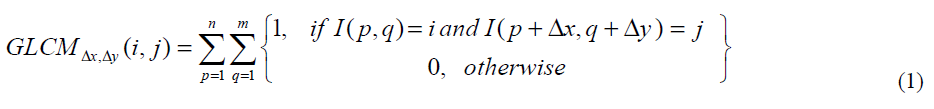
Where
i , j -Image gray values,
p ,q - The spatial position of gray values
Dx,Dy -The displacement of pixels on the direction used.
The example given in Figure 2 illustrates the calculation of GLCM from a 4x4 pixel area.
Figure 2: Calculation of GLCM (a) 4x4 pixel area in an image (b) GLCM (c) normalized GLCM.
The image has five different gray levels over the chosen 4x4 pixel area and the integers in each element indexes the gray values of the corresponding pixel. The (i, j) element of the GLCM is the number of times the gray level pair i and j occur together with the chosen displacement and direction (angle). Finally, the GLCM is normalized by the total number of pixel pairs. This normalized GLCM is used for calculating Haralick features. The displacement and direction shown in Figure 2 are over one pixel and 0º respectively. By changing the displacement and directions, different GLCM can be obtained. Similarly The GLCM can be formulated for other angles with any pixel displacement. The possible directions that can be used to calculate GLCM is shown in Figure 3.

Figure 3: Possible directions of formulation of GLCM.
In Figure 3, the resolution cells 5 and 1 are 0º nearest neighbors, 2 and 6 are 135º nearest neighbors, 3 and 7 are 90º nearest neighbors and 4 and 8 are 45º nearest neighbors. Hence to calculate GLCM for a particular direction, say 45º, the occurrence of gray level pair i and j are calculated along 45º nearest neighbors with selected offset or displacement. In this work the GLCM is formulated for all the above mentioned angles with the one pixel between the neighboring pixels. The classification study carried out using the Haralick features over the individual angles and also with the aggregated value of features obtained with these individual angles.
The block diagram of the feature extraction stage is shown in Figure 4. In this stage the texture features are extracted from the ROI of the image and classes are assigned to the extracted features. The features extracted from the normal AS images are assigned normal AS class and those from the abnormal AS images are assigned as abnormal AS class. The assigned features are stored in a data base. All the images used to build this data base are pre analyzed manually by the radiologist and the classes are assigned based on the report given by the radiologist on those images. This pre-stored data is need for the classifier to assign class to the image under analysis.

Figure 4: Block diagram of feature extraction stage.
Classification Stage
Classification stage involves the classification of the extracted features form the ROI of the knee joint from X-ray images into normal AS and abnormal AS joints. The classification of the extracted features is done by Support Vector Machine (SVM) classifier. The SVM classifier uses a hyper plane for the classification of data. The block diagram of the classification stage is shown in Figure 5.

Figure 5: Block diagram of classification stage of the proposed work.
The Haralick features extracted from the ROI are one dimensional data. Hence the effective classification cannot be done by the classifier with this one dimensional feature. So in order to have effective classification, these one dimensional data is mapped into higher dimensions using the kernel functions. These kernel functions convert linearly non separable data into linearly separable data.
Classification of data using kernel functions at higher dimension is equivalent to the classification of data at their actual lower dimensions. Three kernel functions such as linear, polynomial and Radial Basis Function (RBF) are used in this work for mapping the extracted feature to the higher dimensions.
In the classification stage, the extracted features are mapped to the features stored in the data base as discussed in section 3.1. With this, the classifier acquires knowledge about the extracted features which aids for the classification. Based on this knowledge and on the figure of merit between the feature extracted from the image under analysis and stored features, the classifier assigns the class of AS to the image under analysis. The training and test algorithms are as follows
ALGORITHM 1: TRAINING STEPS
Step 1: Extract the ROI.
Step 2: Extract Haralick statistical features from the ROI.
Step 3: Build database with Haralick features and targets for normal images.
Step 4: Build database with Haralick features and targets for abnormal images.
Step 5: Train the SVM classifier using the databases.
Step 6: Keep the trained classifier
Algorithm 1: Testing steps
Step 1: Extract the ROI from knee X-ray images to be analyzed.
Step 2: Extract Haralick statistical features from the ROI.
Step 3: Test the trained classifier using the extracted features in step 2
Step 4: Compute outputs.
Step 5: Verify the accuracy.
Results and Discussion
In this study, K fold cross-validation experiments are used to assess the performance of the proposed method. K fold cross-validation is widely used to analyze the classification performance of a classification system. It randomly generates indices which define a partition of N observations into K disjoint subsets. In K fold crossvalidation, K-1 folds are used for training and the last fold is used for evaluation. This process is repeated K times, leaving one different fold for evaluation each time.
In this work K is assigned as the value 5.The database used to evaluate the system contains images of 30 normal and 100 abnormal subjects. Among the samples, 25% of samples in each category are used to test the accuracy of the system and the remaining are used to build the classifier. All the testing images are pre-analyzed manually by the radiologist and the manual report is used to verify the classified results by the classifier. Based on the results produced by the algorithm, the images of the knee joints used for testing are categorized into True Positive (TP), True Negative (TN), False Positive (FP) and False Negative (FN).
Where
True positive (TP) : Abnormal AS correctly diagnosed as abnormal
False positive (FP) : Normal AS incorrectly diagnosed as abnormal
True negative (TN) : Normal AS correctly diagnosed as normal
False negative (FN) : Abnormal AS incorrectly diagnosed as normal
The parameters such as accuracy, precision, sensitivity and specificity are the parameters used to evaluate the classification rate of the developed algorithm and those are calculated using the equations given in Eq. 2 -5.


The obtained results with the Haralick features extracted with one pixel displacement and with the possible angle are shown in Tables 3-6.

Table 3: Classification rate for 0° Haralick features and SVM classifier.

Table 4: Classification rate for 45ºHaralick features and SVM classifier.

Table 5: Classification rate for 90 º Haralick features and SVM classifier.

Table 6: Classification rate for 135 º Haralick features and SVM classifier.
From the Table 2-5 it is observed that the better classification rate is observed with RBF kernel functions. In order to improve the classification rate, the study is done by aggregation of Haralick features extracted over the individual angles. Each angle has 13 Haralick features. When aggregation is done for all the four possible directions 4Ã13=52 Haralick features are used for classification. The obtained results are shown in Table 7.

Table 7: Classification rate for aggregated Haralick features and SVM classifier.
A further improvement in the classification rate is observed when these aggregated Haralick features are classified using cascaded kernel functions. The obtained results with the combination of individual Haralick features and cascaded kernel functions are shown in Table 8.

Table 8: Classification rate for aggregated Haralick features and SVM classifier with fused Kernel functions.
With the fusion of kernel functions the feature is mapped on to much higher dimensions than the individual kernel functions. Hence efficient classification is obtained with this combination. This combination is used for the efficient diagnosis in this algorithm.
Conclusion
In this paper the computer aided tool developed to diagnose the bone disorders caused by Osteoarthritis has been discussed. This tool classifies the AS of the knee joint for the digital X-ray image under analysis into normal and abnormal class. This method provides a semi automated tool to examine the digital X-ray images for diagnosis of arthritis. The developed algorithm can be extended to diagnose other skeletal disorders through the efficient training with the samples. This tool helps in reducing the manual errors in the diagnosis and also aids in early diagnosis. In addition to the proposed method, the clinical investigations can be used for the confirmation of the disease.
References
- Evanthia E. Tripolti. (2007), "Automated Segmentation and Quantification of Inflammatory Tissue of the hand in Rheumatoid Arthritis Patients using Magnetic Resonance Imaging Data", International Journal of Artificial Intelligence in Medicine, Vol.40, Issue 1, pp.65-85.
- IoannisBoniatisPanagiotopoulos.E and Lymberopoulos. Assessment of Osteoarthritis Severity by Wavelet analysis of the Hip Joint Space Radial Distance Signature, IEEE International Conference on Bioinformatics and Bio Engineering, 2008 1-6.
- James Connolly, Condell.J and Curran.K. (2012),"A New Method to Determine Joint Range of Movement and Stiffness in Rheumatoid ArthriticPatients", Proceedings of 34 thAnnual International Conference of the IEEE EMBS, pp. 6386-6389.
- Jungon Lee, Song and Sanga.(2008)," Detection of Suspicious Pain Regions on a Digital Infrared Thermal Image using the Multimodal function Optimization", Proceedings of 30th Annual International IEEE EMBS Conference, 2008; 4055- 4058.
- NikolaBorojevic,Kolaric and Grazio . (2011),"Thermography of Rheumatoid Arthritis and Osteoarthritis", Proceedings of International Symposium ELMAR, 2009; 293-295.
- Mahendran and SanthoshBaboo (2011)," Enhanced Automatic X-ray Bone image segmentation using Wavelets and Morphological Operators", Proceedings of International Conference on Information and Electronics Engineering pp125-129.
- Selvarasu ,Nachiappan.A and Nandhitha N.M. (2010), "Euclidean Distance Based Color Image Segmentation of Abnormality Detection from Pseudo Color Thermographs", International Journal of Computer Theory and Engineering, Vol.2, Issue 4, pp. 1793-8201.
- Snehalatha. U, Anburajan. M. and Teena T. ( 2012),"Thermal Image Analysis and Segmentation of Hand in Evaluation of Rheumatoid Arthritis ", Proceedings of International Conference on Computer Communication and Informatics, pp. 1-6.
- Syaiful Anam, Uchino.E and Miswa .H (2013), "Automatic Bone Boundary Detection in Hand Radiographs by using Modified Level Set Method and Diffusion Filter", Proceedings of 6th International Workshop on Computational Intelligence and Applications, pp. 51-55.
- TatilL.Mengo, Wachjudi.R.G and Suksmono.A.B(2005), "Automated Detection of Unimpaired Joint Space for Knee Osteoarthritis Assessment",Proceedings of 7th International Workshop on Enterprise Networking and Computing in Health Care Monitoring, pp. 400-403.
- Yinge Huo, Vinken. K.L and Lafeber. F.M (2013), "Automatic Joint Detection in Rheumatoid Arthritis hand Radiographs", Proceedings of 10th International Symposium on Biomedical Imaging, pp. 125-128.
- Robert M.Haralick and K.Shanmugam. ?Textural Features for Image Classification?, IEEE Transactions on Systems,Man and Cybernetics,Vol.3,Issue 6,pp 610-621.