- Biomedical Research (2009) Volume 20, Issue 3
A Comparative Study of Serum Myeloperoxidase Activity in Type 2 Diabetes and Diabetic Nephropathy
Kusuma KS*, Vasudha KC, Vanitha Gowda MN
Department of Biochemistry, M. S. Ramaiah Medical College, MSR Nagar, Gokula, Bangalore, India
- *Corresponding Author:
- Kusuma K.S
No.9, Sri Satya Sai Nilaya
5th ‘C’ cross, Sharadambanagar
Jalahalli, Bangalore-560 013
Karnataka, India
E-mail: sai10kusupabbi@yahoo.com
Accepted date: May 07 2009
Abstract
Inflammatory burden is high in End Stage Renal Disease (ESRD) patients. In Diabetic ESRD patients, the balance between pro- and anti-oxidant activities is shifted towards an oxidative stress. Myeloperoxidase (MPO), a bactericidal enzyme plays an active role in induction and evolution of the endothelial dysfunction associated with Type 2 Diabetes Mellitus (DM). However, whether MPO can serve as a marker in diabetic ESRD patients is doubtful. Hence, the present study was undertaken. The Fasting Blood Glucose (FBG), Serum Creatinine, Blood Urea Nitrogen (BUN) and Serum Myeloperoxidase levels were estimated in three different groups with 30 subjects each. The Control group includes healthy individuals, group I constitutes Type 2 diabetes with no nephropathy and group II includes Type 2 diabetes with nephropathy patients. Glomerular Filtration Rate (GFR) was calculated using Cockcroft Gault formula corrected for the Body Surface Area. Statistical software, namely, SPSS 15.0, Stata 8.0, MedCalc 9.0.1 and Systat 11.0 were used for the analysis of the data and Microsoft word and Excel have been used to generate graphs, tables etc. Reference Ranges for MPO were established in our study. An increase in MPO levels was noticed in Group I, whereas a differential behaviour of MPO levels was noted in group II. Uremic diabetic nephropathy patients with a low MPO level may be at a lesser risk for any cardiac event compared to those uremic patients with high MPO levels. Hence, MPO may be taken as a biomarker to predict coronary events in diabetic ESRD.
Keywords
End stage renal disease, glomerular filtration rate, myeloperoxidase, oxidative stress, reactive oxygen species, type 2 diabetes mellitus
Introduction
“The quality of life is dependent upon the quality of the life of your cells. If the blood stream is filled with waste products, the resulting environment does not promote a strong, vibrant healthy cell life nor a biochemistry capable of creating a balanced emotional life for an individual”
- Anthony Robbins [1].
Diabetes mellitus is characterized by elevated blood glucose levels, a continuous low–grade inflammation and endothelial activation state [2,3]. Type 2 DM is prevalent in our country to an extent of 5.9% [4]. MPO (E.C.No. 1.11.1.7), a hemoprotein traditionally viewed as bactericidal enzyme secreted by neutrophils plays an active role in the induction and evolution of endothelial dysfunction associated with Type 2 DM [3].
The inflammatory burden is high in ESRD patients. In diabetic ESRD patients, the balance between pro- and anti-oxidant capacities is shifted towards a state of oxidative stress [5]. As increased oxidative stress and inflammation are both common features of ESRD, it has been speculated that there may be an association between them and endothelial dysfunction, contributing to increased risk for cardiovascular disease [5]. As MPO predicts endothelial function in humans, probably by regulating nitric oxide bioavailability, increased MPO activity serves as a mechanistic link among the inflammation (activated leukocytes), oxidative stress and endothelial dysfunction in ESRD [6].
There is limited data available regarding the study of serum MPO activity in patients with type 2 DM with ESRD in India. Considering this, the study was undertaken to see if MPO can serve as a Biomarker in type 2 DM with ESRD.
Material and Methods
A cross sectional study was conducted for a period of one year, starting from Jan 2007, at the M.S.Ramaiah Medical College Teaching Hospital (MSRMTH), Bangalore. Informed Consent was taken from all the participants. The Ethical Clearance for this study was obtained from the Ethical Review Board of M.S.Ramaiah Medical Teaching Hospital. The subjects were selected by Simple Random Sampling.
Study groups
The subjects were divided into three groups of 30 subjects each. All the subjects were above 45 years of age and of either sex.
1. Control group: healthy subjects, attending the Out Patient Department (OPD) of MSRMTH.
2. Group I: Type 2 diabetes patients with no nephropathy, attending the OPD or admitted in the wards of MSRMTH.
3. Group II: Type 2 diabetes patients with nephropathy, attending the OPD or admitted in the MSRMTH.
Relevant clinical history was taken in OPD or in wards and the clinical examination was performed. The height and weight of the patient was recorded at the same time.
Patients with type 2 diabetes mellitus with uncontrolled hype rglyc emi a , a cut e corona ry syndrome s , cerebrovascular accidents or stroke and severe peripheral vascular artery diseases were excluded from group II whereas type 2 DM with nephropathy were excluded from the group I.
About 5 ml of blood sample was collected in the vacutainer bulb without any anti-coagulant. The blood sample was collected after 10 hours of fasting. It was centrifuged and the following investigations were performed immediately- fasting blood glucose, serum creatinine & blood urea nitrogen. They were measured on an auto-analyzer – Dade Behring Dimension series RXL Max. Blood glucose was estimated by an adaptation of the hexokinase – glucose 6-phosphate dehydrogenase method [7]. The remaining serum sample was stored between 0 – 4°C, to measure the MPO levels [8]. The creatinine and BUN were estimated by modification of kinetic Jaffe’s reaction reported by Larsen [9] and urease glutamate dehydrogenase coupled enzymatic technique according to Talke H and Schubert [10] respectively.
Serum MPO levels were estimated by a spectrophotometric method using O–Dianisidine Dihydrochloride as a substrate [11]. Myeloperoxidase was assayed as follows: 0.1 ml of the serum was mixed with 2.9 ml of 50 mM phosphate buffer, pH 6.0, and containing 0.167 mg/ml O-Dianisidine Dihydrochloride (HI-MEDIA Co.) and 1% Hydrogen peroxide (E–Merck) [11]. Some modifications were made to the original procedure to enhance sensitivity of the assay. The change in absorbance was measured at 470 nm using a spectrophotometer (ELICO SL 134 UV – VIS Double Beam Spectrophotometer) for a period of three minutes (kinetic assay) and MPO was measured using the formula [12]. One unit of MPO activity was defined as that degrading one μmole of peroxidase per minute at 25°C [13]. The Statistical software namely SPSS 15.0, Stata 8.0, MedCalc 9.0.1 and Systat 11.0 were used for the analysis of the data and Microsoft word and Excel have been used to generate graphs, tables etc [14-16].
Calculations [12]:
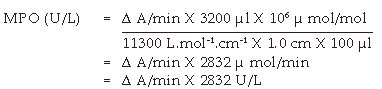
where, Δ A/min = A3 – A2 / 2, A3 = absorbance at three min at 470 nm & A2 = absorbance at one min at 470 nm.
11300 L mol-1. cm-1 = molar absorptivity co-efficient [17].
Glomerular Filtration Rate (GFR) was calculated using Cockcroft Gault formula corrected for the Body Surface Area [18,19].
Results3
The Reference Ranges for MPO was established in our study (Table 1). MPO levels were increased notably in Group I (F is equal to1406.22; P less than 0.001), whereas a differential behaviour was noted in Group II. The blood glucose levels were increased in both Group I and Group II as compared to the controls (Table 1). The levels of BUN and Serum Creatinine were increased in group II as compared to the controls (Table 1). GFR levels were decreased in Group II as compared to the controls and Group I (Table 1).

Table 1: Comparison of study parameters in three groups.
Group II was divided into two subgroups, Group IIa and Group IIb based on the GFR values (Table 2), to see if MPO can serve as a biomarker in End Stage Renal Disease. GFR was measured using the Cockroft Gault formula. The F value for GFR in various study groups is 100.472 with P less than 0.001 and hence is strongly significant (Table 2). The MPO levels are significantly higher in Group I when compared to the control group. In Group IIb, the raise in MPO is again significant with a Mean plus/minus S.D is equal to 488.08±375.57 when compared to the control group (Table 2). In the Group IIa, there is a raise in MPO with a Mean plus/minus S.D is equal to 297.06 plus/minus 230.27 compared to the control group, but the pair wise significance (Table 3) is 0.200 (not significant). The pair wise significance between the Control group and Group I and Control group and Group IIb is less than 0.001 (strongly significant) (Table 3). The F value between the various groups for MPO is 13640 with a P value of less than 0.001 suggesting that it is strongly significant.

Table 2: Comparison of study parameters in three groups.

Table 3: Pair-wise significance.
The sensitivity, specificity and the accuracy of the test is 100% when the MPO values are ≥ 354 U/L in type 2 diabetes, whereas in diabetic nephropathy no such value of MPO exists (Tables 4 and 5). The Area under the curve for MPO in type 2 diabetes is around 1.0000, which indicates that it is an excellent test (Figure 1), whereas in diabetic nephropathy patients, the area under the curve for MPO is 0.7389 which indicates that it is a fair test (Figure 2).

Table 4: Sensitivity, specificity of MPO levels in diabetics with respect to controls.

Table 5: Comparison of study parameters in the two groups in diabetic nephropathy.

Figure 1: ROC Curve for MPO in type 2 diabetes.

Figure 2: ROC Curve for MPO in Diabetic nephropathy.
Group II cases are further divided into two groups based on the MPO levels:
1. Group X: Diabetic Nephropathy with an increase in Myeloperoxidase levels. (greater than or equal to 354 U/L)
2. Group Y: Diabetic Nephropathy with a decrease in Myeloperoxidase levels. (less than or equal to 354 U/L).
The Group II was again divided into two other subgroups based on MPO levels (Table 6) in order to explain the behaviour of MPO enzyme in diabetic nephropathy individuals. The subgroups are: Group X: Diabetic nephropathy with increased MPO levels (greater than or equal to 354 U/L), Group Y: Diabetic nephropathy with decreased MPO levels (less than or equal to 354 U/L).

Table 6:Comparison of study parameters in the two groups in diabetic nephropathy.
Discussion
Myeloperoxidase is an abundant heme protein that is released by activated neutrophils, monocytes and tissue – associated macrophages after inflammatory stimuli [6]. End Stage Renal Disease patients are subjected to enhanced oxidative stress, as a result of reduced anti – oxidant systems (Vitamin C and Selenium deficiency, reduced intracellular levels of Vitamin E, reduced activity of glutathione systems) and increased pro – oxidant activity (advanced age, high frequency of diabetes, chronic inflammatory state, uremic syndrome, bioincompatibility of dialysis membranes and solutions) [5].
Many patients in Chronic Renal Failure exist in a chronic inflammatory state. Patients affected by ESRD experience an excess morbidity and mortality due to cardiovascular disease [20]. Haemodialysis also serves as a potent stimulator of circulating phagocytes [21]. Hyperglycemia of diabetes mellitus and its attendant metabolic syndromes – insulin resistance, hypertension,obesity, dyslipidemia and some social characters of these patients e.g. smoking and the use of xenobiotics predispose to diabetic nephropathy. These accelerate free radical generation and attenuate the anti-oxidant defence system creating oxidative stress [22]. Hence diabetic nephropathy is a state of disease where in there is increased oxidative stress and an increase in MPO is expected which explains the elevation of MPO levels in group I and group IIb.
Table 6 shows the details of GFR and MPO levels in group X and group Y. In group Y (19 patients), the MPO levels are reduced (less than or equal to 354 U/L). These are diabetic nephropathy patients and hence classically a rise in serum MPO would be expected. Instead a decrease in MPO is seen which is due to a rise in the urea levels. The uremic plasma seriously interferes with a variety of normal functions. When urea is present in high concentrations in the body fluids, it may decompose spontaneously into ammonia and cyanate. Cyanate is a potential toxin which combines irreversibly with normal protein in cells and affects their function [23]. Cyanate inhibits both peroxidative and halogenating activities of MPO and inhibits the enzyme within intact neutrophils. The cyanate also inhibits Cl-/H2O2/MPO mediated bacterial killing [24]. In Group IIb, the fall in MPO noted with increased BUN levels was for the same reason.
In Group X (11 patients), the MPO was raised in all of them (greater than or equal to 354 U/L). In this group a few of them were on haemodialysis (four patients) whereas the rest of them were on conservative medical line of treatment (seven patients). Uremia represents a unique clinical condition in which immune dysregulation appears to be closely associated with phagocyte derived oxidative stress. The latter is dramatically exacerbated by haemodialysis (HD) treatment. This aggravation is commonly attributed to the recurrent activation of neutrophils during blood passage through the dialysis circuits and subsequent generation of activated complement components, following the contact with bio-incompatible membranes and/ or the retrodiffusion of endotoxins from the dialysate [25]. Some studies show that during hemodialysis treatment, even with use of bio-compatible membrane and ultra pure dialysate, it may contribute to an increase in leucocyte activation and enhanced oxidative stress [5,26,27].
In group X some patients who were on conservative line of treatment had an increase in BUN levels. We have already seen that MPO values decrease with an increase in BUN level. But in this group of patients, there was an increase in MPO with an increased BUN level. The raise in MPO in this group of patients may be due to the following reasons. In a study [25], which emphasized the respective role of uremic toxins and myeloperoxidase in uremic state, the workers have measured MPO by two different methods. One is an ELISA method and the other is the measurement of a colored product quinoneimine, which is formed due to the co-oxidation of phenol and aminoantipyrine (AAP). A discrepancy was noted between the MPO values measured by these two different methods. To understand the discrepancy in CKD plasma between low immunoreactive MPO levels detected by ELISA and high MPO enzymatic activity levels measured by quinoneimine formation, they investigated whether the oxidative coupling of phenol and AAP resulted mainly from MPO activity in the presence of hydrogen peroxide or whether other oxidative plasma components were directly involved in this oxidation. Hence comparative assays were performed. The plasma of predialysis patients is devoid of peroxidase and the oxidation level as measured by quinoneimine formation is constant irrespective of both H2O2 and MPO presence suggesting mediation by other oxidative plasma components [25]. The other oxidative plasma components are the free plasma aminothiols (homocysteine, cysteine, cysteinylglycine, glutathione). These plasma aminothiols have been found to be excessively oxidized in uremia. The plasma of the ESRD patients on hemodialysis has increased levels of these free plasma aminothiols before dialysis. Hemodialysis procedure serves to remove these and restore the redox status [28]. Hence the increase in MPO levels in patients on hemodialysis appears to be a true reflection of the MPO activity. In pre-dialysis patients, exogenous compounds, such as uremic toxins or active redox compounds, could mediate the oxidative coupling of phenol and aminoantipyrine, leading to quinoneimine formation, independently of MPO enzymatic activity [25]. They form the good candidates to perform redox mediation of aminopyrine and phenol and thus stimulate the spectrophotometric detection of quinoneimine [25] suggesting an apparent increase of MPO activity rather than a true MPO activity.
In the present study, a differential behavior of the MPO has been noticed in the uremic patients and the causes for the same have been discussed above. Diabetics are prone for coronary events and cardiovascular disease is a major cause of morbidity and mortality in patients with type 2 diabetes mellitus [29]. Hence, we may consider that the precipitation of a cardiac event leading on to death is higher in those uremic patients with a high MPO than in those with low MPO levels. Therefore Myeloperoxidase enzyme may be considered as a biomarker for predicting coronary events in End Stage Renal Disease.
However, further studies with follow-up and large trial groups are required to validate the results of our study.
Acknowledgment
I am extremely thankful to Dr. K.P.Suresh, Scientist (Biostatistics), NIANP (ICAR), Bangalore, for the statistical analysis. I am also grateful to Dr. Usha Anand, Professor, for helping me in the standardization of serum Myeloperoxidase.
References
- Anthony Robbins Quotes. Available from : http://www. think exist.com/quotes. Internet Sources.
- Thevenod F, Masur K, Zanker K. Pathophysiology of Diabetes mellitus Type 2: Roles of Obesity, Insulin Resistance and ß – cell dysfunction. In: Diabetes and Cancer. Epidemiological Evidence and Molecular links.Front Diabetes. Basel: Karger; 2008. P. 1-18.
- Moldoveanu E, Tanaseanu C, Tanaseanu S, Kosaka T, Manea G, Marta DS, et al. Plasma markers of Endothelial Dysfunction in Type 2 Diabetics. Eur J Intern Med 2006;17:38-42.
- Diabetes Atlas 2003. International Diabetes Federation. World Diabetes Congress. 2006.
- Locatelli F, Canaud B, Eckardt KU, Stenvinkel P, Wanner C, Zoccali C. Oxidative stress in End Stage Renal Disease; an emerging threat to patient outcome. Nephrol Dial Transplant 2003;18:1272-80.
- Stenvinkel P, Rodríguez-Ayala E, Massy ZA, Qureshi AR, Barany P, Fellström B, et al. Statin treatment and diabetes affect myeloperoxidase activity in maintainance hemodialysis patients. Clin J Am Soc Nephrol 2006;1:281-7.
- Kunst A, Draeger B, Ziegerhorn J. UV Methods with Hexokinase and Glucose-6 phosphate dehydrogenase In: Methods of Enzymatic Analysis, Bergmeyer, HU. Vol. 4. Deerfield FL: Verlag Chemie; 1983. p. 163–72.
- Johann Putter and Reinhild Becker. Peroxidase, Enzymes 1: Oxidoreductases, Transferases: In: Bergmeyer Methods of Enzymatic Analysis, Ed. 3, Hans Ulrich Bergmeyer, Bergmeyer, Jurgen, Graß1, Marianne,. Weinheim: Verlag Chemie; 1981. p. 286– 93.
- Larsen K. Creatinine assay by reaction kinetic approach. Clin Chim Acta 1972;4:209–17.
- Talke H, Schubert GE. Enzymatische Harnst off bestimmung in Blut and serum In: optischer test nach Warburg. Klin W S Chr 1965;43:174–5.
- Bradley PP, Priebat DA, Christensen RD, Rothstein G. Measurement of cutaneous inflammation: Estimation of neutrophil content with an enzyme marker. J Invest Dermatol 1982;78:206-9.
- Krueger AJ, Yang JJ, Roy TA, Robbins DJ, Mackerer CR. An Automated Myeloperoxidase Assay. Clin Chem 1990;36:158.
- Worthington Enzyme Manual. Freehold, NJ: Worthington Biochemical Corp; 1972. p. 43– 5.
- Rosner B. Fundamentals of Biostatistics. 5th ed. Duxbury: 2000. p. 80–240.
- Reddy, Venkataswamy M. Statistics for Mental Health Care Research. India: NIMHANS Publication; 2002. p. 108–44.
- Rao, Sunder PS, Richard J. An Introduction to Biostatistics, A manual for students in Health Sciences. New Delhi: Prentice Hall of India; p. 86–160.
- Zhang C, Yang J, Jennings LK. Leucocyte derived Myeloperoxidase amplifies High Glucose Induced Endothelial Dysfunction Through Interaction with High Glucose stimulated, vascular non leukocyte derived reactive oxygen species. Diabetes 2004;53:2950–9.
- Ibrahim H, Mondress M, Tello A, Fan Y, Koopmeiners J, Thomas W. An Alternative formula to the Cockcroft Gault and the Modification of Diet in Renal Diseases Formulas in predicting GFR in individuals with Type 1 diabetes. J Am Soc Nephrol 2005;16:1051–60.
- Dubois D, Dubois EF. A formula to estimate the approximate surface area if height and weight be known. Arch Intern Med 1916;17:863–71.
- Agodoa LY, Eggers PW. Renal Replacement Therapy in the United States: Data from the United States Renal Data System. Am J Kidney Dis 1995;25:119–33.
- Ward RA. Phagocytic cell function as an index of biocompatibility. Nephrol Dial Transplant 1994;9:46–56.
- Mshelia DS. Review: Role of free radicals in pathogenesis of Diabetic Nephropathy. Annals of African Medicine 2004;3:55–62.
- Dr. Wadhwa, “Chronic Renal Failure”, Stony Brook University Hospital. Available from: www.uhmc. sunsyb.edu/internalmed/nephrolwebpages/ Internet Sources.
- Qian M, Eaton JW, Wolff SP. Cyanate mediated inhibition of neutrophil myeloperoxidase activity. Biochem J 1997;326:159–66.
- Capeillère-Blandin C, Gausson V, Nguyen AT, Descamps-Latscha B, Drüeke T, Witko-Sarsat V. Respective role of uremic toxins and Myeloperoxidase in the uremic state. Nephrol Dial Transplant 006;21:1555–63.
- Cohen MS, Elliott DM, Chaplinski T, Pike MM, Niedel JE. A defect in the oxidative metabolism of human polymorphonuclear neutrophils that remain in circulation early in hemodialysis. Blood 1982;60:1283–9.
- Epperlein MM, Nourooz-Zadeh J, Jayasena SD, Hothersall JS, Noronha-Dutra A, Neild GH. Nature and Biological significance of Free Radicals generated during bicarbonate hemodialysis. J Am Soc Nephrol 1998;9:457–63.
- Himmelfarb J, McMongale E, McMenamin E. Plasma aminothiol oxidation in chronic hemodialysis patient. Kidney Int 2002;61:705 –16.
- Peter JS. Cardiovascular complications of diabetes mellitus: what we know and what we need to know about their prevention. Ann Intern Med 1996;124:123–6.