- Biomedical Research (2016) Volume 27, Issue 3
The effect of lower extremity masses and volumes on the balance performance of athletes.
Mustafa Akil1, Cagri Celenk2, Zait Burak Aktug3, ?rfan Marangoz4, Taner Y?lmaz1, Elif Top1
1Faculty of Sport Sciences, University of Usak, University of Usak, Usak, Turkey
2School of Physical Education and Sports, University of Erciyes, Kayseri, Turkey
3School of Physical Education and Sports, University of Ni?de, Ni?de, Turkey
4Af?in High School, University of Kahramanmaras Sutcu Imam, Kahramanmaras, Turkey
- *Corresponding Author:
- Zait Burak AKTU?
School of Physical Education and Sports
Erciyes University
Turkey
Accepted Date: April 06, 2016
Abstract
Our study aims to investigate the effects of lower extremity mass and volume characteristics of elite athletes on the balance performances. The study has included 42 elite athletes totally with an average age of 23.45 ± 2.50 years, average height of 173.64 ± 6.96 cm, average weight of 79.55 ± 14.19 kg and average body mass index of 26.22 ± 3.06. The calf, femur, foot and leg volumes of the subjects included in the study have been determined by means of Frustum method however, calf, femur, foot and leg masses of the subjects have been determined by means of Hanavan method. The static and dynamic balance performance of athletes has been measured by Biodex Balance System. Dynamic balance performance has been detected in the levels of 2, 4 and 8. When dynamic balance performances have been evaluated, it has been found that there is a significant difference in low-level balance test (p>0.05), and a positive difference has been found between the masses and volumes of calf (r=0.437), femur (r=0.609), foot (r=0.344) and leg (r=0.607) in terms of good and moderate level of balance performances (p<0.05). According to the results obtained, the masses and volumes of calf, femur, foot and leg of the athletes have affected the balance performances and, as the difficulty level of the balance performance increases, the lower extremity mass and volumes affect the balance performance much more. In conclusion, it has been found that lower extremity masses and volumes affect the balance performance of the athletes positively, and lower extremity mass and volumes are required to be improved enough in the branches that put an emphasis on balance.
Keywords
Balance, Athletes, Leg mass, Leg volume.
Introduction
Balance is a skill to establish control on standing area of body to prevent falling. This is examined under two main topics: static and dynamic. Static balance is defined as to establish balance without moving [1] and it performs this on 2nd sakral vertebra through intercepting the body on gravity center [2]. On the other hand, dynamic balance is defined as a balance establishing skill without falling during action [1]. Balance is influenced by many systems including visual and audial systems, power, joint range of motion and coordination [3,4]. Although establishing balance is considered as an easy skill, it requires complex motor skills [5]. The required motion plane to establish balance is obtained through a coordinated structure including the movements of feet, knees and hip joint [6]. Balance is highly important to expose a sportive performance and it has an essential role having preserved the body on a certain position, such as, swinging, standing, holding and moving an object [7,8]. It is indicated that some changes on balance control occur and balance improves depending upon the exercising time of the athletes [9]. To achieve this, athletes can dominantly utilize their sensory knowledge that their branches require [10,11]. During the developmental period of humans, differences are observed not only on their bodies’ volume and size, but also in body parts ratio of one another [12]. It is revealed by research studies that besides increasing the sportive performance improving balance performance decreases the sports injuries that occur in lower extremity [13,14]. While the sportive activities are done and skills are performed, many motoric features come into play. It is indicated that these motoric features are not equivalent. Although many different motoric features come into play with each movement, power constitutes the main components of all activities [7,8]. Maximum power production ability is related to the horizontal cross-sectional area of the muscle [15,16] leg volume, mass and the cross-sectional area of the muscles constituting the leg area affect the strength and power that the muscle produces [17]. It is stated that having more muscle mass of quadriceps and hamstring which form femur area increase the power originated in muscle and affect the maximum strength in a positive way [18]. However, there are not sufficient studies comparing how much balance properties are affected by leg mass and volume value that sports branches require.
The aim of the study is to examine the leg mass and volume of the elite athletes with index of oscillation, static balance and dynamic balance performances on different levels by comparison.
Materials and Methods
Subjects
To the present study, 42 male elite athletes from different branches participated voluntarily. For the linear measurement of the participants a steel stadiometer with a sensitivity of 0.1 barefoot is used; the measurement of weight is determined barefoot and without metals on the participants by Tanita BC-418 Segmental Body Analyse System (Tanita Corporation, Tokyo, Japan).
Balance measurement
In the study, for measuring the balance, Biodex Balance System (BBS) (Biodex, Inc, Shirley, New York) was used. Biodex balance device is constituted of a movable platform which enables the participants both to stand still and move backward, forward and sidewise. Among the balance indexes taken, general balance index (OA) talent is accepted as the best indicator. Balance scores that are “0” indicate the maximum balance rate. The high level of OA index value indicates the loss of high balance. The moveable platform has mobility level of 0-12. While “12” is the most stable platform, “0” constitutes the most moveable platform. In this study, static balance test, dynamic balance test at 2nd, 4th and 8th levels and index of oscillation test were used with eyes open. Tests were carried out on feet and in an upright position. Feet balance tests were performed for 30 seconds with 10 seconds interims and repeated three times. Before the actual tests, athletes were practiced the test for 10 seconds long to adapt and recognize the static and dynamic tests The participants were asked not to speak or move during these tests. The test of the participants who lost the balance was restarted.
Calculation of leg volume
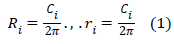
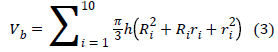
Femur, calf and foot were included to the calculation of volume. Measurements for femur, the distance between tibial point and inguinal fold; for calf, the distance between the tibial point and medial malleoulus point; for foot after determining the whole foot and medial malleolus were performed as Frustum model method defines. After measuring the distance between tibial point and inguinal fold for femur volume and the distance between tibial point and medial malleolus for calf volume with 10% interims, the volume of the parts were calculated according to Frust sign model (Formula 1) which were taken with 10% interims, after that through adding the volume of all parts, total volume of femur (Formula 2) and calf (Formula 3) were calculated (Figure 1) [19].

Figure 1: Calculation of leg volume.
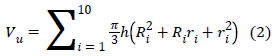
Vu=Femur Volume
Vb=Calf Volume
Ri=Radius of the broad fraction of 10% part
ri=Radius of the narrow fraction of 10% part
Ci=Diameter of the broad fraction of 10% part
ci=Diameter of the narrow fraction of 10% part
h=The distance between broad and narrow fraction of 10% part
Calculation of foot volume
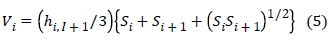
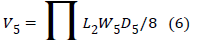
The elliptic area calculation of the horizontal cross-sectional area in each part was done with formula 4; sequential parts and the volume with constrained areas were calculated by using Frustum model. For calculating the foot volume, the hi,ı +1distance is the distance between the sequential parts (Formula5), the value of height (h) beginning from line number 1 to thenar is L3/2 which changes from one foot to another. The h value from the 3rd part to 4th part is L1/2 which changes from one foot to another. The volume of the 5th part was calculated by elliptic parabolic and the total volume of the foot was calculated by adding the volume of all parts (Formula 6) (Figure 2) [17,20].

Figure 2: Calculation of foot volume.
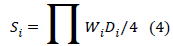
Si=Horizontal cross-sectional area
Wi=Maximum width
Di=Maximum depth
Vi=Volume
hi=Height
V5=Total foot volume
Foot volume either can be defined with necessary charts between thenar and medial malleolus or as it is described above volume of each parts were calculated and added to the total and the total volume of the foot was calculated (Formula 7).
Va=V1+ V2 +V3 +V4+V5 (7)
Va=Volume of the foot
V1=Volume of the first area
V2=Volume of the second area
V3=Volume of the third area
V4=Volume of the fourth area
V5=Volume of the fifth area
Calculation of the leg mass
Femur, calf and foot are included to the mass calculation. Accordingly, for femur, distance between tibial point and inguinal fold; for calf, distance between tibial point and malleolus point and for foot, medial malleolus and whole foot were determined and finally the measurements were performed as Hanavan model defines (Figure 3) [17,21].

Figure 3: Modified hanavan model.
=0,074VA + 0,138UÇ − 4,641 (8)
m=Femur mass
VA=Body weight
UÇ=The place that femur provides the broadest circumference measurement
m =0,135BÇ −1,318 (9)
m=Calf mass
BÇ=The place that calf provides the broadest circumference measurement
m =0,003VA + 0,048ABÇ + 0,027 AU − 0,869 (10)
m=Foot mass
VA=Body weight
ABÇ=Ankle circumference
AU=Foot length
Statistical analysis
After completing the statistical descriptions of the data, the relation of mass and volume and balance is determined via correlation analysis. For analysis, Windows SPSS 22.0 software program was used and significance level was considered as 0.05 (Table 1).
| n=42 | Age | Height | Weight | BMI | Leg Volume | Leg Mass |
|---|---|---|---|---|---|---|
| x ± sd | 23.45 ± 2.50 | 173.64 ± 6.96 | 79.55 ± 14.19 | 26.22 ± 3.05 | 15200.30 ± 2966.60 | 13.19 ± 2.23 |
Table 1: Demographic data of the participants.
Between leg volume and leg mass (r=.824, p<0.001) positively significant,
Between leg volume and index of oscillation (r=-.071, p>0.05) no significant relation is stated.
Between leg volume and Dynamic Balance Level 2(r=.567, p<0.05) positively significant,
Between leg volume and Dynamic Balance Level 4 (r=.538, p<0.001) positively significant,
Between leg volume and Dynamic Balance Level 8 (r=0.308, p<0.05) positively significant,
Between leg volume and Static Balance (r=0.021, p>0.05) no significant relation is stated.
Between Leg mass and index of oscillation (r=0.007, p>0.05) no significant relation is stated.
Between Leg mass and Dynamic Balance Level 2 (r=0.714, p<0.001) positively significant
Between Leg mass and Dynamic Balance Level 4 (r=0.489, p <0.01) positively significant
Between Leg mass and Dynamic Balance Level 8 (r=0.366, p<0.05) positively significantBetween Leg mass and Static Balance (r=0.021, p>0.05) no significant relation is stated.
While no differences are determined between the index of oscillation and static balance when the leg volume and leg mass of the participants are compared with balance performances (p>0.05), positively significant differences are determined between leg volume, leg mass and Dynamic Balance Level 2, 4, 8 performances. The results are given in Table 2.
| Leg Volume | Leg Mass | Index of Oscillation | Dynamic Balance Level 2 | Dynamic Balance Level 4 | Dynamic Balance Level 8 | ||
|---|---|---|---|---|---|---|---|
| LegMass | R | 0.824*** | - | - | - | - | - |
| P | 0.000 | - | - | - | - | - | |
| Index of Oscillation | R | -0.071 | 0.007 | - | - | - | - |
| P | 0.655 | 0.963 | - | - | - | - | |
| Dynamic Balance Level 2 | R | 0.567*** | 0.714*** | -0.200 | - | - | - |
| P | 0.000 | 0.000 | 0.204 | - | - | - | |
| Dynamic Balance Level 4 | R | 0.538*** | 0.489** | -0.268 | 0.661** | - | - |
| P | 0.000 | 0.001 | 0.086 | 0.000 | - | - | |
| Dynamic Balance Level 8 | R | 0.308* | 0.366* | -0.345* | 0.579** | 0.665** | |
| P | 0.047 | 0.017 | 0.025 | 0.000 | 0.000 | ||
| Static Balance | R | 0.021 | -0.164 | -0.327* | 0.125 | 0.247 | 0.330* |
| P | 0.894 | 0.300 | 0.034 | 0.429 | 0.115 | 0.033 | |
| *p<0.05, ** p<0.01, *** p<0.001 | |||||||
Table 2: Correlation between the leg volume and leg mass of the participants and their balance results.
Discussion and Conclusion
As a result of sportive factors, many changes occur in the body and the body tries to accommodate itself to the environmental conditions. While the uploadings to the body related the branch can help to gain required structure, the performance increases and the body structure is tried to be made favourable formally [22]. When the present study is examined, whereas no differences are determined between the index of oscillation and static balance when the leg volume and leg mass of the participants are compared with balance performances (p>0.05), positively significant differences are determined between leg volume, leg mass and Dynamic Balance Level 2, 4, 8 performances (Table 2). Balance is an important factor in sports such as, basketball, football, handball, volleyball, gymnastics, boxing and wrestling which require movements [23] and is also affected by aerobics, anaerobic, balance and speed exercises as well as strength exercises [8]. Muscle power and horizontal cross-sectional area increase collaterally and it is stated that the increase in leg volume and mass can improve the muscle power [24]. When the related studies are searched, it is reported that the strength exercises are efficient for related leg muscles, in parallel to power increase, many improvements occur in dynamic and static balance levels [25,26]. In contrast, decrease in muscle power causes decrease in balance levels [27,28]. To get a better performance, it is stated that firstly the body type must fit to the branch. Body type has a determining role on physical activity level and the person’s tendency to sports, however, it is mentioned that regularly performed physical activities can cause changes on the physical structure of the body [29]. As a result of researches, only one work in which volume and mass and balance performance have been compared can be found. Ibiş et al. have detected through a work about women volley-ballers that the volume of athletes’ legs and their balance performance increase parallel to each other. They express that with the increase of leg volume, the strength of muscle increases and this situation improves the balance performance [30]. On the other hand, when the studies, comparing leg volume and mass with other parametres, such as, power, reaction time and anaerobic performance, are taken into account, it is observed that there is a positive relation between balance performance and power parameter, that more leg volume and mass increase the strength, in parallel to this balance performance changes.
In conclusion, while no differences are determined between the index of oscillation and static balance when the leg volume and leg mass of the participants are compared and balance performances, positively significant differences are determined between leg volume, leg mass and dynamic balance level performances and it is speculated that these differences originate from the relation between mass and power. Although the opinion, that the increase in leg volume and mass increase the balance performance can be asserted, this hypothesis must be supported with further broader studies with more participants.
References
- Hotchkiss A, Fisher A, Robertson R, Ruttencutter A, Schuffert J,Barker DB. Convergent and predictive validity of three scales related to falls in the elderly. Am J OccupTher 2004; 58: 100-103.
- Felsenthal G, Ference TS, Young MA. Aging of organ systems. Butterwoth Heinemann, Boston, 2001.
- Grigg P. Peripheral neural mechanisms in proprioception. J. Sport Reh1994; 3: 2-17.
- Palmieri RM, Ingersoll CD, Stone MB, Krause BA. Center-of-pressure parameters used in the assessment of postural control. J Sport Rehabil 2002; 11: 51-66.
- Emery CA, Cassidy JD, Klassen TP, Rosychuk RJ, Rowe BB. Development of a clinical static and dynamic standing balance measurement tool appropriate for use in adolescents. Phys. Ther 2005; 85: 502-514.
- NashnerL. Practical biomechanics and physiology of balance. Singular, Chicago, 1993.
- Perrin PP, Gauchard GC, Perrot C, Jeandel C. Effect of physical and sporting activities on balance control in elderly people. British J Sports Med 1999;33: 121.
- Earl JE, Hertel J. Lower-extremity muscle activation during the star excursion balance tests. J Sport Rebabil 2001; 10: 93-104.
- Perrin P, Deviterne D, Hugel F. Judo better than dance, develops sensorimotor adaptabilities involved in balance control. Gait and Posture 2002; 15: 187-194.
- Perrin P, Schneider D, Deviterne D. Training improves the adaptation to changing visual conditions in maintaining human posture control in a test of sinusoidal oscillation of the support. NeurosciLett 1998; 245: 155-158.
- Vuillerme N, Danion F, Marin L. The Effect of expertise in gymnastics on postural control. NeurosciLett 2001; 303: 83-86.
- Cameron N. Human Growth and Development. USA: Academic Press, 2002.
- Khodabakhshi M, Javaheri SAH, Atri AE. The effect of balancing and resistive selected exercise on young footballers dynamic balance. Eur J SportsExercSci 2012; 1: 44-51.
- Filipa A, Byrnes R, Paterno M. Neuromuscular training improves performance on the star excursion balance test in young female athletes. J Orth& Sports PhyTherap 2010; 40: 551-558.
- Wickiewicz TL, Roy RR, Powell PL. Muscle architecture and force-velocity relationship in humans. J ApplPhysiol 1984; 57: 435-443.
- Bruce SA, Phillips SK, Woledge RC. Interpreting the relation between force and crosssectional area in human muscle. MedSciSport Exerc 1997; 29: 677-683.
- Oskan A, Kin-Isler A. Relationships of leg volume, leg mass, anaerobic performance and ısokinetic strength in American football players.J Spormetre 2010; 8: 35-41.
- Armstrong N, Welsman JR, Chia MYH. Short term power output in relation to growth and maturation. British J Sports Med 2001; 35: 118-124.
- Sukul DMKSK, Den Hoed KS,Johannes EJ, Van Dolder R, Benda E. Direct and indirect methods for the quantification of leg volume: comparison between water displacement volumetry, disk model method and the frustum sign model method, using the correlation coefficient and the limits of agreement. J Biomedical England 1993; 15: 477-480.
- Mayrovitz HN, Sims N, Litwin B. Foot volume estimates based on a geometric algorithm in comparison to water displacement. Lymphology 2005; 38: 20-27.
- Know YH (1998) Modified Havanan Model.http://www.kwon3d.com/theory/bspeq/hanavan.html/. Accessed 10.09.2015
- Bektas Y, Ozer BK, Gultekin T. Anthropometric characteristics of female basketball players: somatotype and body composition values. NigdeUni J PhyEdu Sports Sci 2007; 1: 52-62.
- Marsh DW, Richard LA, Williams LA, Linch KJ. The relationship between balance and pitching in college baseball pitchers. J Strength Con Res 2004; 18(4): 441-56.
- Young MD, Jordan D, Metzl JD. Strength training for the young athlete. Mdpedıatrıc Annals 2010;39: 5.
- Mohammadi V, Alizadeh M, Gaieni A. The Effects of six weeks strength exercises on static and dynamic balance of young male athletes. Social and BehavioralSci 2012;31: 247 - 250.
- Paterno MV, Myer G. Neuromuscular training improves single-limb stability in young female athletes. J Orthop Sports PhyTher 2004; 34: 305-311.
- Campbell AJ, Borrie MJ, Spears GF. Risk factors for falls in a community based prospective study of people 70 years and older. JGerontol 1989; 44: 112-117.
- Mayson DJ, Kiely DK, LaRose SI. Leg strength or velocity of movement: which is more influential on the balance of mobility limited elders. Am J Phys Med Rehabil 2008; 87: 969-976.
- Gualdi-Russo E, Zaccagni L. Somatotype, role and performance in voleyball players. J Sports Med Phys Fitness 2001; 41: 256-262.
- İbiş S, İri R, Aktuğ ZB. The effect of female volleyball players’ leg volume and mass on balance and reaction time.International Journal of Human Sciences 2015; 12: 1296-1308.