Research Article - Biomedical Research (2018) Volume 29, Issue 10
Structural analysis of the Babesia microti thioredoxin reductase: a potential drug target for babesiosis treatment
Neelima Arora1*, Amit Kumar Banerjee2 and Mangamoori Lakshmi Narasu1
1Centre for Biotechnology (CBT), Institute of Science and Technology (Autonomous), Jawaharlal Nehru Technological University Hyderabad, Kukatpally, Hyderabad, Telangana, India
2Biology Division, CSIR-Indian Institute of Chemical Technology, Uppal Road, Tarnaka, Hyderabad, Telangana, India
- *Corresponding Author:
- Neelima Arora
Centre for Biotechnology (CBT)
Institute of Science and Technology (Autonomous)
Jawaharlal Nehru Technological University Hyderabad
Telangana, India
Accepted date: April 28, 2018
DOI: 10.4066/biomedicalresearch.29-18-761
Visit for more related articles at Biomedical ResearchAbstract
Babesia microti, the causative agent of human babesiosis which was endemic in United States and parts of Europe with sporadic cases in other regions is expanding its geographical range. Being a common transfusion threat, Babesia has become a cause of concern in researchers and epidemiologists. Human babesiosis is now recognized as an emerging disease and gains more attention now than ever before. Thioredoxin reductase, a promising drug target in apicomplexan parasite has been validated in several species. This study focused on in-silico analysis of physicochemical properties, functional and structural aspects of thioredoxin reductase of B. microti. Comparative modeling approach was adopted for developing the three dimensional structural model of Thioredoxin reductase of Babesia microti. The model developed was found to be of reasonably good stereo-chemical quality by structure validation servers. This study will provide valuable insights about the function and structure of the enzyme thioredoxin reductase of B. microti and aid in developing effective chemotherapeutic agents for control and treatment of Babesia.
Keywords
Babesia microti, Babesiosis, Thioredoxin reductase
Introduction
Babesiosis in humans and animals is caused by apicomplexan zoonotic hematotropic parasites of the genus Babesia transmitted by ticks. Babesia is quite ubiquitous in nature with a wide range. Babesia is one of the most common blood parasites of mammals. Babesiosis is one of the most common infections of animals and causes profound economic, medical and veterinary impact globally. After years of being recognized as major pathogen in cattle causing huge economic losses, babesiosis has recently gained recognition as an important pathogen of human [1]. First case of babesiosis was reported in Croatia in 1957 [2]. Babesiosis caused by the B. microti in human in United States was first documented in 1969 [3].
Out of more than 100 known species of Babesia, only a fraction cause human babesiosis. Among these, genetically distinct Babesia microti is the predominant species in US and major culprit responsible for causing human babesiosis. The spectrum of Babesiosis ranges from asymptomatic to severe malaria-like symptoms including chills, sweats, headache, arthralgia, myalgia, anorexia, cough and occasionally causing deaths in humans. Babesia disease cycle progresses in two hosts involving black legged deer ticks of belonging to Ixodes genus as definite host and a vertebrate intermediate host primarily. Peromyscus leucopus while humans are accidental hosts or dead-end hosts who acquire the infection with the bite of infected ticks. The disease is tightening its grip in many states of United States as well as other parts of the world including Europe and a few Asian countries. Co-morbidity of babesiosis with Lyme disease and possibility of underreporting in asymptomatic patients often compounds the situation. The fact that Babesiosis can be transmitted congenitally as well as through blood transfusion and is difficult to diagnose makes the situation worse [4,5]. Babesia can even survive for prolonged period in blood storage conditions. Babesiosis has emerged as a major transfusion transmitted threat of the recent times [5]. Babesia remains understudied unlike another apicomplexan parasite Plasmodium and Toxoplasma. Owing to increased number of incidences over past few years, human babesiosis is now classified as emerging disease [6]. CDC has included babesiosis as nationally notifiable diseases in 2011. Immunocompromised individuals like those suffering with HIV infection, cancer, hemoglobinopathy, organ transplantation are at high risk of contacting babesiosis and demonstrate more severe symptoms and persistent infection. Other factors that make one vulnerable to contacting babesiosis are age, drug regime of immunosuppressive drugs or recent splenectomy. The disease shows a seasonal trend coinciding with the seasonal activity of ticks. Like any other protozoan parasites, Babesia inhabits an oxygen rich environment inside blood cells of mammalian host and faces a challenge of shielding its system against oxidative stress which may wreak havoc by damaging its membrane lipids, nucleic acids, and proteins. To counteract Reactive Oxygen Species (ROS), Babesia employs anti-oxidant systems including Thioredoxinthioredoxin reductase (Trx/TrxR) and Glutathione-Glutathione Reductase (GSH/GR). Thioredoxin system comprises of Thioredoxin reductase (TrxR), various thioredoxins and Thioredoxin-dependent peroxidases (TPx).Thioredoxin reductase has been biochemically characterized in Babesia [7]. Thioredoxin reductase belongs to a family of dimeric flavoenzymes. Thioredoxin reductase is an essential enzyme required for counteracting the oxidative stress and hence, in survival of these parasites. It is considered an attractive drug target as it plays key role in many cellular processes and its inhibition can affect many vulnerable stages in apicomplexan parasites. Not much is known about the functional and structural aspects of thioredoxin reductase of Babesia. Comparative modeling or homology modeling is an alternate method that aid in deriving structural insight about protein in absence of experimentally derived structure. Homology modeling has been used successfully for providing structural information of key enzymes in various instances in important human pathogens in past [8-17]. The enzyme of Babesia has pronounced and significant differences with the human counterpart. Hence, we undertook the exercise of developing a 3-dimensional model of Thioredoxin reductase enzyme of Babesia microti for obtaining insights about its structure and function.
Materials and Methods
Sequence retrieval and physicochemical characterization
Uniprot database (http://www.uniprot.org/) was searched using keyword “Babesia microti” and thioredoxin reductase”. The query yielded 7 entries. Primary sequence of the enzyme thioredoxin reductase of Babesia microti (Accession: A0A1R4AAX8) was collected in Fasta format from the database. Physicochemical properties of the enzymes were determined using Expasy-ProtParam and Protscale tool [18]. Charge and Pepstats of Emboss was used to determine position-wise distribution of charge mole percentage of various classes of amino acids in Thioredoxin reductase respectively.
Propensity of crystallization
CRYSTALP2 web server available at [19] and Xtalpred [20] were used to predict the propensity of enzyme to crystallize.
Functional characterization of thioredoxin reductase of Babesia microti
CYS REC server [21] that identifies the positions of cysteines, total number of cysteines and computes the most probable SS bond pattern of pairs in the protein sequence was used to analyse SS bonds in primary sequence.
Motifs were predicted using default parameters in MEME suite (Multiple Em for Motif elicitation) [22].
Consurf server was employed for identification of biologically important protein residues in the protein sequence [23,24]. As three-dimensional structure of the protein is not available in Protein Data Bank (PDB) (http://www.rcsb.org/pdb), this study aimed at development of 3D model of thioredoxin reductase of Babesia microti and conducting in-depth sequence and structural analysis.
Secondary structure prediction from target sequence
Secondary structure of a protein denotes the arrangement of residues in alpha helix, beta sheets, extended strands or turns. Secondary structure of the selected protein was predicted employing NPS server [25] using various methods viz. DPM [26], DSC [27], GOR4 [28], HNNC [29], PHD [30], Predator [31], SOPMA [32], SIMPA96 [33] and secondary consensus [34] keeping default parameters for 4 state predictions keeping output width=70.
Prediction of protein disorder
Often post translational modifications, attachment of signal peptides, evolutionary path of a protein molecule are dictated by the disordered regions present in a protein molecule. Thus, identification of such important disordered regions is of immense importance to understand the structure and function of a protein. Disordered regions of the thioredoxin reductase were identified using DisEMBL [35], GLOBPLOT [36], RONN [37] and Protein Disorder Prediction System (PRDOS) [38] server.
Generation of three dimensional models
Comparative modeling approach was adopted to derive a 3D model of thioredoxin reductase of Babesia microti. The spatial restraint based Modeller 9.19 version was used for this purpose. The complete modeling exercise included target based template searching and selection, target-template alignment, model development employing spatial restraint, model evaluation, loop optimization and final structural quality evaluation. For further assurance and better template consideration, we have also attempted parallel template selection through Swiss model [39].
Selection of template
For template selection, the first approach model generation method of Swiss model [39] was used. On the basis of obtained result, high-resolution X-ray crystallography structure of thioredoxin glutathione reductase at a resolution of 2.30 Å (PDB ID: 2x99, A chain) [40] having 48.22% identity with the query sequence was selected as template for homology modeling exercise. In parallel, template searches were performed through Modeller 9.19 version [41] via profile development and searching. Reasonable number of hits (20; 1aogA, 1ojt, 3grs, 1trb, 1dxlA, 1ebdA, 1nhp, 1fecA, 1gesA, 1h6vA, 1jehA, 3ladA, 1lpfA, 1lvl, 1mo9A, 1onfA, 1vdc, 1xdiA, 1q1rA, 1xhcA) was obtained through this process and all the obtained templates were compared on the basis of their sequence length coverage (sequence identity) and crystal structure resolution.
Target-template alignment
Out of the selected total number of templates (20 from Modeller analysis and 2x99A from SwissModel), further reduction in number of templates was done following the sequence identity and structural resolution based criterion. The following templates were selected: 1mo9A, 1xhcA, 1nhpA, 1xdiA, 1lvlA, 1h6vA, 1q1rA. A template-template comparison was done to reach such conclusion. Target-template alignment was done using the Modeller based scripts (Modeller version 9.19). The template (2x99A) selected through the Swiss Model tool was also included in the final template list.
Model development and evaluation
The target sequence was carefully aligned with the generated multi-template alignment. Total 10 models were generated based upon the multi-template-target alignment. All the models were subjected to PDF, DOPE and GA341 evaluation. The best model was selected after carefully analyzing the obtained values, especially the DOPE scores. GA341 output suggested that the structures were similar to the original crystal structures in quality.
Loop optimization and further structural evaluation
The best model was selected and visually inspected using VMD [42] and Chimera [43]. The observation suggested that the model contained multiple sheets and helices along with several loops. Considering the generation of multiple loops, multi-template based approach was adopted so as to generate a structure with comparatively shorter loops. Loop optimization was mandatory considering the presence of multiple loops in the structure. Based on the visual inspection and other external systematic evaluation (RAMPAGE [44], ERRAT [45] etc.), regions with loops having comparatively poor energy were subjected to refinement. Total 10 structures with loop refinement were generated and further evaluated. Obtained results pertaining to the template selection through structure development and evaluation are described in the result section.
Structure validation
Followed by the structure validation through DOPE score, GA341 and modeler objective function, all the structures were further subjected to validation through RAMPAGE, PROSA (Protein Structure Analysis) and ANOLEA (Atomic Non-Local Environment Assessment). Analysis detail is provided in the result section.
Secondary structural analysis from final protein structure
To understand the three-dimensional structure with details of secondary, tertiary and quaternary features, further structural analysis with PDBSUM and PROMOTIF [46] was performed. Detailed insight on all the sheets, helices, loops, hairpins, disulphide linkages along with specific motifs and orientation was obtained for the generated structure.
Active site prediction
Identification of active site is important to understand the plausible pockets present in a protein which can be considered for safe binding sites for potential inhibitors which may aid in hindering the structural and functional mechanism of an important protein molecule belonging to a pathogen. With such objective, potential active site mapping was done using CASTp tool [47] to retrieve information regarding the microenvironment of the pockets of the target protein.
Ligand selection and docking analysis
Antibiotic resistance has become a cause of concern globally. The drug pipeline should be replenished from time to time with novel natural or synthetic molecules to provide remedy to the patients from various infections. Similar situation demands for novel active molecules for Babesia too. Recent report by Harbut et al. [48] suggested that Auranofin is having excellent potential to exhibit bactericidal role affecting the thiol-redox homeostasis. Interestingly, it was found in the same study that Auranofin can be used for other gram positive bacteria too such as Bacillus subtilis, Enterococcus faecalis, Enterococcus faecium and Staphylococcus aureus. Auranofin functions through creating oxidative stress for the bacteria through diminishing their reducing capacity. Thus, this potential molecule may become a common purpose inhibitor for several gram positive pathogens.
Following the vital information, similar compounds from the PubChem databases were utilized which showed maximum structural similarity with the auranofin molecule. Total 33 such molecules were selected including different conformations that were used for the docking purpose against the developed structure. Structures having 3D information were only considered. SwissDock server [49] was utilized for this purpose.
Protein dynamics simulation for fluctuations
Fluctuation of protein provides insight in relation to the stability and flexibility of a protein. Simulated molecular motion analysis provides ample information in this regard. Different types of molecular motion analysis were performed for the target protein to understand the flexibility and plausible direction of the motion in the target protein. CABSflex [50] was used for this purpose.
Results and Discussion
The goal of this computational analysis was to retrieve indepth molecular information with relation to the target protein considered for this study. Analyzing the protein in a comparative manner through integrated sequential, structural and functional analyses yielded novel insights for Babesia microti thioredoxin reductase protein. The following result section describes such information in detail.
Sequence retrieval and physicochemical characterization
Initial investigation of the protein sequence suggested some important information that is summarized in the Table 1. The length of the protein was found to be 553 amino acids having overall molecular weight of 60329.49. The higher molecular weight suggests that out of various types of thioredoxin reductase, this protein might have similarity with glutathione reductase, trypanothine reductase and such other enzymes [51].
| S. no. | Property | Value |
|---|---|---|
| 1. | Number of amino acids | 553 |
| 2. | Molecular weight | 60329.49 |
| 3. | Theoretical pI | 7.56 |
| 4. | Total number of negatively charged residues | 56 |
| 5. | Total number of positively charged residues | 57 |
| 6. | Formula | C2687H4276N722O798S27 |
| 7. | Total number of atoms | 8510 |
| 8. | Ext. coefficient | 43945 |
| 9. | Ext. coefficient* | 43320 |
| 10. | Instability index | 31.12 |
| 11. | Aliphatic index | 93.58 |
| 12. | Grand average of hydropathicity (GRAVY) | -0.016 |
| 13. | Estimated half-life (mammalian reticulocytes, in vitro) | >30 |
| 14. | Estimated half-life (yeast, in vivo) | >20 |
| 15. | Estimated half-life (Escherichia coli, in vivo) | >10 |
Table 1. Physicochemical properties of thioredoxin reductase of B. microti determined using protparam.
The enzyme was predicted to be non-crystallizable with 0.463 confidence by CRYSTALP and least crystallizable both in EP crystallization (Class: 3) and RF crystallization classes (Class: 11). SPpred (Soluble Protein prediction) results showed a score indicating that thioredoxin reductase of Babesia microti is a soluble protein.
Theoretical pI of the protein was estimated to be 7.56, suggesting the point where the net charge of the protein could be nil. The theoretical pI value helps in different experimental set up pertaining to the protein for isolation and purification. The extinction coefficient value is another important parameter in relation to experimental calculations providing the absorption value of the protein. The obtained instability index value (Table 1) 31.12 represents the theoretical stability of the protein even after being a quite large molecule. Similarly, the aliphatic index value of 93.58 (Table 1) suggests the major relative volume occupancy of the aliphatic side chains for this Babesia thioredoxin reductase. Grand Average of Hydropathicity (GRAVY) value of -0.016 demonstrates the hydrophilic nature of the protein.
Amino acid composition
Prediction results showed that leucine (Table 2) was the most abundant amino acid followed by glycine and valine. Secondary structure of a protein is representation of repetitive geometrical conformations formed as a result of intermolecular and intramolecular hydrogen bonding. Most of the servers predicted that random coils were predominant structures in the protein followed by alpha helices and extended strands.
| S. no. | Amino acid | Number | Percentage |
|---|---|---|---|
| 1 | Ala | 37 | 6.70% |
| 2 | Arg | 21 | 3.80% |
| 3 | Asn | 29 | 5.20% |
| 4 | Asp | 34 | 6.10% |
| 5 | Cys | 11 | 2.00% |
| 6 | Gln | 12 | 2.20% |
| 7 | Glu | 22 | 4.00% |
| 8 | Gly | 48 | 8.70% |
| 9 | His | 13 | 2.40% |
| 10 | Ile | 38 | 6.90% |
| 11 | Leu | 51 | 9.20% |
| 12 | Lys | 36 | 6.50% |
| 13 | Met | 16 | 2.90% |
| 14 | Phe | 22 | 4.00% |
| 15 | Pro | 23 | 4.20% |
| 16 | Ser | 39 | 7.10% |
| 17 | Thr | 34 | 6.10% |
| 18 | Trp | 3 | 0.50% |
| 19 | Tyr | 18 | 3.30% |
| 20 | Val | 46 | 8.30% |
Table 2. Amino acid composition of thioredoxin reductase of B. microti predicted using protscale.
Eleven cysteines at position 17, 105, 110, 200, 251, 278, 306, 419, 471, 547 and 552 were predicted using CYSRec. Out of these, 7 are not S-S bounded, 1 is probably S-S bounded. Only 2 cysteines (536) showed high score and are probably S-S bounded. Most probable pattern is 105-110.
Proportion of different classes of amino acids in thioredoxin reductase of B. microti is represented in Table 3 suggesting dominance of non-polar amino acids followed by small and polar amino acids. Periodicity of polar and non-polar amino acids along with the existence of disordered regions determines the secondary structure of a protein molecule, especially its tendency of developing α-helices and β-sheets [52].
| S. no. | Property | Residues | Number | Mole (%) |
|---|---|---|---|---|
| 1 | Tiny | (A+C+G+S+T) | 169 | 30.561 |
| 2 | Small | (A+B+C+D+G+N+P+S+T+V) | 301 | 54.43 |
| 3 | Aliphatic | (A+I+L+V) | 172 | 31.103 |
| 4 | Aromatic | (F+H+W+Y) | 56 | 10.127 |
| 5 | Non-polar | (A+C+F+G+I+L+M+P+V+W+Y) | 313 | 56.6 |
| 6 | Polar | (D+E+H+K+N+Q+R+S+T+Z) | 240 | 43.4 |
| 7 | Charged | (B+D+E+H+K+R+Z) | 126 | 22.785 |
| 8 | Basic | (H+K+R) | 70 | 12.658 |
| 9 | Acidic | (B+D+E+Z) | 56 | 10.127 |
Table 3. Mole percentage of different classes of amino acids present in thioredoxin reductase of B. microti using emboss.
Improbability of expression in inclusion bodies for the considered protein was found to be 0.792 suggesting the probable tendency of the protein with reference to its presence in the inclusion bodies and thus hinting the possible way of purifying the same without losing the enzymatic activity. The other important physicochemical properties along with their respective value ranges are provided in Table 4.
| S. no. | Property | Minimum value | Maximum value |
|---|---|---|---|
| 1. | Bulkiness | 0.197 | 0.828 |
| 2. | Polarity | 0.001 | 0.556 |
| 3. | Refractivity | 0.108 | 0.515 |
| 4. | Recognition factor | 0.065 | 0.632 |
| 5. | Hydrophobicity (Kyte and Doolittle) | 0.246 | 0.819 |
| 6. | Transmembrane tendency | 0.329 | 0.839 |
| 7. | Buried Residues | 0.218 | 0.846 |
| 8. | Accessible residues | 0.323 | 0.701 |
| 9. | Ratio hetero end/side | 0.030 | 0.442 |
| 10. | Average area buried | 0.115 | 0.542 |
| 11. | Average flexibility | 0.329 | 0.852 |
| 12. | Relative mutability | 0.218 | 0.767 |
Table 4. Minimum and maximum values of physicochemical properties of thioredoxin reductase of B. microti predicted using protscale.
Sequential motif analysis
Sequential and structural motifs are majorly conserved in nature and serve as determinant for important structural component or vital supporting functional elements. The protein sequence was subjected to motif analysis and 3 motifs were found to be conserved in the protein sequences which are represented in Table 5.
| Logo | p-value | Start | E-value | Site count | Width |
|---|---|---|---|---|---|
 |
1.27E-15 | 98 | 1.90E+01 | 2 | 13 |
| 1.28E-14 | 540 | ||||
 |
2.30E-23 | 451 | 1.60E+01 | 2 | 21 |
| 1.18E-22 | 399 | ||||
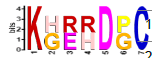 |
1.82E-08 | 211 | 2.50E+01 | 3 | 6 |
| 1.50E-07 | 375 | ||||
| 2.17E-07 | 14 |
Table 5. Motifs discovered in thioredoxin reductase of B. microti using MEME.
Secondary structure analyses from target sequence
A multi-server based analysis was performed to gain insight into the secondary structure of the B. microti thioredoxin reductase protein. Table 6 depicts the obtained result from various tools along with the percentage of secondary structural elements predicted.
| Secondary structure | DSC | HNNC | MLRC | PHD | Predator | Sec. cons. |
|---|---|---|---|---|---|---|
| Alpha helix | 25.50% | 30.56% | 29.66% | 22.24% | 20.43% | 25.50% |
| 310 helix | 0.00% | 0.00% | 0.00% | 0.00% | 0.00% | 0.00% |
| Pi helix | 0.00% | 0.00% | 0.00% | 0.00% | 0.00% | 0.00% |
| Beta bridge | 0.00% | 0.00% | 0.00% | 0.00% | 0.00% | 0.00% |
| Extended strand | 16.64% | 23.69% | 22.06% | 24.41% | 20.25% | 20.25% |
| Beta turn | 0.00% | 0.00% | 0.00% | 0.00% | 0.00% | 0.00% |
| Bend region | 0.00% | 0.00% | 0.00% | 0.00% | 0.00% | 0.00% |
| Random coil | 57.87% | 45.75% | 48.28% | 53.35% | 59.31% | 50.27% |
Table 6. Secondary structure of thioredoxin reductase of Babesia microti predicted using NPS server.
The obtained results hinted towards dominance of coiled structural component followed by helices and extended strands. No further hint was obtained for the other delicate structural components such as 310 helix, Pi helix, beta turns, bend regions or hinge regions. Thus, it is necessary to have structure based secondary structure analysis for minute information missing from the sequence based analysis. As thioredoxin reductase are of different types [51] with difference in structure, mechanism of action, variation in coding genes, therefore, each thioredoxin structure should be analysed with individual attention.
Transmembrane region prediction
As the transmembrane helix regions scoring above 500 only are considered significant, only 2 regions (2-21, 239-266, inside to outside helices) and 1 (96-114, Outside to inside helices) predicted were considered (Figure 1).

Figure 1: Transmembrane region prediction using TMPRED.
Disordered regions in the target protein
Identification of disordered regions in a protein molecule is of vital importance to understand the structural, functional and evolutionary aspect of a protein. It is imperative to understand the disordered regions of this protein considering its structural and functional diversity. The predicted disordered regions are provided in Table 7 and Figure 2.
| S. no | Server | Definition by type | Region |
|---|---|---|---|
| 1 | Pondr | Disordered regions | 172-177, 187-188, 213-218, 336-357, 367-367, 377-382 |
| 2 | DisEMBL | Disordered by loops/coils definition | 4-71, 62-70, 86-112, 133-144, 180-195, 208-240, 289-322, 327-380, 394-423, 456-481, 488-495, 509-553 |
| Disordered by hot-loops definition | 93-103, 134-145, 167-196, 208-217, 460-469, 536-553 | ||
| Disordered by Remark-465 definition | 538-553 | ||
| 3 | GLOBPLOT | Disordered by Russell/Linding definition | 61-71, 92-106, 210-219, 230-237, 463-468, 536-553 |
| Potential globular domains (GlobDoms) by Russell/Linding definition | 1-91, 107-551 |
Table 7. Disordered regions by definition using different servers.

Figure 2: Protein disorder of thioredoxin reductase of Babesia microti predicted using (a) PONDR, (b) GLOBPLOT (c) IUPRED (d) DisEMBL and (e) PRDOS.
Sequence-structure conservation analysis
Consurf server [23,24] was used for finding the evolutionary significance of amino acids in thioredoxin reductase protein sequence of B. microti with the default options of BLAST Evalue threshold: 0.001, maximum number of homologs: 50, iteration=1. Multiple sequence alignment was built using MAFT and UNIREF90 was used for collection of homologues using HMMER homology search algorithm. Out of 1366 HMMER hits, 1242 were found to be unique and the calculation was performed on the 50 sequences closest to the query. The conservation scores versus residue number and the unrooted phylogenetic tree constructed using the tree building facility of CLUSTAL-W employing the multiple sequence alignment obtained from MUSCLE are shown in Figure 3.

Figure 3: Consurf results showing conserved amino acid with scores.
Structure generation through homology modeling
As mentioned in the methodology section, homology modeling for the target sequence was attempted using Modeller 9.19 version. Following the protocol discussed, profile was built and relevant structures were searched through Modbase. Rigorous experiment was conducted to develop a model from a single template where PDB ID 2x99 chain “A” (best template found through SwissModel server) and 1mo9 chain “A” (best template found in Modbase template search) were used as templates. But due to template-target length difference, single template based approach was not adequate to provide expected result. Therefore, a multi-template based approach was adopted. Figure 4A shows the potential important templates obtained during template search along with their respective sequence identity, structural resolution and sequence coverage. Altogether, twenty one (21) templates were obtained and the best identity and templates with good structural resolution containing (1mo9A, 1xhcA, 1nhpA, 1xdiA, 1lvlA, 1h6vA, 1q1rA and 2x99A) were considered for multi-template based modeling (Figure 4B). Generated target-template alignment is shown in Figure 5.

Figure 4: Template selection for three dimensional structural development through modeller. (A) The obtained initial hits as templates. (B) Comparative identity of the selected templates for multi-template based modelling.

Figure 5: Generated target sequence and multiple template alignment.
Once the target-template alignment was generated, ten protein structures were developed for the target protein using the multi-template and target sequence alignment. All the proteins were further subjected to evaluation through molpdf, DOPE and GA341 scoring. The obtained results are displayed in Table 8 along with their respective model numbers. The 4th model was found to be comparatively good based on the above mentioned evaluation scoring and was considered for the further analysis. The obtained model is represented in new cartoon format and surface view in Figure 6. The developed structure showed the alpha helices and beta sheets almost similar to other thioredoxin reductase proteins along with some long loops.
| Model number | molpdf | DOPE | GA341 |
|---|---|---|---|
| Model 4 | 27163.44336 | -55457.5 | 1 |
| Model 1 | 26907.65625 | -55397.7 | 1 |
| Model 10 | 26742.1875 | -55374.7 | 1 |
| Model 7 | 26880.80469 | -55139.8 | 1 |
| Model 8 | 26782.80469 | -54850.4 | 1 |
| Model 6 | 27027.62305 | -54804.3 | 1 |
| Model 5 | 27123.99609 | -54774.9 | 1 |
| Model 2 | 27446.76563 | -54381.3 | 1 |
| Model 3 | 27149.9707 | -54333.4 | 1 |
| Model 9 | 27038.10547 | -54202.5 | 1 |
Table 8. Molpdf, DOPE score and GA341 score of best ten three dimensional structural models developed with multiple templates.

Figure 6: Three dimensional structure of thioredoxin reductase of B. microti visualized using VMD. (A) Representation of the a helices (purple), ß sheets (yellow) and loops (cyan) of the final protein generated after loop optimization through multiple-template based modeling approach. (B) Surface view of the protein where purple colored surface refers to the a-helix region and cyan loops.
Loop optimization of the best structure
The existence of multiple loops suggested the further need for loop optimization. Therefore, all loop regions with poor energy profile and structural orientation were identified using energy profiling and structural evaluation and visualization and the structure was subjected to loop optimization.
The evaluation scores for the 10 models developed during loop optimization considering the previous multi-template based best structure as starting structure are provided in Table 9. The model 8 was found to be the best loop optimized model and was considered for all relevant analysis. Figure 7 represents the structures with loops after optimization.
| Structure model number | molpdf | DOPE |
|---|---|---|
| Model 8 | 1184.14331 | -10252.12012 |
| Model 2 | 1651.75635 | -9835.49707 |
| Model 1 | 903.81464 | -9727.25488 |
| Model 4 | 2020.79944 | -9114.76074 |
| Model 9 | 5959.34863 | -8566.29785 |
| Model 6 | 3826.18115 | -8330.34473 |
| Model 5 | 4257.93311 | -8059.69629 |
| Model 3 | 5646.4541 | -8047.19873 |
| Model 7 | 4218.79346 | -7961.8457 |
| Model 10 | 6321.50342 | -7790.62402 |
Table 9. molpdf and DOPE score of best ten loops optimized three dimensional structural models developed with multiple templates.

Figure 7: Three dimensional structure of thioredoxin reductase of B. microti with the loops optimized for 10 structures visualized using chimera.
Structure validation
The final structure was identified after the loop modeling and subjected to superimposition with the considered multiple templates. The obtained RMSD was within the allowed region for most of the templates. The superimposition of the final modeled structure with multiple templates is shown in Figure 8. Respective RMSD value ranges and distance observed between the target and the templates are represented in Figure 9. The RMSD values ranged from 0.506 Å to 2.457 Å.

Figure 8: Superimposed target-template structures. The target is represented in light grey and all other templates are depicted in various other colors superimposed with the target protein molecule.

Figure 9: Target-templates superimposition distance matrix with distance values and standard deviations. This is a 2D matrix representation of the target and the template proteins where ranges of deviations are represented in angstrom.
The final structure was further evaluated for stereo-chemical structural quality through various standard tools such as RAMPAGE [44], PROSA [53] and ANOLEA.
RAMPAGE analysis
Stereochemical quality of model was checked using RAMPAGE server (Figure 10). Ramachandran plot obtained using RAMPAGE revealed that 90.2% of residues were within the most favored regions. Residues falling in additionally allowed regions and outlier residues in outlier region were 7.1 % and 2.7% respectively.

Figure 10: Stereochemical quality check using RAMPAGE.
Validation through PROSA
PROSA (Protein Structure Analysis) was used to evaluate the quality of 3D models of protein structures. Z-score is a measure of overall model quality and denotes the deviation of the total energy of the structure compared to energy distribution derived from random conformations. The PROSA score was -7.71 for the modeled protein, which indicates its correctness.
PROSA profile for the target protein model was found better than all other template structures (PDB ID: 1mo9, chain “A”-11.77; PDB ID: 2x99, chain “A”-11.87; PDB ID: 1xhc, chain “A”-9.98; PDB ID: 1nhp, chain “A”-12.77; PDB ID: 1xdi, chain “A”-11.07; PDB ID: 1lvl, chain “A”-11.0; PDB ID: 1h6v, chain “A”-10.93 and PDB ID: 1q1r chain “A”-11.43). Zscore computed by PROSA for thioredoxin reductase of B. microti was found to be better than the Z-score of all the templates (Figure 11A). Negative values in PROSA plot with comparison to the knowledge based energy values indicated the stable regions of the protein and authentic model development (Figure 11B).

Figure 11: PROSA analysis of the modeled structure for structural evaluation (A) The black dot shows the position of the modeled structure with comparison to the existing X-ray crystallography generated and NMR based structures. (B) Comparative estimation of the energy profile with relation to the knowledge-based energy profiles. (C) Depiction of the structure based on the energy values where “blue” represents lowest energy and “red” represents highest energy in the protein.
Analysis by ANOLEA
Analysis of the modeled protein structure with ANOLEA (Atomic Non-Local Environment Assessment) [53] also provided expected outcome. The analysis was conducted with a window size of 9 amino acids. The results suggested that out of 553 amino acids, only 114 (20.61%) showed comparatively higher energy. The Figure 11C also provided the similar information with a structural view. Computed non-local normalized energy Z-score of 2.80 was considerable for this large protein. The amino acids with high energy values were residue number 42; 52-56; 99-101; 132-135; 137-139; 151; 212; 228-233; 256; 310-318; 332-337; 351-354; 440-460; 494-498; 500-501; 507-539; 541-549.
Structural topological analysis
Structural topological analysis is important for this protein considering its complex structural and functional diversity. The outcome of the PROMOTIF topological analysis is provided in Figure 12.

Figure 12: Complex protein topology displaying the direction of multiple helices and parallel and anti-parallel beta sheets generated for the target protein.
The figure depicts the alpha helices, parallel and anti-parallel beta sheets and loop regions in detail along with the residue numbers. It is evident that the overall structure contains 22 β- sheet regions, 19 helices and several loop regions.
Secondary structural analysis from structure
Detail secondary structural analysis was performed for the final protein structure developed. The post loop optimized best structure was utilized for this purpose and PROMOTIF was considered for the analysis.
As expected, the alpha helix portion was found to be maximum in the structure with 179 amino acids out of 553 being part of it which was 32.4% followed by the strand portion (108 amino acids (19.5%)). 3-10 helix structures were found to be comprising of 5 amino acids (0.9%) and other important structural component were constituted by 261 (47.2%) amino acids. The overall structure contains several structural components such as beta sheets, beta-alpha-beta structural unit, beta-hairpins, beta-bulges, strands, helices, helix-helix interactions, beta turns, gamma turns and disulphide linkage. The detail description is provided in the following section.
Beta sheets: Total 6 beta sheets were found in the Babesia thioredoxin reductase structure. The number of strands varied from 2 to 5 as shown in Table 10. No barrel like structures were found for these predicted sheets. Presence of parallel and anti-parallel sheets were observed for this structure as represented with their respective topology in Table 10.
| Sheet | No. of strands | Type | Barrel | Topology |
|---|---|---|---|---|
| A | 4 | Parallel | No | -1X 2X 1X |
| B | 3 | Antiparallel | No | 1 1 |
| C | 2 | Antiparallel | No | 1 |
| D | 5 | Parallel | No | -2X -1X -1X 3X |
| E | 3 | Antiparallel | No | 1 1 |
| F | 5 | Antiparallel | No | -1 -3 1 1 |
Table 10. Beta sheets present in the modeled structure along with number of strands, type and topology.
Beta-alpha-beta units: Beta-alpha-beta units are important structural components of thioredoxin reductase structure. Table 11 represents the strands along with the start, end residues and residues distributed in the helix and loop regions. This topology suggests the presence of alpha helical region sandwiched by beta sheets and most of the time such structural arrangement serves as a conserved topology in a protein structure.
| Strand 1 | Strand 2 | No. of helices | No. of residues | |||||
|---|---|---|---|---|---|---|---|---|
| Start | End | Length | Start | End | Length | No. of residues in loop | No. of residues in helices | |
| Tyr 59 | Ile 64 | 6 | Val 84 | Phe 87 | 4 | 1 | 19 | 14 |
| Lys 238 | Val 242 | 5 | His 261 | Val 266 | 6 | 1 | 18 | 14 |
| His 261 | Val 266 | 6 | His 292 | Tyr 295 | 4 | 1 | 25 | 15 |
Table 11. Distribution of the amino acid residues in the beta-alpha-beta units.
Beta-hairpins units
The beta-hairpin structural components suggest the presence of the anti-parallel beta sheets separated by a short loop region. Obtained structural regions are listed in Table 12 along with their respective hairpin class. Many hairpin classes were observed as provided in Table 12. Beta hairpin structural elements often indicate the folding pattern of a protein molecule and aid in unraveling the protein folding.