Research Article - Biomedical Research (2017) Volume 28, Issue 12
Pulse based sensor design for wrist pulse signal analysis and health diagnosis
Krittika Goyal* and Ravinder AgarwalDepartment of Electrical and Instrumental Engineering, Thapar University, Punjab, India
- *Corresponding Author:
- Krittika Goyal
Department of Electrical and Instrumental Engineering
Thapar University, India
Accepted date: October 24, 2016
Abstract
Pulse diagnosis is a common non-invasive method for measurement of health of person in Ayurveda. According to Ayurveda, the root cause of the disease is imbalance of three doshas i.e. vat, pit and kaph. The health status of the person is examined by Ayurvedic physician by feeling palpation from three fingers (index, middle and ring) placed on the radial artery for vat, pit and kaph respectively. Examination of the pulse (Nadi Parikshan) requires a lot of experience in pulse reading. It depends upon the perception of the practitioner, hence there is a need to develop pulse diagnosis system to obtain accurate diagnosis of disease. In present research work the design and development of the pulse diagnosis system was carried out, in which sensor MPXM2053D sensor from FREESCALE was used to sense the wrist pulse signals from 42 subjects. Thereafter, the signal conditioning circuit was designed using instrumentation amplifier. Real time monitoring was performed using myRIO DAQ card in LabVIEW myRIO 2014 and filtering was performed in Matlab. Frequency domain analysis using power spectrum was carried out and features such as band energy ratio were extracted. An interpretation of useful features to distinguish between healthy and unhealthy subject using statistical ANOVA analysis along with t test was carried out. Different classifiers were used to classify healthy and unhealthy subject and results were obtained with high accuracy, sensitivity and specificity. Thus wrist pulse acquisition system developed for pulse diagnosis will be a helpful tool for diagnosis of healthy and unhealthy person.
Keywords
Pulse diagnosis, Wrist pulse signal, Band energy ratio, DAQ card.
Introduction
Pulse diagnosis means an examination of pulse and in Ayurveda, it is known as Nadi Parikshan. Examination of the pulse as a diagnostic tool was recognized by Indian physicians in twelfth century A.D. [1]. Sarangadhara Sanhita, an authentic book of Ayurveda states that the pulse at the wrist signifies the presence of life. The physician should recognize health and ill health of person from the activities of the pulse at wrist [2]. Ayurvedic physician use the pulse to determine heart rate as well as feel the patterns of vibration that represent the status of the body and mind at a specific time. Ayurvedic practitioner places three fingers 2 cm up the wrist with index finger placed near the thumb on radial artery corresponding to each of the three doshas as shown in Figure 1. The index finger senses the vat pulse, the middle finger senses the pit pulse and the ring finger senses the kaph pulse. The different characteristics of the pulses have been indicated in Table 1. When dominance of any dosha or combination of doshas is observed disease is found through proper examination of pulse. Since it is a noninvasive method so it should be used to know the health status of subject. It requires a lot of experience to learn pulse diagnosis technique so an acquisition device needs to be developed for novice practioners.
| VAT | PIT | KAPH | |
|---|---|---|---|
| Location | Index Finger | Middle Finger | Ring Finger |
| Movement | Spiral | Jumping | Symmetrical |
| Speed | Irregular | Fast | Slow |
| Volume | Low | Full | Full |
Table 1: Characteristics of pulses.

Figure 1: Standard positions to obtain pulse.
To develop pulse diagnosis acquisition systems, a lot of effort has been made worldwide. A wrist pulse signal is produced by cardiac contraction and relaxation of heart and it is related to central aortic pressure waveform [3]. Pulse is felt at radial artery and the fluctuations are felt. Different types of sensors working on different principle have been used to measure the pressure exerted by blood in radial artery. Sensor based on strain gauge was used and time series data acquired gave reproducible waveforms [4]. Portable prototype was made using sensor working on principle of photoplethysmography and validation of the device performed using neural network [5]. Bulkiness of the device for wrist pulse acquisition remained a challenge in this field [6]. Sensor working on ultrasonic frequency was utilized for capturing of wrist signal and t test statistical analysis performed [7]. Device named Nadi Yantra was developed and acquiring of signals was performed using Biopac 150 data acquisition system [8]. Along with hardware implementations a lot of research have been done in analysis of wrist pulse signal in time and frequency domain and pulse classifiers. Wrist pulse signal analysis have been performed involving power spectrum estimate of pulse signal for identifying the frequency of pulse in healthy and unhealthy subject [9,10]. An architecture designed using three main sensors and subsensors as well as pressure adjustment module and classification with SVM classifier was an attractive development [3]. The irregularities associated with unhealthy and healthy subject and reduced features were classified by using support vector machine [11]. Acquiring of the wrist pulse signal can be performed by using acquisition systems such as NIcDAQ9174 chassis and analog DAQ card (NI9129) [12], Biopac data acquisition system and many more. Replicating fingers of physician in pulse diagnosis is a big challenge, the proper design of hardware along with significant feature extraction and classification may lead to a non invasive device which can eliminate human error performed manually by Indian practitioners in the disease diagnosis.
Design of Experimental Setup
The basic building blocks of wrist pulse acquisition system are depicted in Figure 2. The system was used to build a single channel wrist pulse acquisition experimental setup consisting of a piezoresistive sensor MPXM2053D, instrumentation amplifier INA128, and DAQ card myRIO for data acquisition.

Figure 2: Block diagram for wrist pulse acquisition system.
Wrist pulse is a pressure signal; hence a pressure sensor was used to acquire a pulse signal. There are number of pressure sensors available with a different principle, e.g., piezoelectric and strain gauge based sensors. Both the sensors can be used for human pulse detection but both have different advantages and disadvantages. Both strain gauge and piezoelectric meet the requirement but in present research, piezoresistive pressure sensor was used because piezoelectric sensor requires shielding. Also, piezoresistive sensors provide both static and dynamic response. Hence, piezoresistive sensor MPXM2053D from FREESCALE of suitable size and sensitive to variation in pressures was used. It has the dimensions of of 9.1 mm ×7 mm, dimensions of the sensor are suitable as they are similar to that of surface area covered by a finger tip. It provides a wide range for measurement i.e., 0 to 50 kPa or 0 to 375 mm of Hg [13]. It is highly suitable for biomedical applications since systolic blood pressure ranges from 140 mm of Hg to 190 mm of Hg and diastolic pressure ranges from 90 mm of Hg to 100 mm of Hg. Since, MPXM2053D was available in form of a surface mounted device as shown in Figure 3, after proper soldering it was connected to dual in line package devices. The sensor was placed in suitable position i.e., 2 cm up the wrist to sense waveform. To hold the sensor in its position a wrist band was used to apply a suitable amount of pressure so that diaphragm of the sensor was in contact with radial artery at the wrist and the pressure or vibration of blood flow could be sensed. The signal was picked up by the sensor and transmitted to amplifier.

Figure 3: Soldered SMD MPXM2053D sensor.
Instrumentation amplifier INA128, was used to amplify the differential output of the sensor. It has high common mode rejection ratio, which helps in removing common mode signal that is noise. It provides high bandwidth even at high gain. Simulation was performed using Multisim software as shown in Figure 4. Function generator was given as an input to operational amplifier. The output of operational amplifier was observed on an oscilloscope. The pin configuration of INA128 and AD620 is similar so AD620 was available in multisim and thus used for simulation. After performing simulation circuit was implemented on hardware. Signal obtained from sensor was mV signal so wrist pulse signal was amplified with gain of 100. Value of the gain resistor was decided according to formula as mentioned in the datasheet [14].

Figure 4: Simulation using Multisim.
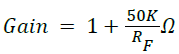
Here, RF is 500 Ω, So Gain is equal to 100.
For capturing signal, NI myRIO DAQ card was used, DAQ device is essentially an analog to digital convertor [15]. Signal acquired was very low in amplitude and full of common mode noise so the myRIO DAQ card was found suitable choice for this work as it provides differential mode of operation. The hardware required for myRIO device is adapter, USB cable and myRIO Card as shown in Figure 5. Software required to operate myRIO device are LabVIEW, LabVIEW Real time module, LabVIEW myRIO toolkit. In the present research work single channel wrist pulse acquisition system was designed in which single piezoresistive sensor was used to sense wrist pulse signal which was amplified using instrumentation amplifier and collected through myRIO DAQ card. The connections are as shown in circuit diagram in Figures 6 and 7.

Figure 5: myRIO device with USB cable and adaptor.

Figure 6: Circuit diagram of single channel system.

Figure 7: Experimental setup of hardware.
The sensor produced differential output, which was given to inverting and non inverting pins of the instrumentation amplifier as input. Ground and positive power supply were provided with the myRIO DAQ card. MPXM2053D sensor required power supply of the order of 10 to 16 V and instrumentation amplifier required power supply of the order of 2.5 to 18 V. Also, the sensor and instrumentation amplifier required three terminal power supply that is positive, negative and ground. Initially, power supply with three terminals was designed but there was a problem of discharging of batteries with time and maximum power supplied was that of 9 V at which sensor did not work properly. So, this power was extracted from the myRIO DAQ card as it is capable of providing +15 V, -15 V and ground. Hence, proper connections were made and addressed properly in software to perform interfacing of device with a computer.
Methodology
Forty Two (42) Subjects information was collected, consisting of 28 healthy and 14 unhealthy subjects for recording wrist pulse signal. The subject was requested to fill a consent form consisting basic information of the subject regarding acute or chronic diseases. Thereafter, the subject was made to relax and seated with his or her elbow in resting position. Data was collected at the same time between 7 am to 9 am for all subjects at normal room temperature according to comfort of subject. Data was obtained for 5 min of each subject at sampling rate of 1000 Hz. Sampling rate of DAQ device was set by using timed loop in Labview myRIO 2014. About 1 minute data, 60000 samples were left in the beginning of each subject to ensure circuit stabilization. The data was acquired in Labview myRIO 2014 as shown in Figure 8 and samples were exported and stored in excel sheets. A Matlab program was made to plot power spectrum. Filtering was performed in Matlab using low pass butterworth filter of order 2. The whole process of the recording and analysis is given in flow chart in Figure 9.

Figure 8: Experimental setup for acquiring a pulse signal.

Figure 9: Flowchart for processing of data.
Results and Discussion
Wrist pulse signal was acquired using designed wrist pulse acquisition system. The wrist pulse signal was acquired using DAQ device in LabVIEW and graphical user interface made to observe and perform real time monitoring as shown in Figure 10. Waveform of the pulse signal was obtained as desired and found a good match with the literature waveform [16]. Raw Signal of healthy and unhealthy subject is shown in Figures 11 and 12 respectively. Waveforms obtained were noisy, so in order to know the difference, filtering was performed. Wrist pulse signal is an low frequency signal, so to know the cut off frequency for filtering power spectrum analysis was perfromed. Power spectrum provided information that all the frequency components were contained in 0 Hz to 30 Hz as shown in Figure 13.

Figure 10: Real time monitoring with GUI.

Figure 11: Raw signal of healthy subject.

Figure 12: Raw signal of unhealthy subject.

Figure 13: Filtered signal of healthy subject.
The energy increase beyond 5 Hz in the unhealthy subject which can be used as a distinguishing feature for healthy and unhealthy subject as shown in Figure 14. Low pass Butterworth filter of order 2 was designed in Matlab and filtered waveforms of healthy and unhealthy subject were obtained are shown in Figures 15 and 16 respectively. It was observed that the waveform of unhealthy subject was little undistorted and broadened as compared to the waveform of healthy subjects. It was observed that the waveform of unhealthy subject was little undistorted and broadened as compared to the waveform of healthy subjects. Frequency domain analysis was carried out and features such as band energy ratio was calculated to determine the energy distribution in the range of 0-30Hz. Band energy ratio refers to percentage energy in the particular band divided by total energy within that band [17]. It can be determined by using the following formula:

Figure 14: Filtered signal of unhealthy subject.

Figure 15: Power spectrum of wrist pulse signal.

Figure 16: Comparison between power spectrum of healthy and unhealthy subject.
BER (n)=(En/ET)*100
where, BER (n) is the band energy ratio of nth band in percentage,
n is band of frequency
En is energy present in nth band
ET is the total energy in 0-30 Hz.
A signal of 30 Hz total frequency range was divided into bands of 3 Hz each. Then, total 10 bands were obtained. In each band of frequency, BER was calculated and plotted in a bar graph as shown in Figure 17. It was observed that the maximum amount of energy lies between 0-3 Hz. In healthy and unhealthy subject energy in 0-3 Hz was more than 80 percent. For unhealthy subject, in bands 3-6 Hz, 6-9 Hz and 9-12 Hz it was greater than from that of healthy subject. The major proportion of energy of wrist pulse signal lies from 0-3 Hz in both healthy and unhealthy subject and percentage of energy varies from band of 3-12 Hz.

Figure 17: Comparison between BER of healthy and unhealthy subject.
Statistical analysis and classification
Ten feature values obtained for detection of a healthy and unhealthy person increase complexity. To reduce the number of features and determine useful and significant features, they were analyzed statistically for finding the best feature or combination of features for distinguishing between healthy and unhealthy subject. Analysis of variance using Anova technique was performed and features were named 1 to 10 according to bands. On applying ANOVA: single factor on all the features, F4, F1 and F7 features having P value less than 0.05 (P<0.05) were obtained. So, these were analysed as significant features from 10 features which could be used for distinguishing between healthy and unhealthy person as shown in Table 2.
| K-Fold | ||||||
|---|---|---|---|---|---|---|
| Feature | P value | acc_KNN | acc_SVM | acc_LDA | acc_QDA | acc_DT |
| F4 | 0.00019 | 96.03 | 92.32 | 89.94 | 93.38 | 96.03 |
| F1 | 0.009 | 95.55 | 66.66 | 75.55 | 80 | 75.55 |
| F7 | 0.03 | 93.38 | 78.3 | 68.78 | 69.04 | 76.19 |
| F3 | 0.09 | 93.33 | 37.77 | 62.22 | 42.22 | 80 |
| F2 | 0.28 | 93.33 | 80 | 71.11 | 75.55 | 84.44 |
| F6 | 0.3 | 89.41 | 72.22 | 57.14 | 62.43 | 66.67 |
| F8 | 0.33 | 88.89 | 71.11 | 66.66 | 69.44 | 68.88 |
| F9 | 0.35 | 88.88 | 60 | 57.777 | 57.77 | 73.33 |
| F5 | 0.54 | 86.66 | 71.11 | 68.8 | 71.11 | 80 |
| F10 | 1 | 80 | 53.33 | 60 | 60 | 62.2 |
Table 2: Analysis of Variance using ANOVA for K-fold.
Classifier is the algorithm that helps in identification of the classification process. In the present study two classes are healthy and unhealthy and different classifiers were used to identify subjects belonging to two classes. Classification was done by using various classifiers such as K- nearest neighbour (KNN), support vector machine (SVM), linear discriminant analysis (LDA), Quadratic discriminant analysis (QDA), Decision tree (DT). To check the reliability of classifier, validation was performed by K-fold cross and Leave-one-out validation procedures. Also parameters such as accuracy, sensitivity, specificity were calculated to indicate performance of the classifier. They are described as follows:
Confusion matrix: It refers to a table that describes the performance of classifier given by

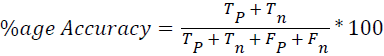
Accuracy: Accuracy refers to the number of correct predictions made divided by the total number of predictions made [16].
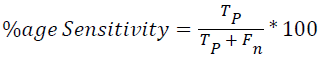
Sensitivity: Sensitivity refers to the fraction of positives that are actually identified as such. It is the true positive rate of test [16].
Specificity: Sensitivity refers to the fraction of negatives that are actually identified. It is the true negative rate of test [16].
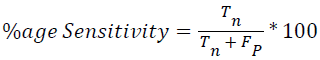
where, TP is True positive, Tn is True negative, Fp is False positive and Fn is False negative.
For the significant features calculated using ANNOVA in Table 2, accuracy was calculated by using two validation techniques. Thus, in terms of accuracy (inverse of P value) maximum accuracy was obtained in features F4, F1, F7 which were inferred as significant features. Accuracy achieved for F4 having highly significant P=0.00019 was found to be maximum from all other features in all the classifiers. Accuracy achieved for F1 with P value as 0.009 had accuracy greater than other features but less than F4, since P value of F4 was less than P value of F1 as per single factor ANOVA test. So, F4 was found to have least P value and hence the most accuracy. Tables 2 and 3 show analysis of variance using Anova for K-fold and Leave-one-out respectively. Similar results were found with both the validation approach.
| Leave one out | ||||||
|---|---|---|---|---|---|---|
| Feature | P value | acc_KNN | acc_SVM | acc_LDA | acc_QDA | acc_DT |
| F4 | 0.00019 | 96.29 | 93.38 | 87.56 | 93.38 | 96.2 |
| F1 | 0.009 | 92.59 | 75.39 | 74.33 | 78.57 | 84.12 |
| F7 | 0.03 | 92.32 | 72.75 | 74.33 | 70.37 | 71.42 |
| F3 | 0.09 | 92.06 | 59.52 | 73.5 | 74.8 | 79.62 |
| F2 | 0.28 | 91.53 | 76.45 | 65.34 | 65.87 | 74.8 |
| F6 | 0.3 | 91.2 | 48.9 | 60.58 | 48.94 | 75.66 |
| F8 | 0.33 | 90.74 | 64.02 | 62.4 | 60.05 | 73.5 |
| F9 | 0.35 | 90.2 | 64.5 | 65.34 | 63.22 | 66.9 |
| F5 | 0.54 | 89.68 | 46.82 | 62.16 | 62.16 | 73.2 |
| F10 | 1 | 86.7 | 60.05 | 66.66 | 68.25 | 65.87 |
Table 3: Analysis of Variance using ANOVA for Leave-one-out.
Tables 4-6 show the performance of various classifiers in terms of accuracy, sensitivity and specificity for K-fold cross validation. It was found that F4 which was calculated as most significant feature have maximum accuracy for all the classifiers. Accuracy achieved with combination of F4 and F1 was lesser than accuracy achieved with F1. Hence use of F4 alone provides good accuracy, it is redundant to use other significant features. F4 feature, frequency between 9-12 Hz is sufficient to provide information about healthy and unhealthy subject. Figure 18 shows the comparative study of all the classifiers in terms of accuracy, which indicates that KNN provides highest accuracy and F4 is most significant feature.
| Accuracy | |||||
|---|---|---|---|---|---|
| Classifier | F4 | F1 | F7 | F4+F1 | F4+F1+F7 |
| KNN | 96.03 | 95.55 | 93.38 | 95.55 | 97.77 |
| SVM | 92.32 | 66.66 | 78.3 | 91.11 | 90.08 |
| LDA | 89.94 | 75.55 | 68.78 | 97.77 | 96.01 |
| QDA | 93.38 | 80 | 69.04 | 95.2 | 86.67 |
| DT | 96.03 | 75.55 | 76.19 | 97.77 | 96.77 |
Table 4: Performance of various classifiers in terms of accurcay for K-fold.
| Sensitivity | |||||
|---|---|---|---|---|---|
| Classifier | F4 | F1 | F7 | F4+F1 | F4+F1+F7 |
| KNN | 100 | 92.53 | 98.01 | 100 | 100 |
| SVM | 100 | 100 | 100 | 100 | 100 |
| LDA | 100 | 100 | 100 | 100 | 100 |
| QDA | 100 | 100 | 100 | 100 | 71.66 |
| DT | 100 | 67.86 | 100 | 100 | 100 |
Table 5: Performance of various classifiers in terms of sensitivity for K-fold.
| Specificity | |||||
|---|---|---|---|---|---|
| Classifier | F4 | F1 | F7 | F4+F1 | F4+F1+F7 |
| KNN | 95.14 | 95.89 | 86.87 | 97.77 | 96 |
| SVM | 91.53 | 88.83 | 71.02 | 97.77 | 96 |
| LDA | 87.64 | 70.04 | 70.8 | 97.77 | 96 |
| QDA | 91.48 | 70.25 | 69.64 | 92 | 96 |
| DT | 95.14 | 85.85 | 74.06 | 97.77 | 96 |
Table 6: Performance of various classifiers in terms of sensitivity for K-fold.

Figure 18: Comparison of accuracy of various classifiers for K-fold.
Table 7-9 shows the performance of various classifiers in terms of accuracy, sensitivity and specificity for Leave-one-out cross validation. Similar results were found with Leave-one-out as that of K-fold cross validation.
| Accuracy | |||||
|---|---|---|---|---|---|
| Classifier | F4 | F1 | F7 | F4+F1 | F4+F1+F7 |
| KNN | 96.29 | 92.59 | 92.32 | 96.29 | 96.56 |
| SVM | 93.38 | 75.39 | 72.75 | 92.59 | 92.85 |
| LDA | 87.56 | 74.33 | 74.33 | 97.35 | 97.08 |
| QDA | 93.38 | 78.57 | 70.37 | 96.03 | 90.74 |
| DT | 96.2 | 84.12 | 71.42 | 97.35 | 97.08 |
Table 7: Performance of various classifiers in terms of accurcay for Leave-one-out.
| Sensitivity | |||||
|---|---|---|---|---|---|
| Classifier | F4 | F1 | F7 | F4+F1 | F4+F1+F7 |
| KNN | 100 | 96.62 | 98.09 | 100 | 98.41 |
| SVM | 100 | 100 | 100 | 100 | 100 |
| LDA | 100 | 100 | 100 | 100 | 100 |
| QDA | 100 | 100 | 100 | 100 | 88.61 |
| DT | 100 | 100 | 63.65 | 100 | 100 |
Table 8: Performance of various classifiers in terms of sensitivity for Leave-one-out.
| Specificity | |||||
|---|---|---|---|---|---|
| Classifier | F4 | F1 | F7 | F4+F1 | F4+F1+F7 |
| KNN | 94.19 | 90.3 | 91.21 | 96.85 | 95.79 |
| SVM | 90.7 | 81.94 | 71.47 | 95.46 | 91.91 |
| LDA | 83.34 | 65.13 | 71.78 | 96.46 | 95.58 |
| QDA | 90.57 | 65.1 | 71.39 | 97.85 | 94.09 |
| DT | 94.19 | 82.18 | 78.9 | 96.8 | 95.79 |
Table 9: Performance of various classifiers in terms of sensitivity for Leave-one-out.
t-Test paired two sample for means (P (T ≤ t) one -tail) for both K-fold and leave-one-out was performed in order to further validate the results as it compares two dependent sets of test data and helps to determine if the means are different from each other. In the present study, value of P (T ≤ 0.05) was calculated between different combinations of features. It was found that values coloured grey in Tables 10 and 11 were less than 0.05 and hence were different from each other. F4, F1 and F7 were different while their combination of features with respect to individual feature was not found to be different. Hence F4 plays the role of most significant feature (Figure 19).
| F4 | F1 | F7 | F4+F1 | F4+F1+F7 | |
|---|---|---|---|---|---|
| F4 | - | 0.012 | 0.0063 | 0.144 | 0.48 |
| F1 | 0.012 | - | 0.355 | 0.009 | 0.013 |
| F7 | 0.0063 | 0.355 | - | 0.009 | 0.006 |
| F4+F1 | 0.144 | 0.009 | 0.009 | - | 0.158 |
| F4+F1+F7 | 0.48 | 0.013 | 0.006 | 0.158 | - |
Table 10: T-Test paired two sample for means(P(T<=t) one -tail) for K–fold.
| F4 | F1 | F7 | F4+F1 | F4+F1+F7 | |
|---|---|---|---|---|---|
| F4 | - | 0.003 | 0.005 | 0.124 | 0.25 |
| F1 | 0.003 | - | 0.063 | 0.0048 | 0.005 |
| F7 | 0.005 | 0.063 | - | 0.0042 | 0.0037 |
| F4+F1 | 0.124 | 0.0048 | 0.0042 | - | 0.187 |
| F4+F1+F7 | 0.25 | 0.005 | 0.0037 | 0.187 | - |
Table 11: t-Test paired two sample for means(P(T<=t) one -tail) for Leave-one-out.

Figure 19: Comparison of accuracy of various classifiers for Leaveone- out.
Conclusion
Wrist Pulse signals present an interesting solution for diagnose of healthy and unhealthy subjects based on non-invasive method of pulse diagnosis with the help of wrist pulse acquisition system. Piezoresistive sensor, MPXM2053D gave the satisfactory pulse waveform and provided wrist pulse signal. Band energy ratio provided information about energy of signal in 0-30 Hz band. After performing ANOVA statistical analysis on different features, it is concluded that F4, that is 3Hz to 12 Hz is best suited frequency band to distinguish between healthy and unhealthy subject. Also the comparative study performed by various classifiers for K- fold and leaveone- out validation approach provides accuracy range for classifier design achieving maximum accuracy of 96.29% with KNN. Further t- test provides information and validation of the difference in significant features. The design of wrist pulse acquisition system and knowledge of significant band of frequency as done in this paper will act as helping tool for the researchers in understanding wrist pulse signal.
Acknowledgement
The authors express their thanks to Dr. B.P Kaushik and Dr. N.K. Sharma of Government Ayurvedic College and Hospital, Patiala for providing useful information to carry out this research work. This research work has been carried out in Biomedical Research Lab at Thapar University, Patiala, Punjab.
References
- Frawley D. The Biological Humors, The Dynamics of the Life-Force. Ayurvedic Healing: A Comprehensive Guide. Lotus Press, New Delhi, 2000.
- Murthy KRS. Examination of Pulse. Sarngadhara- Samhita: A Treatise on Ayurveda. Chaukhamba Orientalia, New Delhi, 1997.
- Wang P, Zuo W, Zhang D. A Compound Pressure Signal Acquisition System for Multichannel Wrist Pulse Signal Analysis. IEEE Transact Instrument Measurement 2014; 63: 1556-1565.
- Kalange AE, Mahale BP, Aghav ST, Gangal SA. Nadi Parikshan Yantra and Analysis of Radial Pulse. 1st International Symposium on Physics and Technology of Sensors, Pune, 2012.
- Roopini N, Roopini MS, Shridhar D. Design & Development of a System for Nadi Pariksha. Int J Eng Res Technol 2015; 4: 465-470.
- Begum MS. Nadi Aridhal: A Pulse Based Automated Diagnostic System. 3rd International Conference on Electronics Computer Technology, Kanyakumari, India, 2011.
- Kalange AE, Mahale BP, Aghav ST, Gangal SA. Nadi Parikshan Yantra and Analysis of Radial Pulse. 1st International Symposium on Physics and Technology of Sensors, Pune, 2012.
- Sareen M, Kumar M, Santhosh J, Salhan A, Anand S. Nadi Yantra: a robust system design to capture the signals from the radial artery for assessment of the automatic nervous system non-invasively. J Biomed Sci Eng 2009; 2: 471-479.
- Che X, Xu X, Sun J, Xu H. Research on Pulse Power Spectrum calculation method based on TCM. IEEE International Conference on Communication Software and Networks, Chengdu, 2015.
- Thakker B, Vyas AL. Frequency Domain Analysis of Radial Pulse in Abnormal Health Conditions. Proc IEEE-EMBS Conference on Biomedical Engineering & Sciences IEEE Press, Kuala Lumpur, 2010.
- Thakkar B, Vyas AL. Support Vector Machine for Abnormal Pulse Classification. Int J Comput Appl 2011; 22: 13-19.
- Baisware A, Joshi SN. Design of Non Invasive Pulse Rate Detector using LabVIEW. Int J Emerg Trends Eng Technol 2015; 3: 71-75.
- http://www.nxp.com/assets/documents/data/en/data-sheets/MPXV2050.pdf
- http://www.ti.com/lit/ds/symlink/ina128.pdf
- http://www.ni.com/pdf/manuals/376047a.pdf
- Thakkar S, Thakker B. Wrist Pulse Acquisition and Recording System. Commun Appl Electron 2015; 1: 20-24.
- Parekh K, Thakker B. Wrist Pulse Classification System for Healthy and Unhealthy Subjects. Int J Comput Appl 2015; 124: 1-5.