Research Article - Biomedical Research (2016) Computational Life Sciences and Smarter Technological Advancement
Prognostic classification of tumor cells using an unsupervised model
R Sathya Bama Krishna1*, M Aramudhan21Department of Computing, Sathyabama University, Chennai, India
2Department of Information Technology, Perunthalaivar Kamarajar Institute of Engineering and Technology, Karaikal, India
Accepted date: August 19, 2016
Abstract
Our human body comprises of trillions and trillions of cells. Cell acts as the basic building block for all living beings. DNA present inside the nucleus of every cell carries genes. Abnormal mutations occurring in these genes are the prime reason for cancerous cell development. A cluster of cancer cells are called tumor. Breast Cancer acts as one of the primitive cause of cancer deaths among women both in developed and developing countries. One of the prominent techniques of data mining is clustering concept, in the field of biology we discuss it as human genetic clustering. The ground rule of any industrial application development lies in appropriate data collection. In this paper a novel clustering technique using an unsupervised data model is proposed. A revised structure based fuzzy C means soft clustering algorithm is proposed and applied over Wisconsin dataset. This algorithm applies a novel strategy in choosing the initial cluster centers. The experiments are carried out over Breast Cancer Wisconsin Data set retrieved from UCI Learning Repository and the work is compared with other existing techniques.
Keywords
Data mining, Soft clustering, Unsupervised feature selection, Structure based fuzzy c means algorithm.
Introduction
The development of microarray technologies have taken the scientific community to the next level of discovery. It plays an eminent part in gene discovery, Disease diagnosis and Toxicological research. Often microarray data access genes or DNA sequences beneath different constraints. Human body is made up different types of cells. Cells divide and grow in an conventional manner. In few cases cells are produced even when they are not wanted, building a block of abnormal tissues named tumor. A tumor could be cancerous, which is called malignant and non-cancerous called benign. The damage caused to cell’s DNA structure is the major cause for cancer development. These cells begin to mutate and damage adjacent tissues thereby spreading to different parts of the body. A lobular carcinoma begins off from the lobules, whereas ductal carcinoma develops from the ducts. Most women who have inherited BRCA1 and BRCA2 genes possess greater probability of breast or ovarian cancer. Another typical gene TP53 also relates to most breast cancer developers. The key for preventing cancer lies in the earlier detection of molecular alterations in cells.
Prognosis plays the key role in decision making for most medical domains. Prognosis presents a unique set of problems to a learning system when some of the outputs are unknown. Most predictors fail to accurately distinguish tumors. This paper exhibits a distinct algorithmic approach for prognostic prediction. The method is applied for breast cancer prognosis, ensuing Breast cancer is induced by the mishap of cells DNA. The main goal is to differentiate between tumor and normal cells based upon their cell structure. With the progression of DNA microarray expression data, a wide range of infectious and genetic diseases could be diagnosed or prevented. The concept of data mining facilitates medical prediction by classifying different patterns and their correlations upon various grounds. Statistics reveal that more women are at high risk of life threats owing to lack of early detection tools. The structure of the paper ordered as follows: A brief brush-up of the researches related to feature selection is discussed in Section 2. The proposed methodology is given in section 3. The experimental results of the proposed approach are presented in Section 4. Finally, Section 5 delivers the conclusions of this paper.
Related Works
Clustering is a main task used in many fields for image analysis, pattern recognition, information retrieval, machine learning and bioinformatics. Clustering is basically grouping of similar objects based on some conditional criteria’s. In general cluster could be classified as hard clustering or soft clustering. In this section, some existing clustering algorithms in the field of bioinformatics are discussed. Genetic clustering [1] has become more convenient for genetic population studies, since unrecognized genetic structures could produce false positives in statistical analysis compared to natural selection. Risch and Rosenberg [2] were the initials to develop gene clusters and define a program named STRUCTURE to locate human populations. It was a statistical approach that worked by placing individuals based on their genetic similarity into different arbitrary clusters, thereby generating multiple clusters. Mji and Das [3] proposed a genetic clustering procedure to cluster genes from microarray data. They incorporate the concept of mutual information to compute gene class relevancy and gene redundancy. The proposed supervised algorithm is shown to be effective for identifying biologically significant gene clusters with excellent predictive capability. Guyon and Elisseefffocuses [4] on the recent progress in feature selection. They recommend opting for a linear predictor in initial stages and choose variables from two different methods (a) mutual information or variable ranking method using a correlation coefficient (b) subset selection method by performing forward or backward selection or with multiplicative update. The main objective of our work is to cluster genes based on their structure and identical expressions over different conditions.
Unsupervised feature selection
Feature Selection plays a vital role in classification models. They are unsupervised, where class labels are not known. In case of unlabelled data there is a need for finding the number of clusters in conjunction with feature selection and need for normalizing the bias of feature selection criteria with respect to dimension. For evaluating candidate feature subsets, scatter separability and maximum likelihood could be preferred. Feature selection algorithms would fall under the category of either filter or wrapper [5] approaches. In case of filter approach features are preselected whereas, wrapper approach incorporates a clustering algorithm in feature search and classified as supervised learning, where class labels are known and selection. In this work, a hybrid unsupervised learning framework is proposed. Data clustering frequently termed as unsupervised feature selection groups similar data items into clusters. Data extraction is an important part in clustering. There are various clustering techniques namely K-means clustering, DBSCAN, Hierarchical clustering, STINGetc. These clustering algorithms can be categorized as density based method and grid based method, where genes with similar patterns are grouped together. Clustering is employed over various fields in bioinformatics. One such application is gene clustering. Fuzzy clustering is more prefered than hard clustering because it permits genes to be present in more than one cluster.
Overview of breast cancer
Breast cancer cells originate from the cell tissue present in the inner lining of milk lobules or ducts. They are classified into different types based on their origin as Benign (Non-invasive) and Malignant (Invasive) [6]. The major signs of breast cancer are formation of breast lump, change in nipple structure and skin dimpling.
There are different stages of cancer prognosis determined by the size of tumor cells and how vast its been spread to different lymph nodes. Depending on the tumor size its classified into four classes namely T1-0 to 2 cm, T2-2 to 5 cm T3-greater than 5 cm and T4-any size that has ulcerated the skin. The shape and structure of normal cells vary from that of cancer cells, which is depicted in Figure 1. Normal cells do have single nucleus, large cytoplasm and fine chromatin whereas cancer cells have multiple nuclei, small cytoplasm and coarse chromatin.

Figure 1: Structure of normal and cancer cells.
Prognostic classification plays a vital role in cancer type identification and treatment. After diagnosis various treatment based on their stage are provided. Survival rate varies between patients depending on their stage of identification. The below Figure 2 depicts the stages of growth from a single cancer cell to other parts of the body.

Figure 2: Breast cancer cells.
Proposed Methodology
In this paper a novel soft clustering algorithm based on cell structures is proposed. We define a fuzzy based model and prove that our algorithm defines cluster structure which yields better results. Far from hard clustering here data belongs to a cluster based on some degree of membership. The concept of fuzziness enables us to retain more data compared to previous methods. The primitive aim is to reform the objective function of classical FCM algorithm by inserting information related to structure of the objects or group of data to be clustered. The performance of any FCM algorithm depends on the initial state of cluster centres. Here a revised FCM with a novel strategy in choosing the initial cluster centers is put forward. There are several modes of selection namely a) random manner b) user specified manner c) farthest point as cluster center etc., here we take over a new process by selecting points with maximum density. The following Figure 3 represents the architecture of feature selection.

Figure 3: System architecture.
Density estimation technique [7] is preferred for datasets with limited amount of features and maximum quantity of samples. Single object is selected randomly and its density is computed, this density is compared with a standard density parameter of the given dataset. If the value is equal to or more, then it acts as cluster center. We repeat this procedure till we obtain the minimum number of cluster centers. The main advantage of this method is avoiding local minima of the objective function.
Algorithm
The FCM algorithm is rooted based on minimizing the criterion with respect to distance dij and membership value μij.
Step 1: Let X={x1, x2, x3... , xn} represent data points and C={c1, c2, c3, ... , ccn} be group of centers.
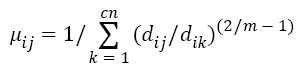
Step 2: Select randomly cn cluster centers and calculate fuzzy membership 'μij' as given below:
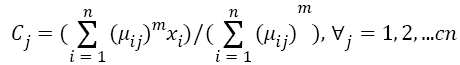
Step 3: Fuzzy centers 'Cj' is calculated as:
Step 4: Update U(k), U(k+1)
Step 5: Repeat steps 2 and 3 until the minimum 'j' value is obtained.
Step 6: If||U(k+1)-U(k)||< β, then stop.
Where, m-fuzziness index.
k-iteration step.
β-termination criterion between [0, 1].
j-objective function.
U=(μij)n*c is the fuzzy membership matrix.
Here β acts as the threshold for termination criteria.
Result and Analysis
Extracting a portion of informative gene from microarray expression data is a critical data preparation step in cancer classification and other biological functional analyses. In this section we have compared the performance of different benchmark datasets like Iris, Wine and Wisconsin Breast Cancer dataset. All these data sets were downloaded from [8] http://www.ics.uci.edu.
In Wisconsin Prognostic Breast Cancer (WPBC) dataset [9], each record narrates data about one cancer case. Features are taken away from a digitized image of a breast mass. They portray characteristics of cell nuclei featured in the image. Table 1 gives a brief note of these datasets. Each datasets have different number of class and attributes.
| Dataset | No. of Attributes | No. of Instances | No. of Classes |
|---|---|---|---|
| Wisconsin Breast Cancer (WBCD) | 11 | 699 | 2 |
| Wisconsin Diagnosis Breast Cancer (WDBC) | 32 | 569 | 2 |
| Wisconsin Prognosis Breast Cancer (WPBC) | 34 | 198 | 2 |
Table 1: Dataset description.
A total number of 198 instances were taken with attribute information as Id number, Diagnosis (B-benign, M-malignant). From each cell nucleus ten real valued features were extracted. They are as follows :
a) radius (mean of distances from center to points on the perimeter)
b) texture (standard deviation of gray-scale values)
c) perimeter
d) area
e) smoothness (local variation in radius lengths)
f) compactness (perimeter^2/area - 1. 0)
g) concavity (severity of concave portions of the contour)
h) concave points (number of concave portions of the contour)
i) symmetry
j) fractal dimension ("coastline approximation" - 1)
Figure 4 shows the digital image of cluster cells of breast cancer. The clusters formed using earlier FCM were bit clumsy compared to the proposed structure based RFCM. Structure based classification distinguishes normal cells from slightly abnormal cells there by differentiating them into various grades. Fuzzy C Means Algorithm also called soft C Means Algorithm. Soft C Means Clustering results of WBCD achieves 95.75% of classification accuracy with datasets that possess class labels as shown in Table 2.
| Results | Cluster 1 | Cluster 2 | Total |
|---|---|---|---|
| Total number of data points | 444 | 239 | 683 |
| Number of data pointswrongly clustered | 9 | 20 | 29 |
| Number of data points correctly clustered | 435 | 219 | 654 |
| Accuracy (%) | 97. 97 | 91. 63 | 95. 75 |
Table 2: FCM with Class Labels (WBCD).

Figure 4: Cluster of breast cancer cells.
Revised Fuzzy C Means Clustering results are given in Table 3, where WBCD achieves 97.21% of classification accuracy with unlabelled datasets.
| Results | Cluster 1 | Cluster 2 | Total |
|---|---|---|---|
| Total number of data points | 444 | 239 | 683 |
| Number of data pointswrongly clustered | 7 | 12 | 19 |
| Number of data points correctly clustered | 437 | 227 | 664 |
| Accuracy (%) | 98. 42 | 94. 97 | 97. 21 |
Table 3: FCM with Unlabeled Dataset (WBCD).
Revised Fuzzy C Means Clustering results of WPBC achieves 96.82% of classification accuracy with unlabelled datasets as shown in Table 4.
| Results | Cluster 1 | Cluster 2 | Total |
|---|---|---|---|
| Total number of data points | 109 | 80 | 189 |
| Number of data pointswrongly clustered | 02 | 04 | 06 |
| Number of data points correctly clustered | 107 | 76 | 183 |
| Accuracy (%) | 98. 16 | 95. 00 | 96. 82 |
Table 4: RFCM with unlabelled dataset (WPBC).
The experiments were carried out employing MATLAB tool, R2010b version. Figure 5 depicts the cluster formation using the proposed RFCM algorithm. Clustering is done based on the attribute value dataset namely cell size, radius of nuclei etc.

Figure 5: Cluster formation using RFCM algorithm.
Conclusion
Thus the proposed novel soft clustering algorithm for unlabelled datasets produces better results compared with existing methods with labelled data. In most widely adopted k- Means algorithm data points belong to only single cluster, whereas in soft clustering methods it may belong to more than one cluster centers. Fuzzy concepts address various issues of uncertainty, vagueness and incompleteness in class definition. With good membership function the proposed structure based classification algorithm provides reliable clusters. A common conclusion in terms of performance evaluation is [10] “Different classifications [clustering’s] are right for different purposes, so we cannot say any one classification is best”. Clustering is an challenging task in various application domains. In the context of future enhancement, the structure based cell classification could be applied for different medical environments for prognostic analysis and their performances could be recorded for various disease diagnosis [11,12].
References
- Ptak SE, Przeworski M. Growth inhumans is confounded by fine-scale population structure. Trends Genetics 2002; 18:559-563.
- Rosenberg NA, Pritchard JK, Weber JL, Cann HM, Kidd KK, Zhivotovsky LA, Feldman MW. Genetic Structure of Human Populations. Science 2003; 298: 2381-2385.
- Maji P, Das C.Relevant and Significant Supervised Gene Clusters for Microarray Cancer Classification. IEEE Transact NanoBiosci2012; 11: 161-168.
- GuyonI,Elisseeff A. An Introduction to Variable and Feature Selection. J Mach Learn Res 2003; 3: 1157-118.
- John GH,Kohavi R, Pfleger K. Irrelevant feature and subset selection problem. Machine Learning. Proceedings of the Eleventh International Conference,1994.
- HartiganJA, Wong MA. Algorithm as 136: A k means clustering algorithm. J Royal Stat Soc 1979; 28:100-108.
- Wolberg WH, Street WN, Heisey DM, MangasariaOL. Computerized breast cancer diagnosis and prognosis from fine needle aspirates. Western Surgical Association meeting in Palm Desert, California, 1994.
- https://arxiv.org/ftp/arxiv/papers/1205/1205.5353.pdf
- Liu Y, Gu Q, Hou JP, Han J, Ma J. A network-assisted co-clustering algorithm to discover cancer subtypes based on gene expression. BMC Bioinformatics 2014.
- Berkhin P. Survey of Clustering Data Mining Techniques. In:Grouping Multidimensional Data, 2002, Springer, Berlin.
- http://www.cancer.gov/types/breast
- https://archive.ics.uci.edu/ml/datasets/Breast+Cancer
- MajiP, Pal SK. RFCM: AHybrid Clustering Algorithm Using Rough andFuzzy Sets. FundamentaInform2007;80: 475-496.