Research Article - Biomedical Research (2017) Volume 28, Issue 15
Prediction of transition sequence of diseases' severity levels using clinical datasets with data mining approaches
Thendral Puyalnithi and Madhu Viswanatham Vankadara*
School of Computer Science and Engineering, VIT University, Vellore-632014, Tamil Nadu, India
- *Corresponding Author:
- Madhu Viswanatham Vankadara
School of Computing Science and Engineering
VIT University, India
Accepted on July 24, 2017
Abstract
Diagnostic physicians during the treatment of patients usually profile a disease into various severity (stages) levels, which gives better picture about the course of the treatment, financial estimate, material needs, time-line of the treatment, further diagnostics and recovery. With the advent of Computational Intelligence (CI), Big Data technologies and with the availability of enormous clinical data, the severity levels prediction by Clinical decision making systems (CDMS) has become ease. Apart from predicting the current severity level of the disease, it is very important to predict the next coming severity level of the disease. The disease severity level transition does not always happen in a predefined sequence on a certain timeline and there are many examples in diseases such as diabetes, cancer, sudden heart attack etc. where there is some sort of randomness in the severity level transition which happens irrespective of the timeline. The severity level jump varies from person to person due to some inexplicable reasons, so if CDMS predicts a possible severity level transition sequence along with the current severity level, it will be very helpful in the treatment phase. This research work provides novel solution for predicting the transition of severity levels using data mining approaches. Cleveland heart data set which has four severity levels is taken from the University of California, Irvine (UCI) machine learning repository and it is used for the analysis of the proposed method.
Keywords
Disease stage/risk/severity levels, Severity level transition, Clinical decision making system, Vector algebra, Data mining methods, Classification, Clustering.
Introduction
Every disease has various stages of severity. Severity level of illness (SoI) of person suffering from any disease helps physicians to predict further course of treatment, duration of hospital stay and resource need since correct diagnosis and the timely treatment are very important in saving the life of patient. The financial need for the treatment can also be assessed, that is helpful parameter for the patient to plan early. It also helps to predict the time frame of recovery from the treatment. Diseases such as cancer, diabetes, liver disorder, cardio disease and Parkinson disease have many levels of SoI, the severity assessment in these diseases are extremely important, as the treatment course entirely depends on the present stage of the disease. Moreover, as these diseases are life threatening in nature, the next step in the treatment phase of these diseases is extremely important. The severity can be found by clinical data which includes fluid tests, imaging data, wave form data and so on. Fluid tests include body fluid tests such as blood, urine and so on. Imaging data includes Computed tomography (CT) scan, Magnetic resonance imaging (MRI) scan, ultra-sound and so on. The wave form data includes Electrocardiogram (ECG), Single-photon emission computed tomography (SPECT), Electroencephalogram (EEG) and so on. The wave data are discretized and then they are refined into clinical dataset. Thus the physicians get clinical data from various tests and then the severity level is assessed based on the data values. The severity level for diseases can be classified into mild, moderate and worse, or it can be classified with numbers, for example the severity level from 1 to 5. The severity levels are usually discrete values. Many research works predict the severity level of the disease, for example the cardio vascular disease severity is categorized into low, medium and high and an unified approach is followed [1] to predict the severity using supervised machine learning techniques. Many hospitals have platform to share clinical data of their patients to outside world, so that every other hospital can benefit from the data. With the advent of cloud and big data, the general clinical data and data from live streaming of surgeries are flooding the web. Thus the enormity of data related to the diseases expedited the research on the effective diagnosis of the diseases.
The use of medical dataset has become unavoidable in the clinical decision making systems. The need of enormous data to predict clinical decisions were supported by various research [2,3] works and they have proved that without the enormity of data, the decision taken by clinical decision making systems will be erroneous. Moreover, the availability of clinical data for taking decision assist in reducing the cost, assessing the cost of treatment and efficient decision making and it saves time and money for the patient [2]. Clinical decision making systems support medical practitioners in treating patients. The prediction domain falls in the category of computational intelligence. Machine learning concepts come under computational intelligence domain and machine learning has supervised and unsupervised methods. Supervised learning corresponds to classification and regression whereas unsupervised corresponds to clustering. CDSS uses supervised methods where a model is trained with data, so that the model starts predicting for the unknown data. Supervised methods of classification models needs classified data to get trained. There are various data mining algorithms such as decision tree, support vector machine, naïve bayes and ensemble methods for creating classification models. Use of soft computing methods which are also one of the areas in computational intelligence helps in crating CDSS, neuro-fuzzy, genetic and evolutionary algorithms helps in a big way developing an efficient CDSS. Most of the research works on data analytics in health care predicts the presence or absence of the disease, or it finds the risk level or the stage of the illness. Risk level associated with congenital heart surgery is found using data mining approach [4], Parkinson disease severity levels are found out though various feature selection and through machine learning methods [5]. Breast cancer risk assessment is done through soft computing methods [6]. Clinical decision support system enhancement was done using swarm intelligence [7]. Frequent Itemset mining concept of data mining is used to find the reason risk levels of cardiac diseases [8]. Thus it can be said that most of the researches pertain to predict the risk levels only.
A new important issue is identified in the disease phase that is rate of deterioration of the illness of certain disease vary from person to person. Suppose a person in the starting stage of a disease may rapidly move on to the final stages. Patient diagnosed in certain severity level of the disease need not go to stages in sequence, for example a patient is found to be in the severity level 1 for a disease which is having 4 stages, with 4 being the worst case, for some unknown reasons or unfound reasons, the patient may move to some other levels of severity which need not be the next stage which is 2, the transition of severity may be to 3 or 4. This severity transition sequence varies from person to person and from disease to disease. Some sort of randomness in severity transmission is always there in the clinical diagnostics domain. Coronary heart disease and cancer are some of the diseases where the randomness in severity transition is highly prevalent. This is highly proved in practical scenario that many people after getting heart attack or angina did not survive the next year, meaning after getting the mild heart attack, the severity worse in one year time period to go to the extreme level that is mortality, there is an entire data set [9] dedicated for machine learning research which has echocardiogram data of heart patients who did not survive 1 year after getting heart attack. Even in various types of cancer, in a certain time period, two persons’ severity transition varies for unknown reason which may be genetic or it can be beyond the comprehension of existing ways of diagnostics.
One more example in the rapid transition of stages is sudden cardiac death [10-12] where a normal person after getting cardiac arrest dies instantly, this can be redefined as some cases where the heart attack phenomenon takes the starting stage patient to the extreme level in a rapid rate and causes death and the reason for this rapid rate of deterioration can be found out, if enormous amount of data relating to sudden cardiac death are available. The scenario of random deterioration of illness on a certain timeline is a very much existing problem, but there is one more important issue that has been found and discussed in this article which is nothing but the prediction of transition of severity of illness from one stage to another which is not sequential. To summarize, it can be said that many researches have confirmed the need of enormity of clinical data to design an efficient clinical decision making system, moreover predicting the stages of the disease helps in many ways since and the medical practitioners tend to assess the current stage of the disease to decide their way of treating the patient. The stages of the disease are determined by the experts, meaning certain clinical test data corresponds to certain stage and this is decided by the expert in the field. This knowledge comes to the medical practitioner through years of analyzing the patients’ records. Present researches mostly uses the kind of data where the clinical test values linked with the stage of the disease, thus we have clinical datasets that tells about stages. The solution provided in this paper is to mine the transition pattern from the dataset which has only the stages for the clinical test results. The data set for the transition is not at all available and the challenge is to synthesize the severity transition sequence from the stages clinical dataset. The solution provided in this research paper effectively finds out the sequence.
Proposed Method
The proposed method comprises two algorithms. First algorithm finds the current stage and transit stage, stage refers to the risk level which is an integer. When a clinical test data tuple is passed to the first algorithm, it finds the current and transit stage corresponding to the test tuple. After finding current and transit stages for every test tuple, second algorithm helps to find the frequent risk level transition pattern. The flow diagram of the proposed method is given in the Figure 1.

Figure 1. Flow diagram of proposed model.
Algorithm 1
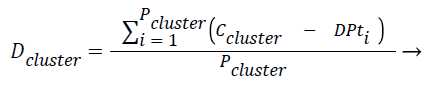
Equations formulated: Density of the cluster Dclusture is found using the Eq. (1),
 (1)
(1)
where Pcluster refers to total number of tuples present in the cluster, Ccluster refers to centroid of the cluster and DPt refers to data point or tuple present in the cluster.
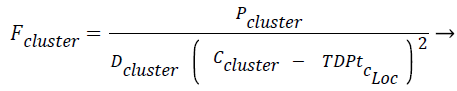
The force exerted by a certain cluster on the new tuple/data point Fcluster is given in Eq. (2). Fcluster is inversely proportional to distance between the square of the distance between the centroid and the test data point/tuple, the idea of gravitational pull where the gravitational force is inversely proportional to the square of the distance between two bodies has been incorporated here. The two bodies refer to centroid of the cluster and the new test instance respectively. Fcluster is inversely proportional to density of the cluster (Dcluster) and directly proportional to population in the cluster, Pcluster.
 (2)
(2)
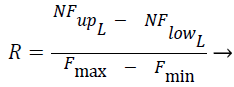
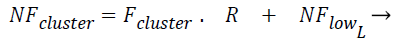
The Fcluster values ranges can vary in a very big range and so this is normalized using the Eq. (3) and Eq. (4) using min-max normalization, where in NFup_L is the upper limit for the normalized force and NFlow_L is the lower limit for the normalized force. Fmax, Fmin are maximum and minimum forces, exerted by the clusters among all the test instances respectively, where R is said to be normalization ratio.
 (3)
(3)
 (4)
(4)
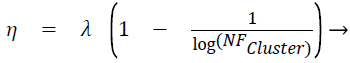
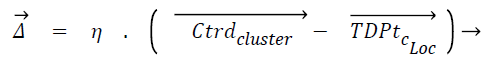
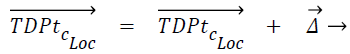
Displacement rate, η is computed using Eq. (5), λ is called tuning factor and it ranges from above 0 to less than or equal to 1 (0<λ ≤ 1). Displacement rate, η decides the quantum of movement of the test instance towards the centroid of the cluster. The displacement vector Δ̅ is found out using Eq. (6). TDPtc_Loc is nothing but the test data point/instance and c_Loc corresponds to the attribute/dimension values. The new location of test instance is found out once TDPtc_Loc is updated using Eq. (7) by all the centroids. TDPtcurrent_stage and TDPttransit_stage mentioned in the line number 4 of the proposed algorithm 1 corresponds to current and transit severity level respectively, which are predicted by C4.5 based Decision tree (DT) model.
 (5)
(5)
 (6)
(6)
 (7)
(7)
Input: k-number of clusters in single class, data_set-clinical dataset having severity level as class attribute.
Output: Current stage and transit stage of disease for every test dataset instance
Algorithm 1
1: data_set → training_set + test_set
2: model ← C4.5 DT(training_set)
3: for every class’s tuples
3.1 apply k-means (k-input)
4: for every TDPt test_set,
4.1 predict TDPtcurrent_stage ← model(TDPtC_Loc)
4.2 for every cluster of all classes
4.2.1 if TDPt ≠Ctrdcluster
4.2.1.1 compute Dclusture using Eq. (1)
4.2.1.2 compute Fclusture using Eq. (2)
4.2.1.3 compute NFclusture using Eqs. (3) and (4)
4.2.1.4 compute Δ̅ using Eq. (5) and Eq. (6)
4.2.1.5 compute TDPtc_Loc using Eq. (7)
4.3 predict TDPttransit_stage ← model(TDPtC_Loc)
The new data point settles in a certain location after being pulled by every centroid. This is now said to be new tuple or relocated data point. Displacement rate, η and the displacement of test data towards the centroid are directly proportional to each other.
Algorithm 2
The proposed algorithm 2 gives the best possible severity transition sequence from stage one of the diseases to the final stage using frequent analysis with the help of Dijkstra’s shortest route finding algorithm.
Input: Test instances having both current and transit stages, Total number of severity levels (StagesCount)
Output: Best possible severity transition sequence from starting stage to final stage
Algorithm 2
1: valid_test_set_=empty
2: for every TDPt,
2.1 if TDPtcurrent_stage<TDPttransit_stage
2.1.1 add TDPt to valid_test_set
3: create square adjacency matrix, adMat of size StagesCount
4: initialize adMat with value 0
5: for every TDPt valid_test_set
5.1 adMat[TDPtcurrent_stage, TDPttransit_stage]+=1
6: compute inverse of all values in adMat.
7: apply Dijkstra’s algorithm on adMat find shortest distances from stage one
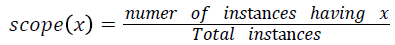
Various training and testing samples are planned to be taken form main dataset as mentioned in the line 1 of Algorithm 1 using random sampling without replacement. For each sample for the varying degrees of turning factor λ values, frequent patterns of disease transition from stage one to final stage are found out. Among the frequent disease transition patterns found out for various samples with various λ values, the severity transition pattern which is having the highest scope value is said to be the final best severity level transition sequence pattern. The scope of pattern x is defined as,
Implementation and Results Analysis
Dataset
The data set for the analysis is taken from UCI machine learning repository [9]. The dataset used is the Processed Cleveland heart data set. The data set has clinical data of heart patients. It has 14 attributes, 13 are non-decision attributes and 14th attribute is the decision attribute which represents the stage of the disease which the clinical attributes corresponds to. There are totally five stages, from 0 to 4. Stage 0 represents no disease, stage 1 to 4 represent presents of heart disease with stage 1 representing the least risk level and stage 4 representing the highest risk level. The data set has 302 records/instances/ data points, of which, 139 instances have one of the risk levels from 1 to 4, meaning 139 records corresponds to persons with heart disease. Out of 139 records which represent persons’ clinical data having heart disease, 55 records are in stage 1, 36 records are in stage 2, 35 records are in stage 3 and 13 records are in stage 4. Since number of instances with disease is low and the low number of instances is not good enough for doing the analysis, more data is generated using the available data pattern. Totally 861 instances of various risk level are generated. So there are 1000 instances which include the original 139 instances. It has been generated in such way that every stage/severity level of the disease has 250 instances. Details of the 14 attributes are given in Table 1 where the 14th attribute is the class attribute.
| 1 | Age of patient |
| 2 | Gender of patient |
| 3 | Chest pain type |
| 4 | Resting blood pressure |
| 5 | Serum cholesterol |
| 6 | Fasting blood sugar |
| 7 | Resting electrocardiographic results |
| 8 | Maximum heart rate achieved |
| 9 | Exercise induced angina |
| 10 | ST wave depression induced by exercise |
| 11 | Slope of the peak exercise ST wave |
| 12 | No. of vessels coloured by fluoroscopy |
| 13 | Normal or fixed defect or reversible defect |
| 14 | Stage of heart ailment 1or 2 or 3 or 4 |
Table 1. Data set attribute details.
As part of this work, totally five trials are performed. In each of the trial random sampling without replacement is performed and 90% of instances are selected, that is 900 instances are selected and remaining 100 instances which is 10% of the total instances are taken as test set. For every trial, certain sequence of procedure is followed starting with the creation of C4.5 based decision tree using the training dataset. For each of the remaining 100 instances, the current stage and transit stage is found out using the algorithm 1 as mentioned in the proposed method section and for every trial the experimentation is done for eight different values of turning factor, λ and so for each one of the turning factor, λ there will be a best possible severity transition sequence.
First three attributes of the dataset such as age, sex and chess pain type are omitted for computing the procedures of algorithm 1 and algorithm 2. Since age, sex and chest pain types are not clinical attributes, they are omitted. But those three attribute are included in the generation of C4.5 based decision tree which calculates test instances’ current stage and transit stage. Only the remaining 11 attributes are used for the algorithm 1 and algorithm 2, which are mentioned in the proposed method section.
Implementation and results
Python language is used for the implementation of the proposed method. The Scikit library is used for the implementation of the machine learning methods. Firstly, algorithm 1 is applied over the tuples of trial 1 test dataset and it gives the resultant set of tuples with current stage and possible transit stage of the disease for the tuples. Then those tuples are subjected to algorithm 2, which first selects the tuples whose current stage is less than possible transit stage and then the algorithm finds the possible disease severity transition sequence.
For each of the five trials, for the turning factor (λ) of 0.25, the adjacency matrices are shown in the Tables 2-6 and the non-zero values in the adjacency matrix are inversed and are shown in the Figures 2-6. The first column in the adjacency matrix represents the current stage and the first row represents the transit stage of the heart disease. The edge having higher cost, once inversed, its value will be lowered, thus it leads to the formation of edge with lowered cost, that increases chances of getting chosen while we run Dijkstra’s algorithm. The shortest path found out from stage 1 to stage 4 is shown in red color in the Tables 2-6.
| Stages | t_1 | t_2 | t_3 | t_4 |
|---|---|---|---|---|
| c_1 | 0 | 15 | 23 | 1 |
| c_2 | 0 | 0 | 10 | 1 |
| c_3 | 0 | 0 | 0 | 17 |
| c_4 | 0 | 0 | 0 | 0 |
Table 2. Adjacency matrix-Trial 1-λ-0.25 (67 valid tuples).
| Stages | t_1 | t_2 | t_3 | t_4 |
|---|---|---|---|---|
| c_1 | 0 | 10 | 27 | 6 |
| c_2 | 0 | 0 | 11 | 2 |
| c_3 | 0 | 0 | 0 | 14 |
| c_4 | 0 | 0 | 0 | 0 |
Table 3. Adjacency matrix Trial 2-λ-0.25 (70 valid tuples).
| Stages | t_1 | t_2 | t_3 | t_4 |
|---|---|---|---|---|
| c_1 | 0 | 6 | 16 | 3 |
| c_2 | 0 | 0 | 8 | 1 |
| c_3 | 0 | 0 | 0 | 21 |
| c_4 | 0 | 0 | 0 | 0 |
Table 4. Adjacency matrix-Trial 3-λ-0.25 (55 valid tuples).
| Stages | t_1 | t_2 | t_3 | t_4 |
|---|---|---|---|---|
| c_1 | 0 | 15 | 8 | 9 |
| c_2 | 0 | 0 | 22 | 4 |
| c_3 | 0 | 0 | 0 | 21 |
| c_4 | 0 | 0 | 0 | 0 |
Table 5. Adjacency matrix-Trial 4-λ-0.25 (79 valid tuples).
| Stages | t_1 | t_2 | t_3 | t_4 |
|---|---|---|---|---|
| c_1 | 0 | 12 | 22 | 4 |
| c_2 | 0 | 0 | 16 | 6 |
| c_3 | 0 | 0 | 0 | 14 |
| c_4 | 0 | 0 | 0 | 0 |
Table 6. Adjacency matrix-Trial 5-λ-0.25 (74 valid tuples).

Figure 2. Trial 1-λ-0.25 (67 valid tuples).

Figure 3. Trial 2-λ-0.25 (70 valid tuples).

Figure 4. Trial 3-λ-0.25 (55 valid tuples).

Figure 5. Trial 4-λ-0.25 (79 valid tuples).

Figure 6. Trial 5-λ-0.25 (74 valid tuples).
Algorithm 1 and 2 are applied with variable tuning factor (λ) values, valid tuples (having current stage less than the transit stage) for each of the five trials are shown in the Tables 7-11 along with the best possible severity transition sequence.
The scope value for each of the unique severity level transition sequence obtained from all the trials along with the varied tuning factor, λ is found out and the scope values are given in the Table 12 and graphical representation of scope values results are shown in the Figure 7.
| S. No | Tuning factor, λ | No. valid Test Samples |
Sequence |
|---|---|---|---|
| 1 | 0.25 | 67 | 1-3-4 |
| 2 | 0.3 | 61 | 1-3-4 |
| 3 | 0.35 | 59 | 1-3-4 |
| 4 | 0.4 | 78 | 1-2-4 |
| 5 | 0.45 | 69 | 1-4 |
| 6 | 0.5 | 91 | 1-2-4 |
| 7 | 0.55 | 80 | 1-3-4 |
| 8 | 0.6 | 82 | 1-4 |
Table 7. Trial 1-Best severity transition sequences.
| S. No. | Tuning factor, λ | No. valid Test Samples |
Sequence |
|---|---|---|---|
| 1 | 0.25 | 70 | 1-3-4 |
| 2 | 0.3 | 72 | 1-3-4 |
| 3 | 0.35 | 62 | 1-4 |
| 4 | 0.4 | 69 | 1-2-3-4 |
| 5 | 0.45 | 71 | 1-3-4 |
| 6 | 0.5 | 83 | 1-2-4 |
| 7 | 0.55 | 79 | 1-4 |
| 8 | 0.6 | 84 | 1-4 |
Table 8. Trial 2-Best severity transition sequences.
| S. No | Tuning factor, λ | No. valid Test Samples |
Sequence |
|---|---|---|---|
| 1 | 0.25 | 55 | 1-2-3-4 |
| 2 | 0.3 | 62 | 1-3-4 |
| 3 | 0.35 | 69 | 1-2-4 |
| 4 | 0.4 | 72 | 1-2-4 |
| 5 | 0.45 | 80 | 1-2-4 |
| 6 | 0.5 | 84 | 1-3-4 |
| 7 | 0.55 | 78 | 1-3-4 |
| 8 | 0.6 | 89 | 1-4 |
Table 9. Trial 3-Best severity transition sequences.
| S. No | Tuning factor, λ | No. valid Test Samples |
Sequence |
|---|---|---|---|
| 1 | 0.25 | 79 | 1-2-3-4 |
| 2 | 0.3 | 74 | 1-3-4 |
| 3 | 0.35 | 73 | 1-2-4 |
| 4 | 0.4 | 75 | 1-3-4 |
| 5 | 0.45 | 68 | 1-2-4 |
| 6 | 0.5 | 82 | 1-3-4 |
| 7 | 0.55 | 90 | 1-3-4 |
| 8 | 0.6 | 85 | 1-4 |
Table 10. Trial 4-Best severity transition sequences.
| S. No | Tuning factor, λ | No. valid Test Samples |
Sequence |
|---|---|---|---|
| 1 | 0.25 | 74 | 1-2-3-4 |
| 2 | 0.3 | 79 | 1-3-4 |
| 3 | 0.35 | 75 | 1-2-4 |
| 4 | 0.4 | 65 | 1-3-4 |
| 5 | 0.45 | 59 | 1-2-4 |
| 6 | 0.5 | 73 | 1-3-4 |
| 7 | 0.55 | 88 | 1-4 |
| 8 | 0.6 | 84 | 1-3-4 |
Table 11. Trial 5-Best severity transition sequences.
| S. No | Severity Transition Sequence | Scope |
|---|---|---|
| 1 | 1-2-4 | 0.25 |
| 2 | 1-2-3-4 | 0.1 |
| 3 | 1-3-4 | 0.45 |
| 4 | 1-4 | 0.2 |
Table 12. Scope measures of severity transition sequences.

Figure 7. Scope measure vs. severity transition sequences.
Thus for the cardiac disease the disease severity transition in patients is 1st stage to 3rd stage and then to the 4th stage and it gives insight that the 2nd stage is not hit most of the times as per scope value. This is shows that the patient suffering the disease who is in the first stage got more chances of going to 3rd stage instead of 2nd stage.
Conclusion
There are many instances where patients suffering from diseases such as cancer, diabetes and coronary heart disease show randomness in the rate of deterioration of health irrespective of the timeline. The importance of predicting the transition of stages for a disease by CDSS is emphasized throughout this research article. The proposed method predicts a possible disease severity level transition sequence for coronary heart disease. Cleveland heart dataset which is a bench mark dataset having four severity levels for the clinical data is taken from the UCI machine learning repository and it is used for the analysis of the proposed algorithm. The dataset used has clinical test attributes along with the severity level attribute which is the class attribute. There are four levels of severity in the dataset, 1 to 4 with 1 being the least severe case and 4 being the highest severe case of the coronary heart disease. It has been found that sequence of transition happens from stage 1 to stage 3 and then to stage 1. The article gives insight into predicting the next stage of the disease from the current stage, C4.5 based classification tree, k-means clustering and vector algebraic concepts used for the prediction of severity transition sequence. Using the proposed algorithms it is also possible to predict the next set of clinical data, if that is necessary. Since the proposed method gives the best severity transition sequence from stage 1 to stage 3, that result can be used for redefining the severity levels that corresponds to the clinical data. For example if 1-3-5 is the severity level sequence repeatedly taken then it can be termed as 1-2-3 severity levels, meaning older severity level clinical data 3 will be changed to severity level 2 and older stage 5 will be changed to stage 3. Thus the enormous availability of data along with sophisticated CI based algorithms; today’s world is in the cusp of developing very intelligent CDMS. If many of hospitals decides to share the data in an agreed standard formats, on a Bigdata platform, these data analytics of health care domain will surely enhance the lives of patients.
References
- Thendral P, Madhuviswanatham V. Performance analysis of classification algorithms on a novel unified clinical decision support model for predicting coronary heart disease risks. Int J IntellEngSyst 2017.
- Hillestad R, Bigelow J, Bower A, Girosi F, Meili R, Scoville R, Taylor R. Can electronic medical record systems transform health care? Potential health benefits, savings, and costs. Health Affairs 2005;24:1103-1117.
- Prokosch HU, Ganslandt T. Perspectives for medical informatics. Method InformatMed 2009;48:38-44.
- Ruiz-Fernández D, Torra AM, Soriano-Payá A, Marín-Alonso O, Palencia ET. Aid decision algorithms to estimate the risk in congenital heart surgery. ComputMethods Programs Biomed 2016;126:118-127.
- Lei H, Huang Z, Zhang J, Yang Z, Tan EL, Zhou F, Lei B. Joint detection and clinical score prediction in Parkinson's disease via multi-modal sparse learning. Expert SystAppl 2017;80:284-296.
- Subramanian J, Karmegam A, Papageorgiou E, Papandrianos N, Vasukie A. An integrated breast cancer risk assessment and management model based on fuzzy cognitive maps. ComputMethods Programs Biomed 2015;118:280-297.
- Christopher JJ, Nehemiah HK, Kannan A. A swarm optimization approach for clinical knowledge mining. Computer methods and programs in biomedicine. 2015;121:137-148.
- Ilayaraja M, Meyyappan T. Efficient data mining method to predict the risk of heart diseases through frequent itemsets. ProcediaComputSci 2015;70:586-592.
- Bache K, Lichman M. UCI machine learning repository. University of California, Irvine, USA 2013.
- Doolan A, Langlois N, Semsarian C. Causes of sudden cardiac death in young Australians. Med J Australia 2004;180:110.
- Bowker TJ, Wood DA, Davies MJ, Sheppard MN, Cary NR, Burton JD, Chambers DR, Dawling S, Hobson HL, Pyke SD, Riemersma RA. Sudden, unexpected cardiac or unexplained death in England: a national survey. Qjm 2003;96:269-279.
- Virmani R, Burke AP, Farb A. Sudden cardiac death. CardiovasculPathol 2001;10:211-218.