Research Article - Biomedical Research (2019) Volume 30, Issue 2
Optimized maximum principal curvatures based segmentation of blood vessels from retinal images
Santosh Kumar NC* and Radhika YDepartment of CSE, Githam University, Vizag, Andhra Pradesh, India
- *Corresponding Author:
- Santosh Kumar NC
Department of CSE
GIT, Gitam University, Vizag
Andhra Pradesh, India
E-mail: santosh.naliganti@gmail.com
Accepted date: March 8, 2019
DOI: 10.35841/biomedicalresearch.30-19-068
Visit for more related articles at Biomedical ResearchAbstract
In retinal image of the human eye, extracting tree shaped retinal vasculature is an important feature which helps eye care specialists or ophthalmologists to pursue proper diagnostic procedures. In this paper, an approach named Optimized Maximum Principal Curvatures Based (OPCB) segmentation is been proposed for efficient extraction of blood vessels from retinal fundus images. This algorithm proceeds into two stages. Firstly, pre-processing on input retinal images is done by Particle Swarm Optimization (PSO) technique which is an automatic process for computing the global optimum pixels of the image in order to avoid working with all or random pixels. Later, these optimal pixels are made to undergo further processing with Gaussian Filter to remove the noisy pixels among them. Secondly, the post-processing is carried out in four steps: (i)Maximum Principal Curvatures (maximum-eigenvalues) of the second order derivative matrix (Hessian) quantity of the pre-processed PSO image are computed by using ‘Lambda Function’, which then does region growing of the tree-shaped blood vessels by convolving Maximum Principal Curvatures with the mathematical erosion structuring element of. (ii)After extraction of blood vessels, section-wise contrast enhancement is performed by using Adaptive Histogram Equalization that work on 8x8 tiles of image being segmented for smoothing artificially introduced boundaries if any, and also for eliminating over amplified noise. (iii) ISODATA (Iterative Self-Organizing Data Analysis Technique) thresholding is used to classify the image globally where the image’s foreground vascular structure is segmented from the background. (iv) A ‘morphologically opened’ operation is performed to prune falsely segmented isolated regions, to achieve very accurate segmentation. This proposed technique tested online available colored retinal images of STARE and DRIVE databases. As an outcome, the proposed approach achieves the superior segmentation accuracy of 96% which outperformed many empirically proven segmentation methods which were proposed in the past.
Keywords
Retinal fundus image, Gaussian filter, Particle swarm optimization, Maximum principal curvature, Adaptive histogram equalization, ISO data thresholding, STARE and DRIVE databases
Introduction
Frightening disease diabetes is affecting and deteriorating health of humans around the globe. Regardless of speedy attainments in medical field, this disease surely will get amplified in the future. According to Verma et al. [1], many patients losing their eye sight due to spread of diabetes on retina, which is well known as 'diabetic retinopathy' and this, is because of disparities in retina vascular arrangement. "Prevention is better than cure", it is better to discover and manage the irregularities in the retina vessels that can reduce suffering of patients from vision failure. Currently figure of patients affected with diabetes is terrifying; research is proving that above 85% cases of the patients with complications of diabetic can be condensed, if the diagnosis for diabetic retinopathy is done early. The blood vessels segmentation outcome is a verdict of cardiovascular and ophthalmologic disorders including diabetic retinopathy, glaucoma, hypertension etc. Computerization of analysis of retinal image gives greater insights to ophthalmologists who can make an efficient assessment of the state of the patients by managing, analysing, and storing retinal images. In mechanizing the discovery of vessels -vasculature for a better analysis, the substance that is at the background of the image is an important measure and fetching of that background is a difficult job since the vessels are indifferent in terms of diameter and width [2]. These measuring parameters of the varied blood vessels give an elegant specification of ophthalmologic disease type and its intensity. The segmentation of vessels which can be either supervised or unsupervised in nature is a precursor in the development of automated diagnosis system [3] that concludes an ophthalmic disease. The usage of retinal vascular tree in biometric identification [4,5] is unique to each individual; it is highly complex and laborious task to segment the retinal blood vessels manually. Even the blood vessels automatic segmentation is very challenging because of various impediments which are affected by factors like varying in manifestation, outline and direction of vessels. Also, issues relating to low contrast amid the blood vessels and its background; instability inferred by the occurrence of noise is a complex one to handle. Addressing the presence of anomalous composites like exudates, diseased regions and lesions, microaneurysms is also a tough task. From Figure 1, one can derive that the clots of blood in the eye indicate Diabetic Retinopathy (DR) that manifests when diabetes hinders the tiny blood vessels inside the retina. The stages of DR start from mild to moderate and from moderate to severe and later leading to proliferative disease. The symptoms of DR include blurred vision, floaters, fluctuating vision, distorted vision, poor night vision, impaired color vision, dark areas in vision, partial or total loss of vision. As portrayed in literature, Figure 1 gives a better understanding of importance of the segmentation process of blood vessels.

Figure 1: (a) Healthy eye (b) Unhealthy eye with leakages in blood vessels.
This paper is divided into four divisions. Section 2 gives an overview of the earlier work done in this research area. Section 3 demonstrates the proposed algorithm with a flowchart. This section is further divided into two parts where section 3.1 deals with the optimization technique which has been used and section 3.2 explains the role of maximum principal curvatures in efficient segmentation of blood vessels. Later, in section 4 projects experimental results and explanations and section 5 gives the conclusion of the paper.
Earlier Work
The retinal fundus images used for automatic identification of the blood vessels undergo a series of various optimization, enhancement, segmentation techniques to produce rich quality, most elegant, highly accurate vessel tree structure that serves as a base to perform perfect diagnostic procedures of ophthalmologic diseases. As of now, various segmentation techniques possessing merits and demerits have been proposed so far which have worked on online available retinal fundus image databases. But, as the proverb says "All that glitters are not gold ", we mean that not all segmentation techniques that are projected in the literature, spanning from simple filtering trainable techniques to deep machine learning [6-8], generates highly accurate segmentation.
Broad classification of different approaches for blood vessel detection and segmentation is given by Cemil et al. [9]. In their survey, they have instrumentally detailed the six wide categories of techniques that have been proposed in the literature. The primary category is pattern recognition techniques which do contain seven sub-categories and among seven, differential geometry-based approach is one.
Any technique which has been proposed in the literature takes any of the form of the mentioned approaches. Occasionally, multiple techniques get mixed together in performing segmentation process. According to Hempriya et al. [10], the blood vessels extracted and segmented in RGB images helps to elegantly sketch-out vessels in the retina. The technique discussed has focused on pre-processing followed by segmentation and concluding with feature extraction. The authors in had proposed a procedure using support vector machines to investigate diabetic patient's images [11]. Best endeavours been kept for making a detailed study in the medical field with the support of neural networks. In Benson et al. study [12], both unhealthy and healthy retinas were concurrently classified with a multi-concavity modelling technique. Deepa and Jubilant [13] had used expectationmaximization (EM) algorithm for segmenting blood vessels as well as optic disc in the retinal images. A novel method by name 'graph-cut technique' has been used to take out the vessels in a retina vasculature. Along with surveying various segmentation practices, Lakwinder et al. [14] have used wavelet to deal with the task of segmentation. Initially, the technique Gabor wavelet works on improving the appearance of the blood vessels that amplifies directional structure and later the Euclidean distance measure is used upon the result of Gabor Wavelet outcome that precisely segments the vessels. Ravichandran [15] demonstrated the scheme to deal with high resolution images. Joyce et al. [16] devised a means that used unsupervised classification methodology in combination with filters to segments blood vessels. Marin et al. [17] came up with supervised classification for segmentation task. Taking a step forward, Likowski et al. [18] worked with deep neural network training large number of samples which undergo preprocessing using normalization of global contrast along with zero-phase whitening which is later augmented by means of transformations in geometric and corrections using gamma. Here, method's proliferations are accounted which includes a network classifies that multiple pixels concurrently using structured prediction.
In this paper, the approach that has been followed is the differential geometry-based technique under pattern-based category. Here, original intensity image having optimized pixels, after pre-processing and filtering done using PSO and Gaussian filter respectively, gets transformed into second order derivative image derived from Hessian matrix of the image's pixel under consideration for say I(x, y) as:
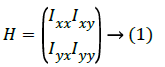
The fact is that Hessian matrix has Ixy=Iyx as it is symmetrical possessing real eigenvalues and orthogonal eigenvectors with invariant rotations. Hessian matrix's eigenvalue F(x, y) of every optimized image's pixel (the input image pixels gets optimized after applying PSO) are calculated using second order derivatives that gives second order matrix as g'' (x, y) if assume here the function of input image as F(x, y). Two eigenvalues minimum and maximum gets generated for every pixel as the Hessian matrix is symmetric by taking three Hessian parameters into consideration. And these eigenvalues are only considered for the analysis as they give their corresponding principal orientations of the image.
These eigenvalues are regarded as 'λ1' that measures the convexity (a small variation in the intensity gradient of the image) and 'λ2' that measures the concavity (a large change in the intensity gradient) in the respective eigen-directions. A gradient is a vector which has magnitude (strength of the change in the intensity) and direction (indicates the moving direction of the gradient). Here, the eigenvalues 'λ1', 'λ2' are related as λ1 ≤ λ2. The eigenvalue 'λ2' is maximum which corresponds to the maximum principal curvature that facilitates vessel structure extraction from image in the same direction of its eigenvector of the second derivative matrix. After calculating the eigenvalues on each pixel of the pre-processed PSO filtered image, weights are given to the pixel as vessel pixel which satisfies the condition |λ2|>1 which means such pixel belongs to a blood vessel region upon which region growing is done from that same direction of the eigenvector of that maximum principal curvature using the technique which is projected in section 2.2.1. Otherwise, the pixel is treated as a non-vessel portion or background of the image.
The works done by Martinez-Perez et al. [19] have used maximum principal curvature values as ridge detector facilitators. Using Hessian matrix, they had calculated second order derivative matrix of the input intensity image for blood vessels extraction. They have used different scaling techniques for the segmentation of blood vessels. Their segmentation accuracy was 0.9181. In this paper, optimization technique named 'particle swarm optimization' as a pre-processing step has immensely improved the accuracy of segmentation and the attempt has been successful with an outcome producing 0.9638 segmentation accuracy, which approximated to the ground truth accuracy of 0.9810.
Proposed Work
Image segmentation means dividing an image into identical sections. The outcome is an image separated in a set of regions. Image pixels organized in each region after segmentation relates to each other based on specific features including intensity, color, and texture. Specifically, blood vessel segmentation in retinal fundus images is such an area which focuses on the segmenting exact size, width, and orientation of the vasculature as the ultimate-goal.
Moreover, the approach proposed here is an unsupervised one that uses specific green channel from the image. The reason behind this is that the green channel has more contrast in the blood vessels from that of the background. In fact, the red channel of the image seems saturated in appearance and the remained blue part come into sight as dark. For efficient segmentation, it is much needed to work on with more contrast of blood vessels than background. Blood vessels are upon brighter background have dark elongated curvilinear structures with distinct diameters, sizes, and orientations. The large eigenvalues (maximum principal curvatures) of the Hessian matrix are the prime indicators that disclose the presence of blood vessels.
The proposed method proceeds in two stages:
• Pre-processing of the input image using PSO algorithm
• Post-processing of the pre-processed image by using maximum principal curvature
Pre-processing using particle swarm optimization
Finding the values of variables that minimizes or maximizes the defined objective function in accordance with the constraints specified is the ultimate purpose of optimization. There are many optimization techniques that have been proposed in the literature. Particle swarm optimization (PSO), ant colony optimization (ACO), and artificial bee colony optimization (ABC), genetic algorithm (GE) are most popular optimizers. The usage of particle swarm optimization here in this effort as a pre-processing technique to compute global optimum pixels served a great purpose in achieving huge segmentation accuracy.
Particle swarm optimization (PSO) algorithm: PSO feel right to that era of intelligent techniques that solves continuous and discrete optimization problems. In this algorithm, the particle which can be a point in the space or a pixel in a digital image possesses a position and velocity undergoes various iterations while comparing it with others and makes a perfect move accordingly for the goal of reaching to best destination. In [20], Kenney et al. conducted many empirical observations concerning the movement in the horde of fowls and in the multitudes of fish. This population based PSO, which cannot be precisely predicted have a very random distribution of probability or contain a pattern that may be analysed statistically, is an optimization algorithm producing optimized solution. The probable solutions (which are so called as 'particles') which are in problem space strictly follow the current optimum particles neighboring them. Initially, all the particles are represented as a solution and their distribution in the search space is purely random. Moreover, every particle with position and its corresponding velocity with respect to present population shows tendency to progress towards the best solution of the search space. During the process of algorithm, a particle fine-tune its position to seek the optimum solution focusing on its best position and distance from global best particle position. In every cycle of the procedure, particles that improve their existing positions are weighted through fitness function. The swarm is initialized with arbitrary particles as 'candidate solution' and it then looks for optima by modifying its position through iterations. Two optimum values as solutions namely, "pbest" that defines the fitness of objective function as the best solution of every particle attained for the moment. (ii) "gbest" is that best solution that gets followed by every other particle among the whole population.
Relation of PSO to the image segmentation: After reading the input image which is meant for segmentation, PSO method is selected with a threshold level. A pixel in an image or particle in population represents the same in PSO. For individual particle in the population of pixels, particle's corresponding fitness (which is the best value being achieved by that particle) and best move gets updated in the search space. After that, if the swarm (is the region in which particle exists) does improve for each particle, then rewarding is done by extending particle's life and for the swarm spawning that particle. Otherwise, punishment is charged in deleting the swarm/particle or reducing the swarm life. This procedure continues until the optimal particles (pixels) emerge with global best solution among the population of the pixels of the image.
The flow chart of PSO technique is as follows (Figure 2):

Figure 2: Flowchart of PSO algorithm.
In general, each particle can be viewed as a point in an N-size population contained in D-dimensional space. The ith particle of the population can be represented as XI=(xi1, xi2, xi3,........ xin). The finest remembered previous position of a particle resembles the best solution or fitness value which is tracked and represented as PI=(pi1, pi2, pi3,........ pin). The particle's position change given by the velocity and for particle i its velocity can be any value in the range VI=(vi1, vi2, vi3,........vin). Each particle's performance is assessed through a pre-defined fitness function that depends upon the problem domain.
In this paper, the above flowchart elegantly gives the time steps of the algorithm where every particle's position and velocity gets initialized with 0. Each particle's best position is treated as candidate solution which is defined as 'p_best' and 'g_best' is the swarm's global best position which is treated as optimal solution. Here, 'swarm' represents the total population.
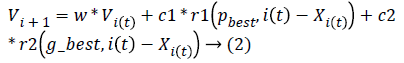
Iteratively, the algorithm proceeds to revise the positions and their corresponding velocities of each particle probing for local best of each particle as well as global best of the total particles to reach the optimum criteria which is set as a parameter. The essence of the algorithm lies in the swarm's intelligence that each particle retains information of its own best position which it researched so far searching towards the optimum solution while changing its velocities depending on the knowledge of its neighboring particles' best fitness positions in the swarm population. This is the reason a PSO algorithm is termed to a mixture of self-experiences with social experiences. Each particle amends its position based on its existing position, its current moving velocity, the distance between its existing position and it's p_best, the distance between its present position and swarm's g_best. Any particle changes to new position by adjusting its new velocity by using below equation:
And it's new position then adjusted by using:
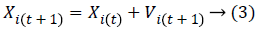
where Xi, Vi indicate the position and the velocity of ith particle respectively. And, p_best indicates the personal best position of ith particle and g_best indicates the global best position achieved so far by the swarm taking into consideration of all particles. The values 'c1' (cognitive parameter, used to accelerate each particle for their local best position), 'c2' (social parameter, used to pull all particle to a global best position) are the position acceleration constants and the values 'r1' and 'r2' represents the random values generated between (0, 1).
Point to note is that 'c1' and 'c2' are crucial parameters which usually set up with a constant value '2' that tells each particle's fitness (confidence of self) and the swarm's fitness (confidence of social behavior), respectively. These seem to be very important aspects of the algorithm which handles equilibrium between exploration at each particle best solution and exploration bent towards global optimum solution along with properly chosen parameter so called as inertia weight 'w' which is a positive constant. Inertia weight's importance has been discussed [21]. When chosen 'w' as small, the PSO algorithm becomes a local search technique leads to an acceptable solution that is reachable to the initial space of search, and then PSO converges finding a global optimum sooner, if not finding the global optimum is difficult. But, if chosen 'w' as large, the PSO becomes a global search technique giving optimum solution despite many numbers of iterations. Coming to 'c1', 'c2' parameters, if chosen, the value of 'c1' as high then it motivates the individual particles to accelerate its local best position, while the high value of regulates the global best solution of the swarm and results sooner convergence towards global best position.
In this paper, 'c1' and 'c2' are initialized with 1.2, weighting factor 'w' (inertia weight, when chosen as large gives global exploration and if chosen small leads to local exploration) initialized with 1.8 which is reduced progressively in succeeding iterations, 'r1', and 'r2' represents two random variables whose values are in the range (0, 1), maximum number of iterations for the convergence of the algorithm is given as 150, and the number of optimal particles the algorithm returns is 150. The main drawback of PSO algorithm is more time consumption even most of the time gives a perfect optimization result as desired.
Post-processing using maximum principal curvatures
Background: Differential geometry [22] means description or measurement carried with differential calculus i.e. through derivatives. Derivative quantity includes curves (vectors) or surface tangent (tangent plane). No coordinate system globally so far exists for 3D shapes rather corresponding measurements are tailored to fit with the 2D normal or tangent plane. Coming to image processing, coordinate system so used determines the image intensity in up direction. Image processing and differential geometry for 3D surfaces seem conceptually similar but, they are varied in calculations.
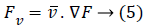
Basics of differential geometry in image analysis: Let the function F(x, y) corresponds to function of intensity values of the image, then with respect to x, the image's first order derivative is Fx and with y is Fy. In the same manner, the derivative of F(x, y) with respect to the direction of any unit vector v is Fv. Accordingly, the image's second order derivative of F(x, y) with respect to x is Fxx and with regard to y is Fyy. Through induction, the derivative of Fx concerning with y gives mixed partial derivative as Fxy. Consequently, the image function F(x, y)'s second order derivative is Fuv corresponding to vector u changing its direction to v.
Gradient (image's first-order derivative quantity): The gradient of the image is a two-dimensional vector quantity that have magnitude and direction that varies at each point. For an image, gradient is termed as the first order derivative quantity of that image. The gradient image's function F(x, y) is:
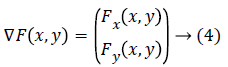
Also, the gradient's direction of any given point is with precipitous incline such that the gradient's magnitude represents the steepness at that inclination. This particular gradient derives the tangent plane corresponding to that point. The most important thing is that the gradient gives the first order derivative in any direction, for example the first order derivative Dv of the unit vector v given by gradient D, which infers first order derivative information there exists at any point, can be achieved using below equation:
The gradient direction which is termed to be one of the inherent image's directions along with its perpendicular, surely constitutes, level curves in an image and are known as first order gauge coordinates. In the literature of differential geometry towards image processing, a term called 'isophote' represents that curve having stable intensity where a normal corresponding to an isophotic curve represents the direction of the gradient. Simultaneously, the tangent to that isophote is the gradient's perpendicular. Let the directions of guage coordinates be as u and v, then relation with the gradient can be given as below equation:
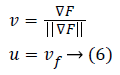
The local features of level curves of an image (isophotes) using guage coordinates could be well derived.
Hessian-second order derivate quantity of the image: As gradient is termed to be images' first order derivative, the second order derivative of the same image is called Hessian which is disclosed below:
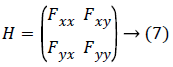
Since Fxy=Fyx, because of the fact that the partial derivative of Fx with respect to y is Fxy and vice-versa, the Hessian matrix for each value of original image is symmetric.
One can use the Hessian for calculating second-order derivatives using the following equation
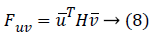
Or if the similar vector used on matrix's either side then the following equation can be used:
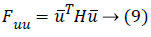
For example, let the vector in the y direction is (0, 1)T (it is a unit vector) then second order form in y direction can be achieved with a calculation given below:
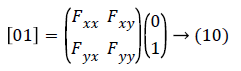
This gives the value as Fxx
Similarly, one can get the second derivative quantity of an image function in any desired direction.
The Hessian matrix's essential properties include (a) the determinant of the matrix is the product of its eigenvalues (b) proper values of x as well as y generates a diagonal matrix which represents the eigenvectors of the Hessian. The corresponding elements which are diagonal represent eigenvalues.
Principal curvatures and directions: Hessian matrix's eigenvalues along with their corresponding eigenvectors gained much importance in the geometry. The eigenvector having large eigenvalue is the first eigenvector that determines the direction of the maximum curvature. Minimum eigenvalue's corresponding eigenvector is the second eigenvector that gives the direction of the least curvature. From the preceding discussion, it is elegant that respective eigenvalues produce corresponding magnitude of the curvatures. The eigenvectors and eigenvalues of the Hessian are called as principal directions and principal curvatures respectively. In simple terms, at a given point on a surface, the maximum value and minimum value of the normal represents principal curvatures [23]. Significantly, the principal curvatures measure the highest and lowest bending of a regular surface at each point. detection of vessel in retinal fundus image can be formulated as image analysis. The size, width, and direction of retinal blood vessel can be acquired by means of maximum principal curvature. A spatial derivative of the image's intensity gives facts related to the image's topology. The principal curvature describes the variations in the intensity's gradient in relation to the neighborhood of a point in which the vessels that emerge have ridge-like structure in the images. The problem of trench detection medial lines of the trenches is characterized by high magnitudes of the curvature. The maxima values of maximum principal curvatures would require trenches to locate medial lines. Vessel trench are detected using curvature measurement.
Blood vessels extraction: Blood vessels are the features fetched from the fundus retinal images using the hessian matrix's eigenvalues. For every image pixel of the original input image (here, only the PSO-based optimum pixels are taken into consideration since pre-processing is carried by particle swarm optimization technique), the partial derivatives of second order matrix is calculated. This matrix which is then formed is Hessian matrix that determines image's intensity distinctness of the image. The authors choice of naming the function as 'Lambda function' that computes eigenvalues which are maximum in the Hessian matrix represents the startup points of every blood-vessel from where the region-growing of the vessel is carried out in the direction of their respective calculated eigenvector of the matrix. Here, region growing of the blood vessels by 'Lambda function' is accomplished by multiplying a rescaled (rescaling using un- signed integer image form) mask with the rescaled (rescaling using un-signed integer image form) maximum principal curvatures of the Hessian. This mask takes two parameters namely (1) the converted binary form of PSO-based image and (2) diamondstructuring element that takes into consideration only those pixels which are reachable to the radius given as parameter and proceeds accordingly by convoluting to the maximum principal curvatures of the Hessian.
The function to calculate maximum principal curvatures leading to effective extraction of vessels vasculature from the given PSO-based input image is so named as 'Lambda' as a dedication to the word 'maximum principal curvature' which is mathematically termed as 'Lambda'.
Related work using maximum principal curvatures: In image processing, maximum principal curvature is the highest eigenvalue (point) of the computed second order derivative corresponding to the direction of eigenvector (line) of the Hessian matrix calculated on each pixel value of the image which is being processed. Exhaustive research has been done on curves and surfaces and their usage in the processing satellite or medical images specifically in blood vessels segmentation.
Carsten [24] disclosed three ways to extract maximum principal curvature in his splendid work. He mentioned the first way which explicitly extracts the contour lines that find the points of maximum curvature and later are linked those extracted points into ridges (ridges are the curves in images). Second way which deals with the extraction of ridges at those points whose image's principal curvatures would be a local maximum. Third way is getting the line's direction which could be computed from the Hessian matrix. Here, the line points which are established by choosing those pixels which do have large second order derivative are perpendicular to the direction of the line. The benefit is such where lines detection done by sub-pixel accuracy. In his work, he presented the calculation of eigenvalues from second order derivates and their respective eigenvectors in order to mark the direction of curvilinear structures as blood vessels that then are formed with point linking algorithm that regards the distance and the angle between the neighborhood points of the earlier calculated maximum eigenvalues.
Zana et al. [25] had used curvature evaluation as feature to extract blood vessels and had used mathematical morphological operators to handle various types of undesirable structures i.e. noise that they had confronted while getting treeshaped vasculature of blood vessels during segmentation. Authors have mentioned four cases: 1) Noise inferred during digitization process or element having texture as white noise with low intensity. 2) Confusion from the background feature which is linear could be regarded as blood vessels. This is very rare in segmentation. 3) Patterns seem to be non- linear which can any form of the sub-cases: a) Dark or large bright areas; b) Thin irregular zones that may either bright large or dark; c) Dark or small bright areas. 4) Ratio of low signal and noise related to vessels intensity.
Martinez-Perez et al. [26] devised an excellent technique that depends on scale-space analysis where width, orientation, and size of the vessels were extracted by using main features of geometry those are based on the first derivative (gradient) which derives edges in the intensity and the second derivative (Hessian) which derives maximum principal curvature of the intensity respective to the scale-space which provided details of the image's topology. In their effort, they used the Hessian tensor's values of maximum principal curvature to extract the blood vessel like structures. The pixels as vessel or background were classified using the maximum principal curvatures.
In this paper, a very successful attempt has been made to optimize the extraction of blood vessels using maximum principal curvatures by means of using particle swarm optimization technique as pre-processing technique to select the optimum pixels to work with 'Lambda function' which computes the maximum eigenvalues and does the region growing along with their eigenvectors direction producing outstanding segmentation accuracy of 96% which can serve the purpose of the research to handle the eye-related diseases proactively.
The algorithm steps of the proposed technique are listed below:
Step 1: Let an image from the dataset be read as input
Step 2: Calculate global optimum pixels using PSO algorithm
Step 3: Apply Gaussian filter on PSO image to remove noisy pixels.
Step 4: Compute second order derivative matrix image using Hessian for every pixel of PSO-filtered image.
Step 5: using 'Lambda function', find maximum eigenvalues of the pixels of Hessian as maximum principal curvatures and then extract curvilinear structure as blood vessel vasculature that tends towards the direction of the eigenvectors of the respective maximum eigenvalues using morphological operator.
Step 6: Apply adaptive histogram equalization to enhance contrast and smooth the segmented image to handle unforeseen noise and boundaries artificially introduced.
Step 7: Using ISO data thresholding, segment the foreground vasculature of blood vessels from the image background until the condition of convergence fulfils.
Step 8: Apply morphologically opened operation to prune falsely segmented isolated regions.
Below in Figure 3 is the flowchart that clearly depicts the new technique been designed that achieves the efficient segmentation of blood vessels.

Figure 3: Flow-chart of proposed work.
The devised new approach in segmenting the blood vessels uses a well-known optimization technique PSO (Particle swarm optimization) is used as pre-processing step for computing the global optimal pixels which facilitates to leap from working with all pixels. Later, Gaussian filter is applied on the PSO image that not only reduces image noise and detail but also enhances image structures. Later, maximum principal curvatures are computed upon optimized pixels which help to ideally segment the blood vessels giving the vasculature in the direction of respective eigen vector while removing false segmented isolated regions using Laplacian operator which is a mask of second order derivative. To segment the blood vessels, extraction of green slice of the image is carried out. Then the segmented image is made elegant with contrast enriched ISO data thresholding which gives the vasculature of blood vessels as foreground suppressing the background as dark.
Gaussian filters: In an image, noise is such a thing which manifests due to haphazard discrepancy of brightness and/or color information which is formed due to digital camera's sensor or circuitry. Gaussian noise occurs inherently due to the level of illumination and its own temperature and sometimes the electronic circuits which are connected to the sensor inject their own share of electronic circuit noise. In order to reduce such noise, Gaussian filter is used to blur the image using a Gaussian function.
Thresholding: ISODATA thresholding computes global image threshold using iterative isodata method which initially computes a global threshold (LEVEL) that can be used to convert an intensity image to a binary image and the level of the intensity is a normalized intensity value that lies in the range (0, 1). The histogram is initially segmented into two parts using a starting threshold value which is half the maximum dynamic range. The sample mean of the gray values associated with the foreground pixels and the sample mean of the gray values associated with the background pixels are computed. A new threshold value is computed as the average of these two sample means. The process is repeated, based upon the new threshold, until the threshold value does not change any more giving the segmentation of blood vessels.
Objects which are contained in an image are analysed based on the interest preferred. In a image, objects that appear as foreground are segmented from background using specific segmentation techniques such as thresholding, edge finding, binary and gray-value mathematical morphology. Here, ISO data thresholding is a kind of thresholding which not only separates foreground from background but also improves the quality of the segmented result.
Experimental Results and Discussion
Databases
DRIVE: This database [27] which was introduced in 2004 possesses 40 images being captured by Canon CR5 nonmydriatic 3CCD camera at a rotation of 450 Field-Of-View (FOV) which are further categorized as trained and test sets having 20 images each. Every image has a size 768 × 584 pixels and 8-bits per pixel. All the contained 40 images have normal and abnormal images which are hand-labeled by experts for evaluating the performance of any proposed method. Another important feature is that the database also includes masks that separate the field-of-view (FOV) from the remaining part of the image. Also, there are two in sets which are manually hand labeled images exists. In which first set which manually hand labeled for all the 40 images is utilized as source of ground truth for evaluation of segmentation results.
STARE: The STARE database [28] has 397 fundus images with size 700 × 605 pixels of each image which are captured by TopCon TRV- 50 fundus camera. It consists of annotations related to 39 retinal distortions concerning each image. The specific dataset of 40 images provides ground truth for segmentation categorized in two sets in which the first set which is being hand labeled is utilized as ground truth while the second set being hand labeled can be treated as a second observer.
The proposed algorithm has been implemented in MATLAB software using windows operating on a Pentium III 2.10 GHz PC. The images from DRIVE and STARE databases are digitized with each 768 × 584 pixels with 24 bits per pixel having a standard RGB resolution and 700 × 605 pixels respectively. The experiments have been done on the retinal image's green band (Figures 4-6).

Figure 4: (a) Depicts the original retinal image (example image 1), (b) is the extracted green channel Image, (c) is the contrast enhancement by adaptive Histogram equalized image and (d) depicts the final segmented retinal blood vessels using proposed optimal maximum principal curvature.

Figure 5: First row images show that original retinal Images (a) which is taken from DRIVE data base and its corresponding segmented images shown in Figure b first row. Similarly, second row shows the original images (a) which is taken from STARE dataset and its segmented vessels as shown in second row Figure b images respectively.

Figure 6: Segmentation results of first retinal image from the DRIVE database using different methods (a) Original image (example image 3), (b) Ground truth image of the first observer, (c) AI Rawi et al. [3], (d) Cinsdikici et al. [16], (e) Fraz et al. [9] and (f) Proposed optimized maximum principal curvature method.
Performance measurement
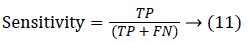
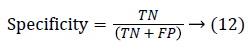
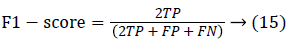
Since the main objective in automated retinal image investigation methods is facilitating clinical decision-support. To measure the performance objectively means achieving the point of conformity between outputs of the proposed techniques and the mentioned reference benchmark (ground truth), which is a set of typical manual annotations being mentioned by expert ophthalmologists for the respective database. Commonly used metrics that assess the performance of segmentation approaches are sensitivity, specificity, precision, accuracy, and the F1-score. These measures depend upon the count concerning the values calculated:
(1) true positive (TP gives pixels which are correctly identified),
(2) false positive (FP gives pixels which are incorrectly identified),
(3) true negative (TN gives pixels which are correctly rejected), and
(4) false negative (FN gives pixels which are incorrectly rejected)
where one can derive the following measures:
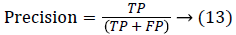
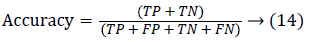
Parameters chosen for the performance evaluation of the proposed technique are accuracy, true-positive rate, falsepositive rate. Suppose an outcome of computer-segmented image is (CS) and its counterpart ground truth human-labeled segmented image is (GT), then the measurement of performance attributes can be given by:
True positive (TP): Any pixel is counted as a vessel pixel if it exists in both CS and GT. The TP rate is calculated as a ratio of number of true positives to the total count of vessel pixels in GT.
False positive (FP): Any pixel that is treated as vessel pixel only in CS not in GT. The false positive rate is calculated as a ratio of number of false positives to the total count of nonvessel pixels in GT. Accuracy: is defined as the ratio of the correctly classified vessel pixels over the total number of pixels considered for evaluation.
Generally, higher values of true positive fraction, true negative fraction leads to good segmentation results and subsequently higher values of false positive and false negative fraction leads to worst segmentation results. Based on the analysis done in this paper, the above Tables 1 and 2 of existing and proposed methods on online available retinal fundus Image databases, it can be inferred that the higher fractional value of True Positive Fraction and lower fractional value lead to efficient segmentation. Tables 1 and 2 clearly show that the existing methods were outperformed by the proposed optimized maximum principal curvature method.
| Author(s) | Techniques | STARE | DRIVE | ||||
|---|---|---|---|---|---|---|---|
| Accuracy | TPF | FPF | Accuracy | TPF | FPF | ||
| Elisa et al. [29] | Line operators and support vector classification | 0.9351 | 0.61 | 0.0903 | 0.9473 | 0.775 | 0.0275 |
| Martinez-Perez et al. [30] | Maximum principal curvature of the Hessian tensor | 0.941 | 0.75 | 0.0438 | 0.9382 | 0.724 | 0.0345 |
| Yu et al. [31] | Multiscale enhancement and second-order local entropy | 0.9463 | 0.781 | 0.0291 | 0.9426 | 0.753 | 0.0255 |
| Palomera-Perez et al. [32] | ITK parallel implementation | 0.926 | 0.817 | 0.019 | 0.925 | 0.967 | 0.0227 |
Table 1. Performance table of existing techniques for retinal blood vessels in terms of accuracy, TPF and TNF.
| Images | STARE | DRIVE | ||||
|---|---|---|---|---|---|---|
| Accuracy | TPF | FPF | Accuracy | TPF | FPF | |
| Image 1 | 0.9678 | 0.8614 | 0.016 | 0.9556 | 0.826 | 0.0224 |
| Image 2 | 0.971 | 0.892 | 0.0121 | 0.9643 | 0.858 | 0.0159 |
| Image 3 | 0.9738 | 0.8981 | 0.0118 | 0.9656 | 0.871 | 0.0137 |
Table 2. Performance table of proposed method for retinal blood vessels in terms of Accuracy, TPF and TNF.
Conclusion
Using optimization technique as pre-processing step has saved a lot of work which made to deal with optimized pixels. The effort kept to pull out features such as maximum principal curvatures of these optimized pixels in turn has improved the way to extract blood vessels yielding productive results of segmentation. Comparing the results with the benchmarked proven results, this proposed method segmented the retinal fundus images with remarkable accuracy. Such segmentation can be a tool for the ophthalmologists in diagnosing the retinal diseases.
References
- Verma K, Deep P, Ramakrishnan AG. Detection and classification of diabetic retinopathy using retinal images flight. Annual IEEE India Conference (INDICON) 2011; 4: 1-6.
- Kanski JJ. Clinical ophthalmology (6th Edn.). Elsevier Health Sciences, London, UK 2007.
- Fraz MM, Remagnino P, Hoppe A, Uyyanonvara B, Rudnicka AR, Owen CG, Barman SA. Blood vessel segmentation methodologies in retinal images a survey. Comput Meth Prog Biomed 2012; 1: 407-433.
- Marino C, Penedo G, Penas M, Carreira J, Gonzalez F. Personal authentication using digital retinal images. Patt Anal Appl 2006; 9: 21-33.
- Kose C, Ikibas C. A personal identification system using retinal vasculature in retinal fundus images. Exp Sys Appl 2011; 38: 13670-13681.
- Fraz MM, Remagnino P, Hoppe A, Uyyanonvara B, Rudnicka AR, Owen CG, Barman SA. An ensemble classification-based approach applied to retinal blood vessel segmentation. IEEE Trans Biomed Eng 2012; 59: 2538-2548.
- Liskowski P, Krawiec K. Segmenting retinal blood vessels with deep neural networks. IEEE Trans Med Imag 2016; 35: 2369-2380.
- Orlando JI, Prokofyeva E, Blaschko MB. A discriminatively trained fully connected conditional random field model for blood vessel segmentation in fundus images. IEEE Trans Biomed Eng 2017; 64: 16-27.
- Cemil K, Francis KHQ. Vessel extraction techniques and algorithms-a survey. Proceedings of the Third IEEE Symposium on Bioinformatics and Bioengineering 2003.
- Hempriya, Sharma A. Detection of blood vessels and diseases in human retinal images. Int J Comp Sci Commun Emerg Trends Eng Manag 2013; 9-11.
- Rafega B, Soumya. Automated diagnosis of retina images for diabetic patients based on BP and SVM. J Comp Sci Info Technol 2015; 4: 299-306.
- Benson SYL, Yongsheng G, Alan WCL. General retinal vessel segmentation using Regularization based multiconcavity modeling. IEEE Trans Med Imag 2010; 1369-1381.
- Deepa T, Jubilant S. Segmentation of the blood vessel and optic disc in retinal images using EM algorithm. IOSR J Comp Eng 2015; 17: 102-112.
- Lakhwinder K, Smriti K, Chandani N. Retinal blood vessel segmentation algorithm for diabetic retinopathy using wavelet: a survey. Int J Rec Innov Trends Comp Commun 2015; 3: 927-930.
- Ravichandran CG. Blood vessel segmentation for high resolution retinal images. IJCSI Int J Comp Sci 2011; 8: 389-393.
- Joyce V, Tsang R, Oliveira G, Jan S. Unsupervised retinal vessel segmentation using com binedfilters 2016.
- Marín D, Aquino A, Gegundez-Arias ME, Bravo JM. A new supervised method for blood vessel segmentation in retinal images by using gray-level and moment invariants-based features. IEEE Trans Med Imag 2011; 30: 146-158.
- Liskowski P, Krawiec K. Segmenting retinal blood vessels with _newline deep neural networks. IEEE Trans Med Imag 2016; 35: 2369-2380.
- Martinez-Perez ME, Hughes AD, Stanton AV, Thom SA, Bharath AA, Parker KH. Retinal blood vessel segmentation by means of scale-space analysis and region growing. Lect Notes Comp Sci 1999; 90-97.
- Eberhart R, Kennedy J. A new optimizer using particle swarm theory. MHS95. Proceedings of the Sixth International Symposium on Micro Machine and Human Science 1995.
- Shi Y, Eberhart R. A modified particle swarm optimizer. IEEE International Conference on Evolutionary Computation Proceedings. IEEE World Congress on Computational Intelligence (Cat. No.98TH8360) 1998.
- https://en.wikipedia.org/wiki/Differential_geometry
- http: //www.math.union.edu/~jaureguj/principal_curvatur es.pdf.
- Steger C. Extracting curvilinear structures: a differential geometric approach. Comp Vis ECCV 1996; 96: 630-641.
- Zana F, Klein JC. Segmentation of vessel-like patterns using mathematical morphology and curvature evaluation. IEEE Trans Image Proc 2001; 10: 1010-1019.
- Martínez-Pérez ME, Hughes A, Stanton A, Thom S, Bharath A, Parker K, Taylor C, Colchester A. Scale-space analysis for the characterisation of retinal blood vessels. Medical Image Computing and Computer-Assisted Intervention 1999; 99: 90-97.
- Staal JJ, Abramoff MD, Niemeijer M, Viergever MA, van Ginneken B. Ridge based vessel segmentation in color images of the retina. IEEE Trans Med Imag 2004; 23: 501-509.
- The STARE project, [online] Available: http: //www.ces.clemson.edu/~ahoover/stare.
- Ricci E, Perfetti R. Retinal blood vessel segmentation using line operators and support vector classification. IEEE Trans Med Imag 2007; 26: 1357-1365.
- Martinez-Perez ME, Hughes AD, Thom SA, Bharath AA, Parker KH. Segmentation of blood vessels from red-free and fluorescein retinal images. Med Image Anal 2007; 11: 47-61.
- Yu H, Barriga S, Agurto C, Zamora G, Bauman W, Soliz P. Fast vessel segmentation in retinal images using multiscale enhancement and second-order local entropy. Med Imag Comp Aid Diagn 2012.
- Palomera-Perez MA, Martinez-Perez ME, Benitez-Perez H, Ortega-Arjona JL. Parallel multiscale feature extraction and region growing application in retinal blood vessel detection. IEEE Trans Info Technol Biomed 2010; 14: 500-506.