Research Article - Biomedical Research (2017) Volume 28, Issue 2
Motor imagery EEG discrimination using Hilbert-Huang Entropy
Yuyi1, Zhaoyun1*, Li Surui2, Shi Lijuan1, Li Zhenxin1, Dong Bingchao11Department of Biomedical Engineering, Xinxiang Medical University, Henan, China
2Department of Biomedical Engineering, Sanquan Medical College, Henan, China
- *Corresponding Author:
- Zhaoyun
Department of Biomedical Engineering
Xinxiang Medical University, Henan, China
Accepted date: June 20, 2016
Abstract
The selection of the optimal feature of EEG signals is important for the discrimination of mental tasks in brain-computer interface (BCI) research. This research presents a new technique for feature extraction of EEG signals sampled from subject executing left and right hand motor imagery (MI) using Hilbert- Huang Entropy (HHE). In our method, the raw signal is analysed with an elliptical band-pass filter and Hilbert-Huang Transform (HHT). The marginal spectra of beta and mu bands are the interesting features calculated from the Hilbert-Huang spectrum of the selected Intrinsic Mode Functions (IMF) of the filtered EEG signal. The Shannon entropy (SE) is then utilized within the framework of the HHT algorithm. The formed feature vector calculated by the SE transform is utilized to train a support vector machine (SVM) classifier for classification. The performance of the new method is compared to the HHT algorithm, which indicates the HHE algorithm is promising for BCI classification.
Keywords
Brain-computer interface (BCI), Motor imagery (MI), Hilbert-Huang entropy (HHE), Intrinsic mode functions (IMF), Shannon entropy (SE), Support vector machine (SVM).
Introduction
Brain-computer interface (BCI) is an emergent multidisciplinary technology that provides a new channel of communication between brain and environment, which enables a subject with neuromuscular disabilities to use the electroencephalography (EEG) to communicate and control devices without any peripheral muscle activity [1-2]. For this type of BCI based on motor imagery, the EEG signal is a kind of spontaneous signals measured through electrodes placed on the surface of the scalp. More and more evidences indicate that the kinaesthetic imagination of actual body movement can result in the underlying neurophysiological phenomena, which is termed the event related synchronization (ERS)/ desynchronization (ERD) in the sensorimotor cortex [3]. And the corresponding EEG signals, especially in the μ (8-13 Hz) and β (14-25 Hz) frequency band, have been used as good signal features to recognize some mental tasks for motor imagery-based BCI.
BCI can be divided into different steps: the acquisition of EEG signals, the signal pre-processing, the feature extraction, the classification and the device controller. The key problem in motor imagery-based BCI is how to extract the features which exactly represent different mental tasks from the EEG signals. In recent years, many EEG feature extraction algorithms have been used in BCI applications: power spectral density (PSD) [4], short time Fourier transform (STFT) [5], autoregressive (AR) model [6] and wavelet transform (WT) [7]. PSD is well known, which could give any power spectrum but insensitive to nonlinear structure contained in time series.
STFT is a powerful tool for extracting features from EEG data in time domain and frequency domain. But it is ineluctable to weigh the advantage and disadvantage of time and frequency resolutions, and the estimation of frequencies is sensitive to noise. The AR model has the advantages of spectral estimation and signal modelling, but the model order has to be selected via order selection criteria, and different model orders can give inconsistent results. The WT extended from STFT capture transient features of signals and localize them in both time and frequency domain limited by fundamental uncertainly principle, and also difficult to select an appropriate wavelet and decomposition level.
More recently, termed Hilbert-Huang transform (HHT), an emerging technique for analysing nonlinear and non-stationary signals, has been utilized to analyse biomedical signals, such as ECG de-noise [8], detecting seizure from EEG signal [9], extraction of schizophrenic EEG synchrony [10], and specially involving analysis in steady-state evoked potential (SSEP) [11] and evoked potentials (P300) [12]. A preferable application of the HHT algorithm for discrimination of mental tasks is proposed in this research. As an algorithm of time-frequency analysis, HHT can produce physically meaningful representations of signal both in time and frequency domain. The core of this algorithm to decompose signal is datadependent and posteriori-defined, and the inner scales of the decomposed signal are great adapted for EEG signal processing. HHT is composed of empirical mode decomposition (EMD) and Hilbert spectral analysis (HSA), which intuitively decomposes original signal into a set of symmetric intrinsic mode functions (IMFs) amplitude and frequency modulated [13]. Shannon entropy (SE) is a measure derived from the original definition suggested by Shannon [14], who defined entropy as the average amount of information of a probability distribution. It has been widely used for analysing non-stationary signals. Moreover, this technique is a useful tool for quantifying the global regularity of EEG signal [15-17]. Martis et al. used the selected spectral entropy and spectral energy of IMFs to automatically diagnose seizure. Hemalatha predicted and detected seizure from EEG signal with continuous wavelet entropy. Ni and Wang employed Shannon entropy to detect the deepening features of anaesthesia degree. In this work, SE combined with HHT algorithm, is used to detect the features of regular contained in EEG signal during implementing mental tasks which will be used as feature vector for classifier. The proposed method can not only analyse EEG signals by data-dependent and posteriori-defined HHT which is not such as WT with a predetermined appropriate wavelet, but also utilize SE to reveal the irregular changes of EEG features during implementing mental tasks.
In general, purpose of the research in this paper is to examine the ability of SE method combined with HHT technique to extract features from EEG signals in discriminating mental tasks. In this work, HHT has been applied for acquiring the marginal spectrum by analysing the instantaneous timefrequency information of mental task data. And the frequency band (830 Hz) involving μ and β rhythm of acquired marginal spectrum is used to compute the SE feature. Moreover, in order to obtain the SE features of different period and time interval, the sliding window technique is applied to segment the original EEG signal. The obtained SE feature vector is used by the RBF-SVM (radial basis function kernel) classifier for discrimination of mental tasks.
Methodology
This work proposes a new technique based on time-frequency informationwhich utilized both HHT and SVM to identify mental tasks. HHT has been used to acquire the time-frequency features of EEG signals. And then SE has been applied to the time-frequency features which are segmented corresponding to the μ and β rhythm of EEG signal based on the sliding window technique, which extracts the SE features, named as Hilbert- Huang entropy (HHE). Finally, RBF-SVM classifier is applied to the classification of HHE features. The flow diagram of this work is given in Figure 1.

Figure 1: Flow diagram of the new algorithm.
Hilbert-Huang Transform
Hilbert-Huang transform is a data-dependent and posterioridefined signal analysis algorithm. Comparing with other timefrequency analysis methods, HHT has an adaptive ability to track the evolution of time-frequency basis in the original signal without employing a time or frequency resolution window, and also can provide much detailed information at discretionary time-frequency scales [18].
Empirical mode decomposition
As a data-dependent algorithm, EMD could decompose a nonlinear and non-stationary signal into a set of IMFs which are band limited. The obtained IMFs must satisfy two conditions [18]:
1. In the whole data set, the number of extremes and zero crossings must either equal or differ no more than one;
2. At any point, mean value of the envelope defined by local maxima and local minima is zero.
The EMD algorithm for decomposing a signal x (t) based on a sifting process can be explained by the following steps:
1. Detect the local maxima and minima of signal x (t);
2. Obtain the upper Xup (t) and lower Xlow (t) envelope defined by local maxima and minima separately;
3. Calculate the mean of both envelopes, designated as m(t);
 →(1)
→(1)
 →(2)
→(2)
5. Check whether h(t) satisfies the two above conditions for IMF or not. If the conditions are satisfied , set ; Or is treated as the new data, and the steps 1-4 are repeated;
6. Iterate steps 1-5 to obtain all IMFs of the signal until the residual r(t) is a monotonic function.
Finally, the signal x (t) can be summed as follows:
 →(3)
→(3)
Where n, is the number of all IMFs, and rn (t) is the final residual which can be either the mean trend or a constant.
Hilbert spectral analysis
Hilbert transform is employed to analyse every IMF for instantaneous frequencies ωi (t) and amplitudes ai (t) after calculating all IMFs though EMD method. For any signal x (t), its Hilbert transform X̂ (t) is
 →(4)
→(4)
 →(5)
→(5)
Where, is the Cauchy principal value, z (t) is the analytic signal, and φ (t) is the instantaneous phase
 →(6)
→(6)
And then the instantaneous amplitude a (t) and the instantaneous frequency φ (t) are computed
 →(7)
→(7)
 →(8)
→(8)
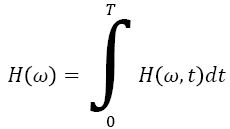
Therefore, the Hilbert-Huang spectrum H (ω, t) and the local marginal spectrum h (ω) are represented as
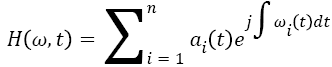 →(9)
→(9)
 →(10)
→(10)
Features extracted based on Hilbert-Huang Entropy
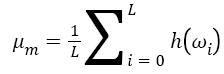
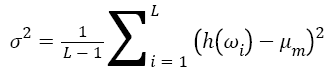
From previous subsection, the HHT has been fully described to obtain the Hilbert-Huang spectrum H (ω, t) which provides time-frequency distribution of the processed signal [19]. Moreover, the marginal spectrum h (ω) provides a measure of all amplitude (or energy) contribution from the interesting frequency. Therefore, local marginal spectrum h (ω) of frequency band (830 Hz) involving μ and β rhythm is selected to calculate the features of mean μm and variance σ2:
 →(11)
→(11)
 →(12)
→(12)
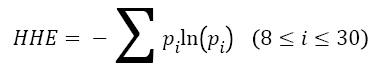
However, these traditional features of mean μm and variance σ2 cannot satisfy to describe the information of EEG signal during motor imagery. Therefore, this work employs a new feature, named as Hilbert-Huang entropy (HHE), which is calculated by Shannon entropy based on local marginal spectrum. Modified from the definition of Shannon entropy [20], HHE is defined as
 →(13)
→(13)
 →(14)
→(14)
For signal processing, Shannon entropy reveals the irregular changes in signal properties like spectrum and amplitude distribution. Therefore, HHE can display the irregular level of local marginal spectrum distribution at a specific time, which is selected as the feature of EEG signal to identify different mental tasks. In order to optimize the HHE, the sliding time window technique is employed to segment the original EEG signal.
Classification based on support vector machine
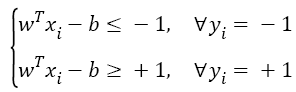
In this work, SVM classifier is selected as the classification algorithm to classify the extracted feature vectors of EEG signals. As a machine learning method with statistical learning theory [21], SVM has an excellent performance on solving the model identification problem of small sample, nonlinear and high dimensional. The key of SVM algorithm is to find a hyper-plane and maximize the margin to separate the training data xi with labels yi. The constraint is shown as follows:
 →(15)
→(15)
Where, w is the weighting vector, and b is the bias term.
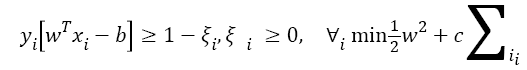
So as to obtain the optical hyper-plane, SVM algorithm has the ability to tolerate misclassification:
 →(16)
→(16)
Where, ξ is slack variable, and C is a positive real weighting constant.
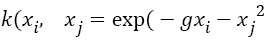
In addition, the choice of the kernel functions has also an important influence on SVM classification. In this work, radial basis kernel, also named radial basis function (RBF), is selected:
 →(17)
→(17)
Where, g controls the width of RBF kernel.
Finally, the features extracted are sent by HHE algorithm into SVM classifier to obtain the identification result.
Results
The data utilized in this work is the Dataset III of BCI 2003 competition provided by University of Technology Graz in Austria. The dataset has two sets which are the training dataset x_train and the testing dataset x_test. Each one has 140 threechannel (C3, Cz and C4) trials, the duration of every trial is 9 s, and the sampling frequency is 128 Hz. All EEG signals were taken from one healthy volunteer (female, 25 y) with imagining left or right hand movements. Moreover, y_train contains the class labels ‘1’, ‘2’ for left and right hand imagery movements of the training dataset. More detailed description of the dataset is shown in the manuscript [22]. The EEG signals of imagining left and right hand movements are shown in Figure 2.

Figure 2: The motor imagery EEG signals.
This work employs the EMD method to decompose the dataset into a set of IMFs. Figure 3 displays the decomposition in several IMFs of channel C3 and C4 EEG signals for right hand motor imagery, which shows the IMFs are ordered by frequencies. In order to select the appropriate IMFs, all IMFs have been transformed into frequency domain by power spectrum estimation, and finally the first two IMFs are applied to further analysis using Hilbert transform.

Figure 3: The IMFs of channel C3 and C4 EEG signals for right hand motor imagery decomposed by the EMD algorithm.
As demonstrated above, HHT is great adapted to processing nonlinear and non-stationary signals. Moreover, the Hilbert- Huang spectrum (HHS) can represent the time-frequency distribution of signals. With a comparison made between the two Hilbert-Huang spectrums of channel C3 and C4 EEG signals for left hand motor imagery, the energy distribution of all two channel signals is different in different time and frequency, and both under 30 Hz which matches the μ and β bands, which leads us to analyse the specific frequency band at certain duration.
The HHS gives us the time-frequency distribution of EEG signals. Next, the local marginal spectrums of channel C3 and C4 signals for left and right hand MI are calculated according to Equation 10 which can represent total amplitude (or energy) contribution from the interested frequencies. The difference of the local marginal spectrums of channel C3 and C4 EEG signals of left and right hand MI is represented in Figure 4.

Figure 4: The local marginal spectrums of channel C3 and C4 EEG signals for left and right hand MI.
According to the difference of the local marginal spectrums of EEG signals, the frequency band of the biggest energy difference in two motor imagery tasks and the statistical features of mean μm and variance σ2 are selected and calculated. What’s more, this work employs a new feature, Hilbert-Huang entropy (HHE), to represent the difference of EEG signals of two MI tasks.
Previously, the local marginal spectrum of the EEG signals of motor imagery is changing in different period and time interval. Therefore, this work applies time sliding window technique to segment the original EEG signals for calculating the Hilbert-Huang entropy features. Finally, the EEG data from 3.5 to 6.5 s is selected by setting a time window of 3 seconds and the step is 0.5 s at channel C3 and C4, and the HHE features are calculated and form the final feature vector for classification.
SVM algorithm with the RBF kernel function is applied to the distinction of the extracted HHE features. Before classification, it is significant to find the best optimal parameters of c and g which belong to the RBF-SVM. In this research, genetic algorithm (GA) [23] is utilized to select the best c and g. Meanwhile, the maximal evolution algebras is 100 and the maximal populations is 20, and 5-fold cross validation (CV). Figure 5 shows the parameter optimization.

Figure 5: The parameter optimization process for the training dataset.
While the features of the training dataset are used, the best accuracy is 85%. The optimal parameters are used for classification of the training dataset and the testing dataset and the classification results are 85.57% and 85.0% respectively. The maximum classification accuracies obtained by the features of mean μm and variance σ2 of the local marginal spectrum are compared with the HHE features in Table 1.
| Features | Training dataset | Testing dataset |
|---|---|---|
| HHE | 85.57% | 85.0% |
| μm | 82.86% | 84.29% |
| σ2 | 80.0% | 84.29% |
Table 1: The classification results of HHE feature compared with μm and σ2.
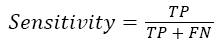
Moreover, the identification result of the RBF-SVM classifier is also evaluated by sensitivity and specificity defined as [24]
 →(18)
→(18)
 →(19)
→(19)
Where TP and TN are all the number of correctly detected true left hand tasks and true right hand tasks. The FP and FN represent the total number of false left hand tasks and false right hand tasks. Figure 6 shows the identification result of test trails utilizing RBF-SVM classifier.

Figure 6: The classification result of HHE feature using RBF-SVM for test trails.
Table 2 shows the sensitivity and specificity for test trails for three features of two mental tasks.
| Features | Sensitivity | Specificity |
|---|---|---|
| HHE | 80% | 90% |
| μm | 87.14% | 81.43% |
| σ2 | 74.29% | 94.43% |
Table 2: The sensitivity and specificity of RBF-SVM for three features of test trails.
The receiver operating characteristics (ROC) curve is a comprehensive measure to reveal the relationship of the sensitivity and specificity, and drawn by sensitivity (y-axis) and 1-specificity (x-axis). A series of sensitivity and specificity are calculated by setting out a number of different thresholds of continuous variations. The larger the area under ROC curve, the better of the classification accuracy. The ROC curves of RBF-SVM for different features are shown in Figure 7. It is clear that the ROC area of HHE feature is the largest which indicates the HHE is the best method for classification of two mental tasks in.

Figure 7: The ROC curves of three features.
Discussion
In this work, HHT algorithm is utilized to analyse the EEG signals for left and right hand MI. Firstly, the EMD method decomposes EEG signals into IMFs which are in decreasing order of frequency, and then the selected IMFs which fit the needed frequency band are used for Hilbert-Huang spectrum which displays the time-frequency distribution of EEG signals.
In general, the marginal spectrum h (ω) provides a measure of all amplitude (or energy) contribution from the interesting frequency. Therefore, many researchers obtain the features of EEG signals from the local marginal spectrum. However, the traditional features are usually statistical features which are not sufficient to describe the inner information of EEG signals. Shannon entropy (SE) reveals the irregular changes in signal properties like spectrum and amplitude distribution. Therefore, in this work, the SE method with HHT technique is used to extract the features of EEG signals in left and right hand motor imagery. So as to obtain the optimal HHE features, the time sliding window technique is used to segment the original EEG signals for calculating HHE features and the RBF-SVM algorithm with genetic algorithm (GA) is applied to distinguish the extracted HHE features. Finally, this work not only analyses the classification accuracy, but also evaluates the identification performance of RBF-SVM classifier by ROC curve.
From above results, the classification performance of HHE features proposed in this work is higher than the statistical features of mean μm and variance σ2 of the local marginal spectrum. The classification accuracy reaches the BCI competition classification accuracy level (the highest is 89.29%, the second is 84.29% and the third is 82.86% of BCI 2003 competition), and then the ROC area of HHE feature is the largest. Therefore, the proposed method for extracting EEG features of motor imagery is efficient and also can be utilized for processing other similar signals.
Conclusion
This work proposes a new EEG feature extracting method combining HHT and SE. The HHT has been utilized for EEG signals of two MI tasks for obtaining the time-frequency distribution. The time sliding window technique has been employed to segment the original EEG signals and acquire the local marginal spectrum at different time interval. The interested part of the local marginal spectrum is selected based on the μ and β rhythm to calculate the HHE features by SE algorithm. The HHE features of EEG signals from 3.5 to 6.5 s are feature vectors for RBF-SVM classifier which was trained to obtain the optimal parameters with GA algorithm. The identification results indicate that the proposed method in this work is feasible for extracting EEG features of motor imagery. The future research direction should be application of EEG feature extraction of BCI such as controlling a wheelchair so as to help those people with severe physical disabilities but cognitively intact.
Acknowledgements
This study has received kind and generous support from the Na tional Natural Science Foundation of China (61305147) and th e Natural Science Foundation of HeNan Province (1223004101 20, 13A416858).
References
- Noshadi S, Abootalebi V, Sadeghi MT, Shahvazian MS. Selection of an efficient feature space for EEG-based mental task discrimination. Biocybern BiomedEng 2014; 34: 159-168.
- Bamdadian A, Guan C, Ang KK, Xu JX. Real coded GA-based SVM for motor imagery classification in a brain-computer interface. Proc. 9th IEEE International Conference on Control and Automation (ICCA) 2011.
- Pfurtscheller G. Function brain imaging based on ERD/ERS. Vis Res 2001; 41: 1257-1260.
- Rodríguez-Bermúdez G, García-Laencina PJ, Roca-González J, Roca-Dorda. Efficient feature selection and linear discrimination of EEG signals. Neurocomputing; 2013; 115: 161-165.
- Schuyler R, White A, Staley K. Epileptic seizure detection. IEEE EngMed Biol Mag 2007; 26: 74-81.
- Burke DP, Kelly SP, Chazal P, Reilly RB, Finucane C. A parametric feature extraction and classification strategy for brain-computer interfacing. IEEE Trans Neural Syst Rehabil Eng 2005; 13: 12-17.
- Liao K, Zhu M, Ding L. A new wavelet transform to sparsely represent cortical current densities for EEG/MEG inverse problems. Comput Methods Programs Biomed2013; 111: 376-388.
- Jing-tian T, Qing Z, Yan T, Bin L, Xiao-kai Z. Hilbert-Huang transform recognition P Appl Geo phy 2005: 1063-6919.
- Oweis RJ, Abdulhay EW. Seizure classification in EEG signals utilizing Hilbert-Huang transform. Biomed Eng 2011; 10:38-52.
- Hu M, Li G, Ding Q, Li J. Classification of normal and hypoxia EEG based on Hilbert-Huang transform. Int ConfNeuralNetwork Brain 2005; 2: 851-854.
- Rutkowsk TM, Zdunek R, Cichock A. Multichannel EEG brain activity pattern analysis in time-frequency domain with nonnegative matrix factorization support. Int Cong Series 2007; 1301:266-269.
- Solis-Escalante T, Gentiletti GG, Yañez-Suarez O. Single trial P300 detection based on the empirical mode decomposition. ProcAnn Int Conf 2006: 1157-1160.
- Rajeev S, Ram BP. Classification of epileptic seizures in EEG signals based on phase space representation of intrinsic mode functions. Exp Sys Appl 2015; 42:1106-1117.
- Shannon CE. A mathematical theory of communication. Bell Syst Tech 1948: 379-423.
- Martis RJ. Application of empirical mode decomposition (EMD) for automated detection of epilepsy using EEG signals. Int J Neural Syst 2012; 22:1250027.
- Hemalahta RJ, Hari KG. Prediction of temporal lobe epilepsy using CWT-Entropy based on method. Int JEng SciTechnol 2011; 3: 4324-4330.
- Zhengqiang N, Lei W. EEG signal processing in Anaesthesia feature extraction of time and frequency parameters. Proced Envir Sci 2011; 8: 215-220.
- Huang NE. The empirical mode decomposition and the Hilbert spectrum for nonlinear and non-stationary time series analysis. Proc Math Phy Eng Sci 1998; 454: 903-995.
- Huang NE, Wu ML, Qu W. Applications of Hilbert Huang transform to non-stationary financial time series analysis. Appl Stoch Models Bus Ind 2003; 19: 245-268.
- Weibo Y, Shuang Q, Hongzhi Q. EEG feature comparison and classification of simple and compound limb motor imagery. Neuroeng Rehabil 2013; 10: 106.
- Wei-Yen H. Improving classification accuracy of motor imagery EEG using genetic feature selection. Clin EEG Neurosci 2014; 45: 163-168.
- Schlögl A, Neuper C. Pfurtscheller G. Estimating the mutual information of an EEG-based Brain-Computer-Interfac. Biomedizinische Technik 2002; 47: 3-8.
- Wang YQ. Computational identification of human long intergenic noncoding RNAs using a GA-SVM algorithm. Gene 2014;533: 1439-1443.
- Kai F, Jianfeng Q, Yi C. Classification of seizure based on the time-frequency image of EEG signals using HHT and SVM. Biomed Sig Proc Cont 2014; 13: 15-22.