Research Article - Biomedical Research (2017) Volume 28, Issue 10
Modified Dixon technique for MRI water-fat separation using jointly amplitude and phase
1Dipartimento di Ingeneria, Università di Napoli “Parthenope” Centro Direzionale di Napoli, Isola, Napoli, Italy
2Dipartimento di Scienze e Tecnologie, Università di Napoli “Parthenope” Centro Direzionale di Napoli, Isola, Napoli, Italy
- *Corresponding Author:
- Fabio Baselice
Dipartimento di Ingeneria
Università di Napoli “Parthenope”
Centro Direzionale di Napoli, Italy
Accepted date: February 9, 2017
Abstract
Background: Three Point Dixon technique is a methodology able to separate water and fat components within magnetic resonance images, exploiting the phase of the complex data. It works exploiting the phase differences between three MRI images acquired with different Echo Times. Within the procedure, the most problematic step is the so called phase unwrapping operation.
Methods: We propose a new approach for unwrapping the acquired image phases. The presented technique works directly on each single complex image instead of phase differences, allowing reconstructions with high accuracy. The methodology jointly exploits the amplitude and the phase information. For assuring high computational efficiency and fast convergence to the global optimal solution, a graph cuts based optimization approach has been implemented.
Results: The proposed technique has been first applied to a phantom simulating a magnetic resonance image of the human head. Subsequently, the algorithm has been tested on a real data set consisting of three head images acquired in axial position. In both cases, results have been compared with the ones obtained using classical unregularized version of three point Dixon technique.
Conclusions: A novel, computationally fast and effective algorithm for phase unwrapping in three point Dixon water and fat separation is presented. The methodology provides regularized fat and water component estimation with a higher accuracy compared to the classical approach.
Keywords
Magnetic resonance imaging, Fat-water separation, Phase unwrapping, Graph-cuts, Markov random field
Introduction
Magnetic Resonance Imaging (MRI), being a coherent imaging technique, detects the signal produced by volume elements (voxels) of the object being imaged in complex domain. Due to its peculiarities, it is widely adopted for soft tissues imaging. In last decades several imaging sequences have been proposed, each one with different characteristics. With proper acquisition schemes, MRI is able to produce high quality images of body slices, differentiating tissues due to their physical properties, such as proton density or spin relaxation times [1-3].
Commonly, in medical environment the amplitude part of MRI complex raw data that provides contrast map is used for diagnostic purposes, but neglecting the phase signal implies a loss of information. As a matter of fact, the phase image can measure physical quantities of interest which are useful for some MRI applications, such as magnetic field in homogeneities compensation, flowing spin velocity estimation, image denoising and water-fat separation [4-7].
In this paper we focus on the latter application. Suppression of fat signal in magnetic resonance images allows the eliminations of interfering signal on T1-weighted gadoliniumenhanced images, of chemical shift artifacts, and increases the dynamic range of tissue contrast.
One of the most widely used acquisition method that can achieve the water-fat separation process was first suggested by Dixon [4]. Exploiting the phase differences between three MRI images (commonly referred to as MRI interferograms), the Three-Point Dixon (3PD) method provides an estimation of fat and water signals [6,8,9].
In order to apply the 3PD method, the interferograms have to be known in the (-∞, +∞) interval, so a Phase Unwrapping (PU) procedure is needed in order to restore the absolute phase from its principal value in modulo 2π. In last two decades, significant improvements to this technique have been developed [10-12].
In this paper we propose a revised 3PD method which allows unwrapping and simultaneously regularizing the noisy wrapped measured phases jointly with the amplitudes using graph cut theory. Thanks to its robustness with respect to noise, the proposed algorithm works directly on each single complex image instead of interferograms, i.e. phase differences, allowing less noisy reconstructions compared to traditional 3PD technique.
In the section II of the manuscript, the traditional 3PD method will be explained starting from MRI signal composition. In section III the joint amplitude-phase model will be briefly discussed. The optimization technique will be presented in section IV. The revised 3PD method will be presented and the obtained results will be shown and discussed in section V. Finally, we will draw some conclusions about the presented technique.
Methods
Three point Dixon methodology
The three-point Dixon method consists of collecting three separate image data sets in order to have different phase shifts between fat and water magnetization; in this paper gradient echo with proper echo times TE are considered as imaging sequences [13,16].
In MRI, the signal comes from nuclei with spin which rotate at a certain frequency, called the Larmor frequency, depending on the kind of nuclei and the energy of the state in which they are, being in a magnetic field B0.
Let us consider a complex MR image mi taken at an echo time TE, i; the acquired signal is composed of the superposition of two components: a water component mw precessing at a frequency ω, and a fat component mf precessing at a frequency ω+Δωf.
The analytic expression mi of the noise free complex signal related to a pixel across the MR image is then given by:
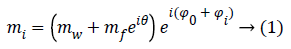
Where Φ0=-ωTE, i is the initial phase due to the Larmor frequency of the water ω and θ=-ΔωfTE, i is the phase difference between water and fat, related to different precession frequencies. The Φi term takes into account phase variations related to system imperfections and will be neglected in the rest of the paper.
Since ωf is known with an elevate precision, we can choose three TE, i so that θ=0, π, 2π, in order to obtain the following three images:
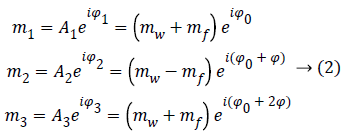
Where Φ is the phase due to the precession between two echoes, i.e.:
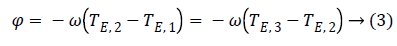
Note that since the initial phase Φ0 can be computed from the first image m1. It can be eliminated from the whole data set. From images m1 and m3 we can estimate precession phase Φ:
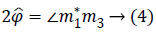
Where the symbol * indicates the complex conjugate and the operator extracts the angle.
We can then phase correct m2 and combine it with m1 in order to compute water and fat image estimations:

This seemingly simple approach would generate properly reconstructed fat and water images if no 2π wraps are present in phase data, otherwise a phase unwrapping operation before computing Equation 5 is required.
Joint amplitude-phase model
Let us focus on one image and consider the pth pixel. Given Mp and ψp the measured noisy amplitude and phase values, respectively, we want to jointly estimate the noise free amplitude Ap and phase value ψp of the considered pixel using a Markovian approach. In order to perform the estimation, we have to consider the likelihood function and the prior terms related to the Markovian energy [14].
Likelihood term-The joint negative log-likelihood of the amplitude and phase at the pixel p is a function of the parameters Ap and ψp, which have to be estimated. Its expression is given by [15] as Equation 76.

Where σ is the standard deviation of the Gaussian noise that affects both real and imaginary parts of the complex signal [16].
Prior term-The Total Variation (TV) model has been selected to describe the prior term. Since MR images are characterized by many sharp transitions in phase and amplitude images, the TV model results to be effective as it preserves discontinuities, i.e. edges within the images, without excessively penalizing smooth functions [17]. Phase discontinuities usually have the same location as amplitude discontinuities, thus we combine the discontinuities using a disjunctive max operator. The joint prior model is defined by [18] as Equation 7.
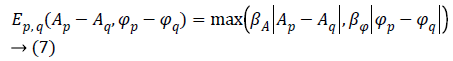
Where q is the index related to one of the 4 nearest pixel of the pixel p, while βA and βΦ are two hyperparameters used to balance the amount of smoothing in the regularized phase and amplitude images.
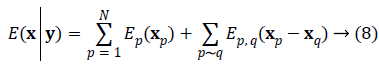
We write the total energy function as
Where  is the unknown vector collecting both noise
less amplitude and phase values,
is the unknown vector collecting both noise
less amplitude and phase values,  is the observed
vector collecting the acquired complex data, N is the size of the
restored data, (p~q) denotes neighboring sites p and q, Ep (xp)=Ep (yp | xp) denotes the likelihood terms defined in
Equation 6 and
is the observed
vector collecting the acquired complex data, N is the size of the
restored data, (p~q) denotes neighboring sites p and q, Ep (xp)=Ep (yp | xp) denotes the likelihood terms defined in
Equation 6 and  denotes the
regularization terms defined in Equation 7.
denotes the
regularization terms defined in Equation 7.
Solving the problem of joint phase and amplitude regularization consists of finding the optimal vectorial solution x that minimizes the non-convex multilabel energy function as Equation 8.
In the last years, graph-cut based optimization algorithms have shown to be effective for optimization tasks [19,20]. In this work, we developed a new graph-cut based vectorial approximate optimization algorithm that is based on the so called binary vectorial moves, i.e. in each iteration of the energy minimization process both amplitude and phase images change their configurations until convergence to a local minimum.
We note that the exact minimization using Ishikawa graph [19] cannot be reached in this case due to the fact that labels are not scalar, so the ordering constraint on labels required by Ishikawa construction is not possible. Because of the nonconvexity of the total energy function as Equation 8, we address the non-convexity of the total energy function using a strategy based on binary partition moves to converge toward a good local optimum. An algorithm called CAPE, based on a periodic jump move strategy, is proposed performing phase reconstruction with a good precision quality [21]. At each iteration n of the minimization process, a succession of up and down binary phase jump moves are performed on the current configuration with a jump step of Δ=2π/2n, until the required depth of precision is achieved. In our work, this algorithm was adapted to vectorial moves with precision both on phase and amplitude.
Revised three point Dixon technique
The idea at the base of the revised 3PD is to separately unwrap the phase of each of the three available complex MR images m1, m2 and m3 instead of the well-known technique of working with the interferograms [10,12]. As the statistical distribution of the wrapped phase is known, this approach ensures lower reconstruction error with respect to working on phase differences. Moreover, the estimation is performed jointly with the amplitude of the data, in order to better manage the discontinuities and to obtain a regularized version of both phase and amplitude. This means that the final amplitude and unwrapped phase are less noisy compared to the acquired ones. It is important to note that the regularization is performed exploiting the statistics of the complex available data. Once obtained estimated phases ̂Φ1, ̂Φ2, ̂Φ3 data. Once obtained estimated phases Â1, Â2, Â3 we can compute the interferogram as 2̂Φ31 and insert them in Equation 5, obtaining
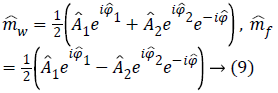
which produces less noisy water and fat estimations.
Results and Discussion
In order to prove the effectiveness of the proposed approach we apply the method to a realistically simulated data set, and to a real MR image set. In all cases the hyperparameters β have been manually set in order to tune the model.
First, we test the revised 3PD on a phantom simulating the MR image of human head tissues. The considered 255 177 pixel phantom is composed of the superimposition of water and fat signals. Three gradient echo MR images have been simulated with the following parameters: B0=1.5 T, ω=4.0127 108 rad/ sec, Δωf=1318.8 rad/sec, TE=11.9 ms, 15.5 ms and 19 ms. Complex noise has been added in order to achieve a mean SNR of 6.5 dB, 6 dB and 5 dB for the three images. Low SNR values have been considered in order to evaluate the performances in difficult cases, i.e. very weak signals.
Water and fat components are shown respectively in Figures 1a and 1b, while Figures 1c and 1d represent the amplitude and the phase of one of the three available MRI raw data respectively.

Figure 1: Water component (a), fat component (b), one noisy amplitude image (c), one noisy phase image (d), one regularized amplitude image (e), one regularized and unwrapped phase (f), reconstructed water component using modified 3PD (g) (mean square error=6.6 × 10⁻⁴), reconstructed fat component using modified 3PD. (h) (mean square error=1.5 × 10⁻⁴), reconstructed water component using classical 3PD (i) (mean square error=5.7 × 10⁻³), reconstructed fat component using classical 3PD (l) (mean square error=2.0 × 10⁻³).
We apply the proposed method on this data set in order to separate water and fat components. The proposed method has been applied to all complex images; the results of amplitude regularization and phase unwrapping and regularization are reported in Figures 1e and 1f. Figures 1g and 1h show the reconstructed water and fat components of the phantom using the revised 3DP.
For comparison, water and fat component separated using the classical unregularized version of 3PD are reported in Figures 1i and 1l; the phase unwrapping operation has been performed using PUMA code, which does not perform any regularization [22]. The effectiveness of the proposed approach can be appreciated by comparing the reconstructed components (Figures 1g and 1h) with the original ones (Figures 1a and 1b) and with classical 3PD results (Figures 1i and 1l). It is important to underline the robustness of the proposed algorithm that is able to correctly solve the PU problem even if the noisy wrapped phase presents discontinuities (Figure 1d).
Figure 2 shows the histogram of a portion of the water reconstructed component both with modified and classical 3PD. Once again the positive effect of regularization can be noted.

Figure 2: Overlapped histograms of constant water regions reconstructed with classical 3PD (blue line, region a) and modified 3PD (red line, region b).
Finally, in order to prove the effectiveness of the method on real data, we apply our algorithm to a data set consisting of three head images acquired in axial position with three different echo times. The images, taken from the Radiological Sciences Laboratory, Stanford University, School of Medicine, are obtained using a gradient recalled sequence. The parameters were: B0=0.5 Δωf=452.2 rad/sec, TE=12.8 ms, 19.2 ms and 25.6 ms. Figures 3a and 3b show the phase signal of the first two images while Figures 3c and 3d represents the unwrapped and regularized phase signal obtained with the proposed method. Water and fat components estimation using modified 3PD and classical 3PD are shown in Figures 3e-3h, respectively, and the histograms of a region are represented in Figure 4. Concerning the computational cost, each joint regularization of phase and amplitude takes about 5 minutes on the real data set with a Sun Ultra40 workstation.

Figure 3: First and second wrapped phase images (a, c) (rad), first and second regularized and unwrapped phase images (c, d) (rad), water and fat reconstruction using modified 3PD (e, f) and classical 3PD (g, h).

Figure 4: Overlapped histograms of gray matter regions reconstructed with classical 3PD (blue line, region a) and modified 3PD (red line, region b).
Conclusions
In this paper a revised version of the 3PD methodology working on each single complex image has been presented. Differently from other approaches present in literature, the peculiarity of working jointly with both phase and amplitude signals allows at the same time to both separate and regularize the fat and water component maps. In order to achieve such result, Bayesian estimation theory has been exploited. The method has shown its effectiveness with both simulated and true data. The procedure is not computationally heavy thanks to the fast convergence of the graph cuts optimization algorithm. Further work will consist in evaluating performances in case of more challenging cases study, such as abdomen or knee imaging.
Acknowledgment
The authors would like to thank Professor John Pauly for providing real MRI complex data.
References
- Slichter P. Principles of magnetic resonance. Springer NY (3rd Edn.) 1996.
- Baselice F, Ferraioli G, Pascazio V. T1 and T2 estimation in complex domain: first results on clinical data. Concepts Magnetic Resonance Part A 2014; 43: 166-176.
- Ambrosanio M, Baselice F, Ferraioli G, Lenti F, Pascazio V. Intra voxel analysis in magnetic resonance imaging. Magn Reson Imaging 2016; 37: 70-80.
- Bley TA, Wieben O, François CJ, Brittain JH, Reeder SB. Fat and water magnetic resonance imaging. J Magn Reson Imaging 2010; 31: 4-18.
- Dixon WT. Simple proton spectroscopic imaging. Radiology 1984; 153: 189-194.
- Glover GH, Schneider E. Three-point Dixon technique for true water/fat decomposition with B0 inhomogeneity correction. Magn Reson Med 1991; 18: 371-383.
- Baselice F, Ferraioli G, Pascazio V, Sorriso A. Bayesian MRI denoising in complex domain. Magn Reson Imaging 2017; 38: 112-122.
- Szumowski J, Coshow WR, Li F, Quinn SF. Phase unwrapping in the three-point Dixon method for fat suppression MR imaging. Radiology 1994; 192: 555-561.
- Ghiglia DC, Pritt MD. Two-dimensional phase unwrapping: theory, algorithms and software. Wiley Online 1998.
- Ma J. Dixon techniques for water and fat imaging. J Magn Reson Imaging 2008; 28: 543-558.
- Reeder SB, McKenzie CA, Pineda AR, Yu H, Shimakawa A. Water-fat separation with IDEAL gradient-echo imaging. J Magn Reson Imaging 2007; 25: 644-652.
- Hernando D, Kellman P, Haldar JP, Liang ZP. Robust water/fat separation in the presence of large field in homogeneities using a graph cut algorithm. Magn Reson Med 2010; 63: 79-90.
- Baselice F, Ferraioli G, Pascazio V. A novel statistical approach for brain mr images segmentation based on relaxation times. Biomed Res Int 2015; 2015: 1-13.
- Li SZ. Markov random field modeling in image analysis. NewYork Springer Verlag 2001.
- Gudbjartsson H, Patz S. The Rician distribution of noisy MRI data. Magn Reson Med 1995; 34: 910-914.
- Baselice F, Ferraioli G, Grassia A, Pascazio V. Optimal configuration for relaxation times estimation in complex spin echo imaging. Sensors (Basel) 2014; 14: 2182-2198.
- Baselice F, Ferraioli G, Pascazio V. A Bayesian approach for relaxation times estimation in MRI. Magn Reson Imaging 2016; 34: 312-325.
- Denis L, Tupin F, Darbon J, Sigelle M. SAR image regularization with fast approximate discrete minimization. IEEE Trans Image Process 2009; 18: 1588-1600.
- Ishikawa H. Exact optimization for Markov random fields with convex priors. IEEE Trans Pattern Anal Mach Intell 2003; 25: 1333-1336.
- Boykov Y, Veksler O, Zabih R. Fast approximate energy minimization via graph cuts. IEEE Trans Pattern Anal Mach Intell 2001; 23: 1222-1239.
- Valadão G, Bioucas-Dias J. CAPE: combinatorial absolute phase estimation. J Opt Soc Am A Opt Image Sci Vis 2009; 26: 2093-2106.
- Bioucas-Dias JM, Valadão G. Phase unwrapping via graph cuts. IEEE Trans Image Process 2007; 16: 698-709.